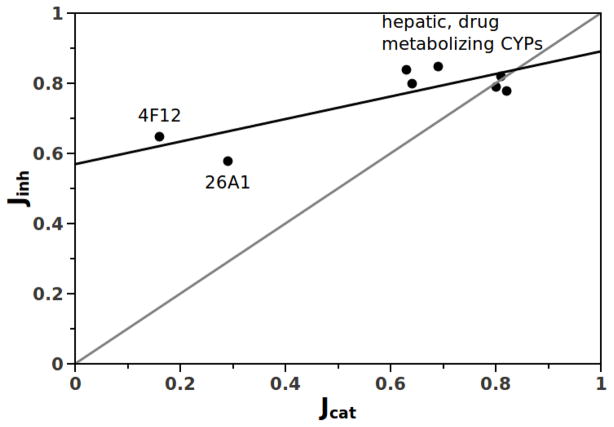
Figure 3.
Plot of Jinh vs. Jcat for CYPs 3A4, 2D6, 2C8, 2C9, 2C19, 1A2, 26A1, 4F12. The gray diagonal line is for visualization only and represents a perfect correlation between Jcat and Jinh, The fitted line (r2 = 0.68, slope = 0.32) indicates that the negative trade-off of Jinh is nearly insignificant as the CYPs become more catalytically promiscuous. The shallow slope of the line is due to inherently high Jinh even for enzymes with low Jcat.

