Abstract
The metal-induced micelle-to-vesicle phase change that the ferric complex of the microbially produced amphiphile, marinobactin E (ME), undergoes has been investigated by X-ray diffraction (XRD) and X-ray absorption spectroscopy (XAS). Marinobactin E is one member of the suite of siderophores, marinobactins A–E, that are used by the source bacterium to facilitate iron acquisition. Fe(III)–ME undergoes a micelle-to-multilamellar vesicle transition in the presence of Cd(II) and Zn(II). XRD measurements indicate the interlamellar repeat distance of the Cd(II)- and Zn-(II)-induced multilamellar vesicles is ~5.3 nm. XAS spectra of the sedimented Cd(II)- and Zn(II)-induced multilamellar vesicles suggests hexadentate coordination of Cd(II) and Zn(II) consisting of two monodentate carboxylate ligands and four water ligands. This coordination environment supports the hypothesis that Cd(II) and Zn(II) bridge the terminal carboxylate moiety of two Fe(III)–ME headgroups, pulling the headgroups together in an arrangement that favors vesicle formation over the formation of micelles. XAS spectra of the Fe(III) center in the sedimented Cd(II)-and Zn(II)-induced vesicles confirm the anticipated six-coordinate geometry of Fe(III) by the ME headgroup via the two hydroxamate groups and the α-hydroxy amide moiety.
Introduction
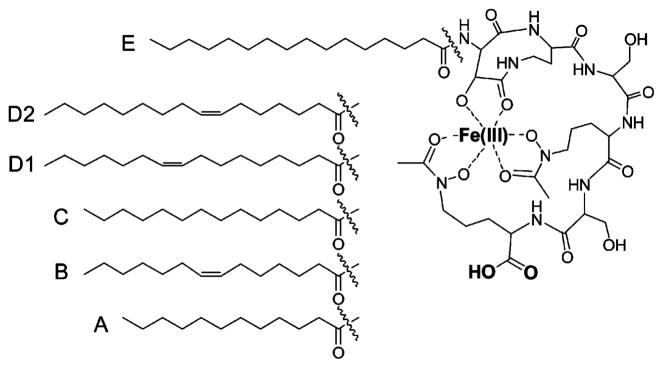
Metal chelating surfactants have attracted considerable attention for their ability to self-assemble, thereby presenting an organized interface of metal cations.1,2 Assemblies of metal-chelating surfactants have been utilized in a variety of fields such as catalysis,3,4 environmental remediation of toxic metals,5,6 and magnetic resonance imaging contrast agents.7 Some metal chelating surfactants undergo a change in aggregate morphology upon metal coordination.8–15 For example, micelles of 4,8-dioctyl-3,9-dioxo-6-hydroxy-4,8-diaza-1,11-undecanedicarboxylate undergo a phase transition to vesicles upon coordination of Cu(II) to the dicarboxylate head group.16 The phospholipid cardiolipin assembles as a lamellar phase in the absence of metals and forms a reverse-hexagonal phase in the presence of certain divalent metal cations.17 Marinobactins A–E (MA–ME, Figure 1) are a suite of microbial surfactants known as siderophores that also undergo a change in aggregate morphology upon metal coordination.18–20 Each marinobactin is composed of the same peptidic headgroup that coordinates Fe(III), and each marinobactin is appended by a different fatty acid tail that confers the amphiphilic properties to these molecules.
Figure 1.
Structure of Fe(III)–marinobactins A–E. The headgroup contains a carboxylic acid moiety that is anionic at neutral pH.
Apo-marinobactin E forms spherical micelles that are ca. 4.6 nm in diameter.18 Upon coordination of 1 equiv of Fe(III), the micellar phase persists, although the diameter of the Fe(III)–ME micelles decreases to ca. 3.5 nm.18,19 We recently reported that the addition of Cd(II), Zn(II), La(III), or excess Fe(III) to Fe-(III)–ME micelles induces the formation of ~100–200-nm-diameter multilamellar vesicles.18–20 We hypothesized that these metal cations induce vesicle formation by bridging the terminal carboxylate moiety of multiple Fe(III)–ME headgroups, drawing the headgroups closer together in an arrangement that favors vesicle formation (Scheme 1).18,19 The proposed carboxylate–metal bridging mechanism is consistent with the coordination chemistry of these metals with carboxylate-based ligands.21 In this investigation, X-ray absorption spectroscopy (XAS) is used to probe the Cd(II), Zn(II), and Fe(III) sites in the Cd(II)- and Zn(II)-induced vesicles of Fe(III)–ME. XAS results indicate that Cd(II) and Zn(II) are coordinated by two carboxylate ligands and thus function to bridge two Fe(III)–ME headgroups in the vesicle phase.
Scheme 1. Proposed Cation-Induced Carboxylate Cross-Linking of Fe(III)–ME Headgroups as a Mechanism to Promote the Micelle-to-Vesicle Transitiona.
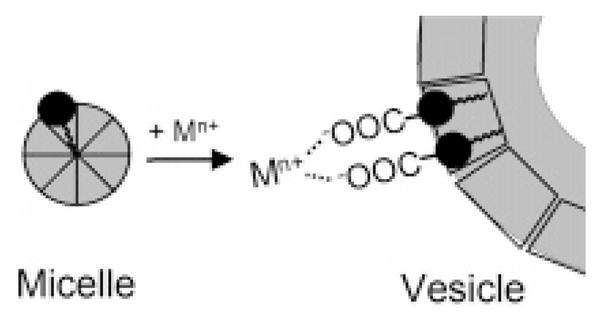
a The resulting “composite surfactant” would have a lower headgroup-area/tail-volume ratio that may favor vesicle formation.22
Materials and Methods
Definitions
Fe(III)–ME refers to the iron complex of marinobactin E. Apo-ME refers to marinobactin E that is not coordinated to a metal.
Materials
Deuterium oxide, deuterium chloride, and sodium deuteroxide were purchased from Cambridge Isotope Laboratories, Inc. Triply deionized water (Barnstead NANOpure II) was used in all experiments. All other chemicals and organic solvents were purchased from EM Science. Apo-MB, apo-MD, and apo-ME were isolated and purified as previously described.18,20
Sample Preparation
D2O was used as a solvent in place of H2O for comparison to previous SANS measurements, which were also performed in D2O.18,19 Samples analyzed by DLS consisted of 1.4 mM Fe(III)–ME in D2O at pD 6.0. Fe(III)–ME was prepared by adding 0.9 equiv of Fe(III) to apo-ME. The concentration of apo-ME was determined by spectrophotometric titration at 400 nm (i.e., the λmax of Fe(III)–ME) with a standardized stock solution of Fe(III). Fe(III) was added to apo-ME from a standardized stock solution of 0.073 M FeCl3 in 0.05 M DCl in D2O. The concentration of the Fe(III) stock solution was determined spectrophotometrically with 1,10-phenanthroline at pH 4 after the addition of hydroxylamine: Fe(phen)32+ with λmax = 510 nm ε = 11 000 M−1 cm−1.23 pD adjustments were accomplished with NaOD and DCl. The standard correction of pD = pH + 0.4 was applied for all titrations in D2O.
The metal cations were added to Fe(III)–ME solutions at 25 °C from stock solutions of 1 M CdCl2 or ZnCl2 in 0.05 M DCl in 99.9% D2O and then equilibrated at 37 °C for at least 3 days prior to DLS measurements. Specifically, 2.5 equiv of Cd(II) or Zn(II) per equivalent of Fe(III)–ME (1.4 mM Fe(III)–ME, pD 6.0, 37 °C) was added to induce multilamellar vesicle formation, followed by equilibration for 72 h at 37 °C. After equilibration, the Cd(II)- and Zn(II)-induced vesicles were sedimented by centrifugation at 13 200 rpm for 20 min (at 25 °C) in order to concentrate the vesicles for X-ray diffraction (XRD) and XAS measurements.
X-ray Diffraction
X-ray diffraction (XRD) measurements were performed in-house at the Materials Research Laboratory X-ray facility. X-rays were generated using an 18 kW Rigaku rotating anode generator. An average X-ray wavelength of 1.54 Å was used to analyze the sample. Scattered X-rays were collected by an 18-cm-diameter Mar image plate detector at a sample-to-detector distance of 758 cm. This configuration allowed wavevector transfers (Q) in the range of 0.03 Å−1 < Q < 0.45 Å−1, where Q = (4π/λ)sin(θ/2) and θ represents the X-ray scattering angle. The sedimented Cd(II)-and Zn(II)-induced vesicles were loaded into 2-mm-diameter quartz capillaries (Charles Supper Company) for XRD measurements.
Dynamic Light Scattering
DLS measurements were carried out on a Brookhaven BI-200SM goniometer with an AT9000 digital autocorrelator equipped with a Melles Griot 30 mW HeNe laser (λ= 633 nm). The correlation function itself was calculated between delay times of 5 and 1 × 10⁵ μs and analyzed by the method of cumulants.24 Measurements were taken in 12 mm round glass cells in a temperature-controlled toluene bath with the detector set perpendicular (90°) to the incident laser beam. The diffusion coefficient was calculated using values of the viscosity and refractive index of D2O at the appropriate temperature, and a hydrodynamic diameter was calculated by assuming that the particle was spherical. Measurements of particle size by DLS were repeated several times to obtain a standard deviation of ~5 nm for the hydrodynamic diameter. The DLS instrument used for these experiments cannot be used to characterize particles with diameters of less than ~7 nm and thus cannot be used to size the micelles encountered in this work.
X-ray Absorption Spectroscopy
Fe, Zn, and Cd K-edge EXAFS spectra were collected at the Stanford Synchrotron Radiation Laboratory (SSRL), beam line 11-2 under SPEAR3. Samples in capillary tubes were placed directly in the beam at room temperature with a beam aperture illuminating only the sample area. The X-ray energy was selected using a Si(220) double-crystal monochromator with a collimating mirror for harmonic rejection. Energy was calibrated by defining the first derivative peak of the Fe, Zn, or Cd metal foils to be 7112, 9659, or 26 711 eV, respectively. Samples were collected in fluorescence mode using a 30-element Canberra Ge array detector. The total incoming count rates from fluorescent photons were less than 100 000 s−1 per element, which is within the linear response range of the detector. Spectra were collected over a certain range using a step size of 0.35 eV through the edge. Individual scans typically took approximately 25 min for completion. All spectra were averaged, background subtracted, and normalized using SIXPACK.25 Phase and amplitude files for the EXAFS fitting using SIXPACK were created with FEFF7.26,27 Because the metal binding sites with respect to ME can be inferred from the chemical structure, the coordination numbers during EXAFS fitting were held constant at integral values given the geometry of either the carboxylate or hydroxamate binding sites for Cd/Zn or Fe, respectively. This procedure helps to reduce the errors in the fitted Debye–Waller factors of each ligand shell because they are strongly correlated with the coordination number.
Results and Discussion
Dynamic Light Scattering
The addition of Cd(II) or Zn(II) (3.5 mM) to a micellar solution28 of Fe(III)–ME (1.4 mM, pD 6.0, 37 °C; see Materials and Methods for sample preparation) produces a turbid solution that is a result of multilamellar vesicle formation.19 Dynamic light scattering (DLS) measurements on the vesicles prepared for this study reveal monodisperse Cd(II)-and Zn(II)-induced vesicles of Fe(III)–ME (polydispersity <0.2) that are ~282 ± 7 nm in diameter for the Cd(II)-induced vesicles and ~110 ± 7 nm in diameter for the Zn(II)-induced vesicles.29 After equilibration for 72 h at 37 °C, each vesicle suspension was centrifuged to sediment and concentrate the vesicles for X-ray diffraction (XRD) and X-ray absorption spectroscopy (XAS) measurements.
X-ray Diffraction
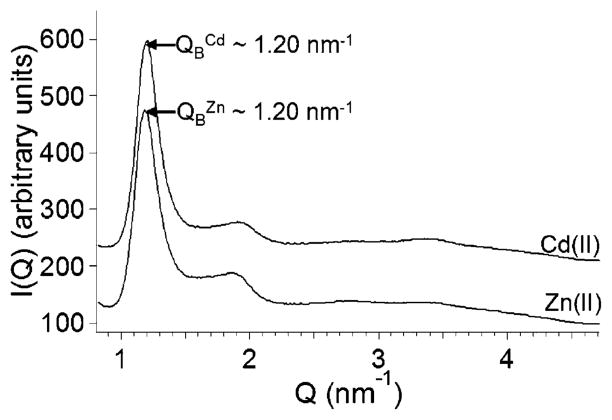
XRD profiles of the sedimented Cd(II)-and Zn(II)-induced vesicles (Figure 2) reveal a Bragg peak at , which suggests that the sedimented vesicles have an interlamellar repeat distance of 2π/QB ≈ 5.2 nm that is consistent with our previously reported small-angle neutron scattering (SANS) data.19 The position of the Bragg peak ( ) is at approximately the same Q value as the Bragg peak observed in the SANS profiles of the dispersed (i.e., nonsedimented) Cd(II)- and Zn(II)-induced vesicles (Q ≈ 1.1 nm−1).19 The shift in peak position of the Bragg peak in XRD profiles compared to that in SANS profiles suggests that the interlamellar repeat distance decreases slightly when the vesicles are sedimented.30
Figure 2.
XRD profiles of the sedimented Cd(II)- and Zn(II)-induced vesicles. The Bragg peak at Q1 is located on each XRD profile. XRD profiles are offset on the y axis for clarity.
X-ray Absorption Spectroscopy
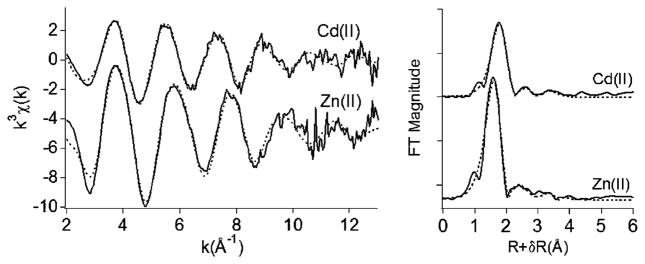
The XANES spectra of cadmium in the sedimented Cd(II)-induced vesicles display an edge energy reflective of Cd(II) at ~26 700 eV. Similarly, XANES spectra of zinc in the sedimented Zn(II)-induced vesicles exhibit an edge energy at ~9660 eV that is consistent with Zn-(II). EXAFS of the Zn and Cd K-edge absorption data shows oscillations that contain information on the distances between the metal cation and neighboring atoms. EXAFS spectra of the Cd(II) and Zn(II) sites were k3 weighted (Figure 3) and plotted as pseudoradial distribution functions (Fourier transforms not corrected for phase shifts) to allow a comparison of the distances between the metal cation and the neighboring atoms. The most intense peak at ~1.8 Å (uncorrected for phase) in the Cd(II) EXAFS spectrum is shifted to a slightly larger radius relative to the most intense peak in the Zn(II) EXAFS spectrum (Figure 3). This shift in peak position suggests that the nearest neighbors to Cd(II) reside further from the metal center than do the nearest neighbors to Zn(II), which is likely a result of the larger ionic radius of Cd(II) compared to that of Zn(II). Each Cd(II) and Zn(II) EXAFS spectrum fits to a model with six oxygen atoms in the first shell and two carbon atoms each in the second and third shells (Table 1). Such a model could be consistent with either bidentate coordination of two carboxylate ligands and two water molecules to Cd(II) and Zn(II) or with monodentate coordination of two carboxylates and four water ligands. However, the second-shell Zn–C distances in the EXAFS fits of the hexadentate Zn(II) (formate)2(H2O)4 complex at 2.8–3.05 Å for monodentate coordination of formate versus Zn(II)(acetate)2-(H2O)2 at ~2.6 Å for bidentate coordination of acetate suggest that the coordination environment of the Zn(II)-induced vesicles is more consistent with monodentate carboxylate coordination (i.e., Zn–C at 2.88 Å, Table 1).31
Figure 3.
EXAFS spectra and Fourier transforms of Cd(II) and Zn(II) sites in sedimented Cd(II)- and Zn(II)-induced vesicles of Fe(III)–ME, respectively. EXAFS spectra and Fourier transforms are offset on the y axis for clarity. Solid line (data); dotted lines (fits).
Table 1.
Cd(II) and Zn(II) EXAFS Fit Results for the First-Shell, Second-Shell, and Third-Shell Atoms
| sample | shell | CN | distance (Å) | σ2 |
|---|---|---|---|---|
| Cd(II)-induced vesicles of Fe(III)–ME | Cd/O | 5.9 | 2.282 ± 0.007 | 0.011 ± 0.001 |
| Cd/C | 2.0 | 3.10 ± 0.03 | 0.010 ± 0.003 | |
| Cd/C | 2.0 | 3.895 ± 0.008 | 0.008 ± 0.003 | |
| Zn(II)-induced vesicles of Fe(III)–ME | Zn/O | 5.9 | 2.047 ± 0.007 | 0.010 ± 0.001 |
| Zn/C | 2.0 | 2.88 ± 0.02 | 0.008 ± 0.003 | |
| Zn/C | 2.0 | 3.88 ± 0.09 | 0.011 ± 0.016 |
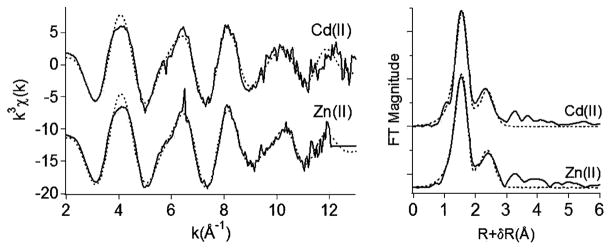
Each XANES spectrum of the Fe(III) site in the sedimented Cd(II)- and Zn(II)-induced vesicles displays an edge energy of ~7122.7 eV that is consistent with Fe(III). Each EXAFS spectrum of the Fe(III) site in the sedimented Cd(II)- and Zn(II)-induced vesicles displays a prominent peak at ~1.6 Å (uncorrected for phase, Figure 4). The coordination number and bond distance estimates are six O atoms at ~1.99–2.00 Å for the first shell and six C/N/O at ~2.76–2.89 Å for the second shell, respectively (Table 2). Although additional shells can be fit at distances of up to ~4.7 Å, it is difficult to obtain precise values for the properties of those shells without making assumptions due to the large number of fitting variables required and the noise level in the data. Nonetheless, the fitted coordination numbers and distances are consistent with Fe(III) coordination by the two hydroxamate functionalities and the α-hydroxyamide moiety of the marinobactin headgroup (Figure 1).
Figure 4.
EXAFS spectra and Fourier transforms of Fe(III) sites in sedimented Cd(II)- and Zn(II)-induced vesicles. EXAFS spectra and Fourier transforms are offset on the y axis for clarity. Solid line (data); dotted lines (fits).
Table 2.
Fe(III) EXAFS Fit Results for the First-Shell and Second-Shell Atoms
| sample | shell | CN | distance (Å) | σ2 |
|---|---|---|---|---|
| Cd(II)-induced vesicles of Fe(III)–ME | Fe/O | 6.0 | 1.999 ± 0.005 | 0.006 ± 0.001 |
| Fe/C | 4.0 | 2.86 ± 0.08 | 0.006 ± 0.006 | |
| Fe/N | 2.0 | 2.79 ± 0.15 | 0.006 | |
| Zn(II)-induced vesicles of Fe(III)–ME | Fe/O | 6.4 | 1.992 ± 0.004 | 0.006 ± 0.001 |
| Fe/C | 4.0 | 2.88 ± 0.01 | 0.003 ± 0.002 | |
| Fe/N | 2.0 | 2.76 ± 0.02 | 0.003 |
Conclusions
The EXAFS spectra of Cd(II) and Zn(II) in the Cd(II)- and Zn(II)-induced vesicles of Fe(III)–marinobactin E are consistent with hexacoordinate Cd(II) and Zn(II) sites ligated by six oxygen atoms of which two come from monodentate carboxylate ligands. The estimated metal–oxygen bond lengths to Zn(II) and Cd(II) (Table 1) are similar to those obtained from EXAFS spectra of model carboxylate compounds Zn(II)(acetate)231 and Cd(II)-(acetate)232 (i.e., ~2.1 and 2.28 Å, respectively). The longer metal–carbon distance for both Zn(II) and Cd(II) in the vesicles (2.88 and 3.10 Å, respectively, in Table 1 vs ~2.6 Å for bidentate coordination of acetate to Zn(II)31 and 2.70 Å for bidentate coordination of acetate to Cd(II)32) is thus more consistent with monodentate coordination of carboxylate from the terminal carboxylate of marinobactin E than with bidentate coordination.
The EXAFS spectra of Fe(III) in the sedimented Cd(II)- and Zn(II)-induced vesicles corroborate the coordination of Fe(III) by the two hydroxamate groups and the α-hydroxy amide functionality of the marinobactin headgroup (Figure 1). The estimated Fe(III)–oxygen bond length of ~2.00 Å (Table 2) matches the Fe(III)–oxygen bond length obtained from EXAFS spectra of other ferric siderophore complexes such as Fe(III)–desferrioxamine B33 and Fe(III)–enterobactin.34 Similarly, the estimated Fe(III)–carbon/nitrogen distance obtained for Fe(III)–ME (Table 2) matches the corresponding values of Fe(III)–desferrioxamine B and Fe(III)–enterobactin to within ~0.1 Å.33,34 Thus, Fe(III) EXAFS suggests that the coordination of Cd(II) or Zn(II) does not alter the Fe(III) coordination by the marinobactin headgroup.
XRD patterns obtained from sedimented Cd(II)- and Zn(II)-induced vesicles displayed a Bragg peak (Figure 2) at a similar Q value to the Bragg peak observed in SANS profiles of dispersed Cd(II)- and Zn(II)-induced vesicles.19 The preservation of the Bragg peak upon sedimentation indicates that the semicrystalline microstructure (i.e., interlamellar repeat distance) of the multilamellar vesicles is not significantly disturbed upon centrifugation.
Thus XAS and XRD results support biscarboxylate coordination from the peptide carboxylate to Cd(II) and Zn(II) as a mechanism to bridge the Fe(III)–ME headgroups and thus drive the phase change from micelles to multilamellar vesicles. Future experiments using freeze–fracture transmission electron microscopy (FF-TEM) to image the metal-induced vesicles may lend additional insight into the structure of these self-assembled aggregates. Additional experiments are in progress to investigate the metal-induced phase behavior of other amphiphilic ligands, particularly with regard to developing strategies to tune metal-induced self-assembly reactions.
Acknowledgments
We gratefully acknowledge support from NIH GM38130 (A.B.) and NSF EMSI CHE0221978 (A.B.). Portions of this research were carried out at the Stanford Synchrotron Radiation Laboratory, a national user facility operated by Stanford University on behalf of the U.S. Department of Energy, Office of Basic Energy Sciences. The SSRL Structural Molecular Biology Program is supported by the Department of Energy, Office of Biological and Environmental Research, and by the National Institutes of Health, National Center for Research Resources, Biomedical Technology Program.
References
- 1.Griffiths PC, Fallis IA, Chuenpratoom T, Watanesk R. Adv Colloid Interface Sci. 2006;122:107–117. doi: 10.1016/j.cis.2006.06.010. [DOI] [PubMed] [Google Scholar]
- 2.Donnio B. Curr Opin Colloid Interface Sci. 2002;7:371–394. [Google Scholar]
- 3.Polyszos A, Hughes AB, Christie JR. Langmuir. 2007;23:1872–1879. doi: 10.1021/la0626454. [DOI] [PubMed] [Google Scholar]
- 4.Moss RA, Gong PK, Morales-Rojas H. Org Lett. 2002;4:1835–1838. doi: 10.1021/ol0200394. [DOI] [PubMed] [Google Scholar]
- 5.Coulombeau H, Testard F, Zemb T, Larpent C. Langmuir. 2004;20:4840–4850. doi: 10.1021/la049832r. [DOI] [PubMed] [Google Scholar]
- 6.Larpent C, Prévost S, Berthon L, Zemb T, Testard F. New J Chem. 2007;31:1424–1428. [Google Scholar]
- 7.Vaccaro M, Accardo A, Tesauro D, Mangiapia G, Löf D, Schillén K, Söderman O, Morelli G, Paduano L. Langmuir. 2006;22:6635–6643. doi: 10.1021/la053500k. [DOI] [PubMed] [Google Scholar]
- 8.Luo X, Miao W, Wu S, Liang Y. Langmuir. 2002;18:9611–9612. [Google Scholar]
- 9.Luo X, Wu S, Liang Y. Chem Commun. 2002;5:492–493. doi: 10.1039/b110797f. [DOI] [PubMed] [Google Scholar]
- 10.Apostol M, Baret P, Serratrice G, Desbrières J, Putaux JL, Stébé MJ, Expert D, Pierre JL. Angew Chem. 2005;117:2636–2638. doi: 10.1002/anie.200462841. [DOI] [PubMed] [Google Scholar]
- 11.van Esch JH, Stols ALH, Nolte RJM. J Chem Soc, Chem Commun. 1990:1658–1660. [Google Scholar]
- 12.Sommerdijk NAJM, Booy KJ, Pistorius AMA, Feiters MC, Nolte RJM, Zwanenburg B. Langmuir. 1999;15:7008–7013. [Google Scholar]
- 13.Vasilenko I, De Kruijff B, Verkleij AJ. Biochim Biophys Acta. 1982;684:282–286. doi: 10.1016/0005-2736(82)90018-9. [DOI] [PubMed] [Google Scholar]
- 14.Vail WJ, Stollery JG. Biochim Biophys Acta. 1979;551:74–84. doi: 10.1016/0005-2736(79)90354-7. [DOI] [PubMed] [Google Scholar]
- 15.Rand RP, Sengupta S. Biochim Biophys Acta. 1971;255:484–492. doi: 10.1016/0005-2736(72)90152-6. [DOI] [PubMed] [Google Scholar]
- 16.Huang X, Cao M, Wang J, Wang Y. J Phys Chem B. 2006;110:19479–19486. doi: 10.1021/jp0630121. [DOI] [PubMed] [Google Scholar]
- 17.Ortiz A, Killian A, Verkleij AJ, Wilschut J. Biophys J. 1999;77:2003–2014. doi: 10.1016/S0006-3495(99)77041-4. [DOI] [PMC free article] [PubMed] [Google Scholar]
- 18.Owen T, Pynn R, Martinez JS, Butler A. Langmuir. 2005;21:12109–12114. doi: 10.1021/la0519352. [DOI] [PubMed] [Google Scholar]
- 19.Owen T, Pynn R, Hammouda B, Butler A. Langmuir. 2007;23:9393–9400. doi: 10.1021/la700671p. [DOI] [PubMed] [Google Scholar]
- 20.Martinez JS, Zhang GP, Holt PD, Jung HT, Carrano CJ, Haygood MG, Butler A. Science. 2000;287:1245–1247. doi: 10.1126/science.287.5456.1245. [DOI] [PubMed] [Google Scholar]
- 21.Martell AE, Sillen LG. Stability Constants of Metal Ion Complexes. Supplement 1. The Chemical Society; London: 1971. pp. 250–256. [Google Scholar]
- 22.Israelachvili JN, Mitchell DJ, Ninham BW. J Chem Soc, Faraday Trans 2. 1976;72:1525–1568. [Google Scholar]
- 23.Marczenko Z. Separation and Spectrophotometric Determination of Elements. Chapter 27 Ellis Horwood Ltd; Chichester, U.K: 1986. [Google Scholar]
- 24.Koppel DE. J Chem Phys. 1972;57:4814–4820. [Google Scholar]
- 25.Webb SM. Phys Scr. 2005;T115:1011–1014. [Google Scholar]
- 26.Ankudinov AL, Ravel B, Rehr JJ, Conradson SD. Phys Rev B. 1998;58:7565. [Google Scholar]
- 27.Zabinsky SI, Rehr JJ, Ankudinov A, Albers RC, Eller MJ. Phys Rev B. 1995;52:2995–3009. doi: 10.1103/physrevb.52.2995. [DOI] [PubMed] [Google Scholar]
- 28.The diameter and polydispersity of the Fe(III)–ME micelles are 3.5 nm and 0.29, respectively, as determined from small-angle neutron scattering (SANS) measurements.19
- 29.The diameter of the Cd(II)-induced and Zn(II)-induced vesicles varies between preparations. Although the polydispersity is low for each vesicle sample, the average vesicle diameter obtained from at least 10 sample preparations of the same composition (i.e., 1.4 mM Fe(III)–ME, 3.5 mM Zn(II), pD 6.0, 37 °C) varied from 90 to 170 nm for the Zn(II)-induced vesicles and from 80 to 282 nm for the Cd(II)-induced vesicles. The factors that affect vesicle size and nuclearity are under investigation.
- 30.Also evident in XRD profiles of the Cd(II)- and Zn(II)-induced vesicles is a second peak at Q ≈ 1.9–2.0 nm−1. The position of this second peak in reciprocal space does not correspond to the expected peak position of secondary Bragg peaks for common aggregate morphologies such as lamellar, hexagonal, or cubic phases. The origin of the second Bragg peak will be the subject of future studies.
- 31.Saret G, Manceau A, Spadini L, Roux JC, Hazemann JL, Soldo Y, Eybert-Bertrand L, Menthonnex JJ. Environ Sci Technol. 1998;32:1648–1655. [Google Scholar]
- 32.Burnett PG, Daughney CJ, Peak D. Geochim Cosmochim Acta. 2006;70:5253–5269. [Google Scholar]
- 33.Edwards DC, Myneni SCB. J Phys Chem A. 2005;109:10249–10256. doi: 10.1021/jp053349n. [DOI] [PubMed] [Google Scholar]
- 34.Abergel RJ, Warner JA, Shuh DK, Raymond KN. J Am Chem Soc. 2006;128:8920–8931. doi: 10.1021/ja062046j. [DOI] [PMC free article] [PubMed] [Google Scholar]


