

Abstract
This article presents an integrated, biologically based, source-to-dose assessment framework for modeling multimedia/multipathway/multiroute exposures to arsenic. Case studies demonstrating this framework are presented for three US counties (Hunderton County, NJ; Pima County, AZ; and Franklin County, OH), representing substantially different conditions of exposure. The approach taken utilizes the Modeling ENvironment for TOtal Risk studies (MENTOR) in an implementation that incorporates and extends the approach pioneered by Stochastic Human Exposure and Dose Simulation (SHEDS), in conjunction with a number of available databases, including NATA, NHEXAS, CSFII, and CHAD, and extends modeling techniques that have been developed in recent years. Model results indicate that, in most cases, the food intake pathway is the dominant contributor to total exposure and dose to arsenic. Model predictions are evaluated qualitatively by comparing distributions of predicted total arsenic amounts in urine with those derived using biomarker measurements from the NHEXAS — Region V study: the population distributions of urinary total arsenic levels calculated through MENTOR and from the NHEXAS measurements are in general qualitative agreement. Observed differences are due to various factors, such as interindividual variation in arsenic metabolism in humans, that are not fully accounted for in the current model implementation but can be incorporated in the future, in the open framework of MENTOR. The present study demonstrates that integrated source-to-dose modeling for arsenic can not only provide estimates of the relative contributions of multipathway exposure routes to the total exposure estimates, but can also estimate internal target tissue doses for speciated organic and inorganic arsenic, which can eventually be used to improve evaluation of health risks associated with exposures to arsenic from multiple sources, routes, and pathways.
Keywords: arsenic, modeling, exposure, exposure biology, dose, multimedia, PBPK
Introduction
With a multiplicity of health effects associated with both acute and chronic exposures, arsenic has long been recognized as a potent human toxicant (NRC, 2001; WHO et al., 2001; ATSDR, 2005). Arsenic is a transitional, reactive element that forms complexes with other metals, as well as carbon and oxygen; it exhibits three biologically important valence states: elemental As(0), arsenite As(III), and arsenate As(V). Arsine gas is the most acutely toxic; inorganic arsenic compounds are generally considered more toxic than organic ones, though many recent studies (e.g., Thomas et al., 2001, 2004) have been elucidating the critical role of the latter in the mechanisms of arsenic toxicity. Elemental arsenic is the least toxic. The inorganic arsenicals are the predominant forms found in water, while a wide range of organic species is detected in seafood and other foods.
Traditionally, efforts to regulate human As intake have focused primarily on drinking water (NRC, 2001). However, (a) chemical form and bioavailability of As in environmental and microenvironmental media, including food (USEPA, 1998), (b) routes and pathways of exposure (Xue et al., 2006; Zartarian et al., 2006), (c) presence of other contaminants (Hays et al., 2006), and (d) individual variability in metabolism, depending on genetic makeup and developmental stage (Meza et al., 2005; Suzuki, 2005; Valenzuela et al., 2005) are important in determining biologically relevant target tissue dose and health effects.
In recent years, the Stochastic Human Exposure and Dose Simulation (SHEDS) model was developed to assess aggregate human exposure to individual contaminants (Zartarian et al., 2000; Burke et al., 2001); one specific application involved the analysis of exposure to arsenic from chromated copper arsenate (CCA)-treated wood playsets and decks for children (Zartarian et al., 2006). To improve the exposure assessment approach further, the methodology first developed for the SHEDS model was modified and incorporated through new, generalized code into the Modeling ENvironment for TOtal Risk studies (MENTOR) (Georgopoulos et al., 2005, 2006b; Georgopoulos and Lioy, 2006; Georgopoulos, 2007), which is designed to analyze not only exposures to individual contaminants but to assess physiologically based target tissue dose to Multiple co-occurring contaminants and Multimedia, Multipathway, Multiroute exposures (4M) for specific individuals or for study-specific populations. MENTOR-4M, in addition to addressing the issue of simultaneous exposures to multiple contaminants for any specific individual within the population of concern, provides a new, enhanced framework of source-to-dose analyses, as it allows calculations of tissue-specific dose (and corresponding biomarker levels), employing Physiologically Based Pharmacokinetic (PBPK) modeling. This approach offers the advantage of allowing various types of comparisons with field measurements of biomarkers, which, to our knowledge, has not been done in such a systematic manner in any previous studies.
This article presents a “person-oriented, population-based” modeling framework for the analysis of exposures to arsenic present in various media employing MENTOR-4M. Case studies that result in the derivation of statistical distributions of exposure and dose are presented for three US counties (Hunterdon County, NJ; Pima County, AZ; Franklin County, OH), corresponding to substantially different conditions of exposure to arsenic. The NJ and AZ case studies focus on the relative contributions of three exposure pathways (inhalation, drinking water consumption, and food intake) to the total daily inorganic arsenic intake. Additionally, quantification of the contribution of non-dietary ingestion was performed for the OH case study.
Methods
The Modeling Framework: MENTOR-4M
A comprehensive “exposure information system” for arsenic requires linking, in a consistent manner, a variety of mechanistic models that describe processes occurring in the source-to-dose sequence, with databases relevant to releases of arsenic, its levels in environmental and biological media, activities and demographics of potentially exposed individuals and populations, and so on. MENTOR-4M provides a framework for the integrative application of predictive models of exposure and dose, in conjunction with up-to-date national, regional, and local databases of environmental, microenvironmental, biological, physiological, demographic, and other parameters. The development of MENTOR-4M took advantage of recent and ongoing developments in national databases and in modeling methods for source-to-dose assessments of multimedia toxics, and expanded the stochastic human exposure and dose assessment methodology, pioneered by the SHEDS family of models (Zartarian et al., 2000; Burke et al., 2001), to estimate relevant multimedia levels (indoor air, drinking water, soil/dust, and food concentrations) and temporal profiles of arsenic in various microenvironments. In this work, “standard” exposure modeling methodologies employed by population exposure models have been extended to include prediction of target tissue dose (and corresponding biomarker levels) by incorporating PBPK modeling as a “driver” for the exposure calculations. The fact that PBPK modeling is central to the MENTOR formulation allows for various levels of model evaluation against biomonitoring measurements from field studies.
Components of MENTOR-4M
For assessing population exposures to environmental arsenic, the MENTOR-4M “person-oriented” Population Based Exposure Modeling (PBEM) framework (summarized schematically in Figure 1 with expanded acronyms in Table 1) employs the following seven “steps” that consider inhalation, drinking water consumption, food intake, and non-dietary ingestion exposure routes:
Figure 1.
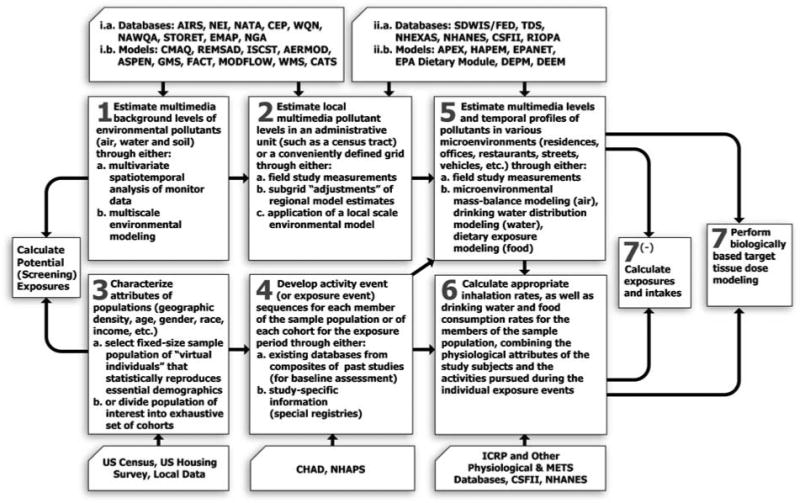
A generalized seven-step framework for assessing cumulative/aggregate exposures and doses for multiple multimedia contaminants using MENTOR-4M (note that the acronyms of databases and models mentioned in this flowchart are expanded in Table 1).
Table 1.
Acronyms used in the MENTOR flowchart of Figure.
| AERMOD | AMS/EPA Regulatory Model Improvement Committee Model |
|---|---|
| AIRS | Aerometric Information Retrieval System |
| APEX | Air Pollution Exposure Model |
| ASPEN | Assessment System for Population Exposure Nationwide |
| CATS | Contaminants in Aquatic and Terrestrial ecoSystems |
| CEP | Cumulative Exposure Project |
| CMAQ | Community Multiscale Air Quality model |
| DEEM | DEpendability Evaluation of Multiple-phased systems |
| DEPM | Dietary Exposure Potential Model |
| EMAP | Environmental Monitoring and Assessment Program |
| FACT | Flow And Contaminant Transport |
| GMS | Groundwater Modeling System |
| HAPEM | Hazardous Air Pollutants Exposure Model |
| ICRP | International Commission on Radiological Protection |
| ISCST | Industrial Source Complex Short Term Dispersion Model |
| MODFLOW | MODular three-dimensional finite-difference ground-water FLOW model |
| NAWQA | National Water Quality Assessment |
| NGA | National Geochemical Atlas |
| NHANES | National Health and Nutrition Examination Survey |
| NHAPS | National Human Activity Pattern Survey |
| REMSAD | Regional Modeling System for Aerosols and Deposition |
| RIOPA | Relationships of Indoor, Outdoor and Personal Air |
| SDWIS/FED | Safe Drinking Water Information System/Federal Version |
| STORET | Storage and Retrieval database |
| WMS | Watershed Modeling System |
| WQN | Water Quality Network |
Estimation of the multimedia background levels of arsenic (air, water, and food) for the area where the population of interest resides, through either regional model predictions or measurement studies.
Estimation of the multimedia levels of arsenic at a local scale (such as census tract or neighborhood) through either application of a local-scale environmental model or measurement studies.
Selection of a fixed-size sample population of “virtual individuals” in a way that statistically reproduces essential demographics (age, gender, race, occupation, and education) of the population unit used in the assessment (e.g., a sample of 500 virtual individuals is typically used to represent the demographics of a given census tract).
Retrieval of matching time–activity diary records from Consolidated Human Activity Database of the USEPA (CHAD; McCurdy et al., 2000; Stallings et al., 2002) for each virtual individual of the sample population, based on each individual's demographic characteristics.
-
Estimation of multimedia levels (indoor air, drinking water, and food concentrations) and temporal profiles of arsenic in various microenvironments such as residences, offices, restaurants, and so on.
Residential indoor air concentrations are calculated using microenvironmental mass balance modeling with inputs from step 2. In nonresidential microenvironments (office, school, restaurant, etc.), arsenic concentrations are determined using linear regression equations developed from analysis of concurrent indoor and outdoor arsenic measurement data available for these microenvironments (Burke et al., 2001).
Drinking water concentrations are obtained from regulatory monitoring databases (such as SDWIS/FED-USEPA, 2006a) or field study measurements (such as the National Human Exposure Assessment Survey (NHEXAS)-Thomas et al., 1999; Pellizzari and Clayton, 2006). If such data are not available, the drinking water distributions are modeled using the EPANET2 model (Rossman, 2000) with treatment plant data to obtain drinking water concentrations (see e.g., Maslia et al., 2000 for a discussion of application of drinking water distribution modeling to epidemiological studies).
Food concentrations are obtained from survey studies such as the Total Diet Study (TDS-Tao and Bolger, 1999) and NHEXAS-Pellizzari and Clayton, 2006; USEPA, 2006b).
-
Calculation of inhalation and ingestion intake (drinking water, dietary, and non-dietary) rates for the members of the sample population, reflecting/combining the physiological attributes of the study subjects and the activities pursued during the individual exposure events.
The drinking water intake rates are estimated by extracting appropriate survey records (from, e.g., the Continuing Survey of Food Intake by Individuals database (CSFII-Tippett et al., 1999)) matching the virtual individual's demographic characteristics. These rates include (1) consumption of tap water directly for drinking, (2) amount of tap water used in food and home-prepared cold beverages (e.g., lemonade mixes), and (3) hot beverages (e.g., coffee and tea). It should be noted that currently available literature studies on drinking water intake are based on short-term survey data and may have certain limitations, especially with respect to upper percentile values.
The inhalation rate is calculated based on the person's age, gender, and the metabolic equivalent of tasks (METs) value associated with the activity pursued (see e.g., Georgopoulos et al., 2005 and references therein).
Dietary arsenic intake for each virtual individual is estimated utilizing the following information: food consumption rates, composition of food item (recipe file), and arsenic residue data in food. The CSFII database of the US Dairy Association (USDA) provides information on food consumption rates for the general US population, covering 1994–1996 and 1998. The TDS database of the US Food and Drug Administration (USFDA) (Tao and Bolger, 1999; Peterson et al., 2001), covering 1991–1999, provides information on average total arsenic concentrations in 267 types of raw agricultural commodities, which are composites of food items. A recipe file developed by the USDA and the Office of Pesticide Programs (OPP) of the US Environmental Protection Agency (USEPA) is used to link the CSFII and TDS databases to generate the estimates of arsenic dietary intakes. A SAS code module was developed for the present study, utilizing the CSFII and TDS databases as well as the OPP recipe file, to estimate arsenic dietary intake.
The magnitude of non-dietary arsenic intake from incidental soil/dust ingestion is estimated using age-specific empirical intake rate distributions fitted to available tracer element mass balance study results. The geometric means (GM) and geometric standard deviations (GSD) of the estimated soil and dust ingestion rates (mg/day) were obtained from Buck et al. (2001):
Age under 13 years: GM = 40.9 (mg/day) and GSD = 3.6
-
Age 13 years and above: GM = 20.4 (mg/day) and GSD = 3.6
These estimates are then apportioned by using times spent outdoors vs. indoors into corresponding soil and dust ingestion exposures. The option of estimating contributions from hand-to-mouth pathway is also available within MENTOR-4M, based on the approach described in Zartarian et al. (2006). However, due to lack of data for characterizing model inputs, this option was not used in the present study.
Combination of each virtual individual's inhalation and ingestion intake rates with the corresponding microenvironmental concentrations of arsenic, for each activity event and location, to assess exposures (7−) and estimation of target tissue doses of arsenic and its metabolites through PBPK modeling.
Physiologically Based Pharmacokinetic Modeling for Arsenic
Physiologically Based Pharmacokinetic models typically represent the biological organism as a set of physiological compartments by lumping together similar tissues, and describing transport between compartments based on physiological processes, such as blood circulation. A “flow-limited” PBPK formulation, representing a simplification of a generalized PBPK Model for Populations (MENTOR-3P, see e.g., Georgopoulos, 2007) is used here; this simplification employs assumptions similar to those proposed in the work of Yu (1999a, b). PBPK calculations determine the dynamics of four arsenic circulating species in body compartments: arsenates (As(V)), arsenites (As(III)), and two metabolites: monomethylarsonic acid (MMA) and dimethylarsinic acid (DMA). The schematic structure of this population-oriented As PBPK model formulation and its integration with microenvironmental modules within the MENTOR-4M framework is depicted in Figure 2. Specifically, the microenvironmental modeling outputs (obtained from steps 5 and 6) are used to characterize three sets of essential input parameters (microenvironmental exposure, physiology-specific, and biochemical) in the population-oriented PBPK modeling for arsenic. Furthermore, computational tools for parameter optimization (such as MLE and Bayesian techniques) are also available for “calibrating” these parameters within the MENTOR framework.
Figure 2.
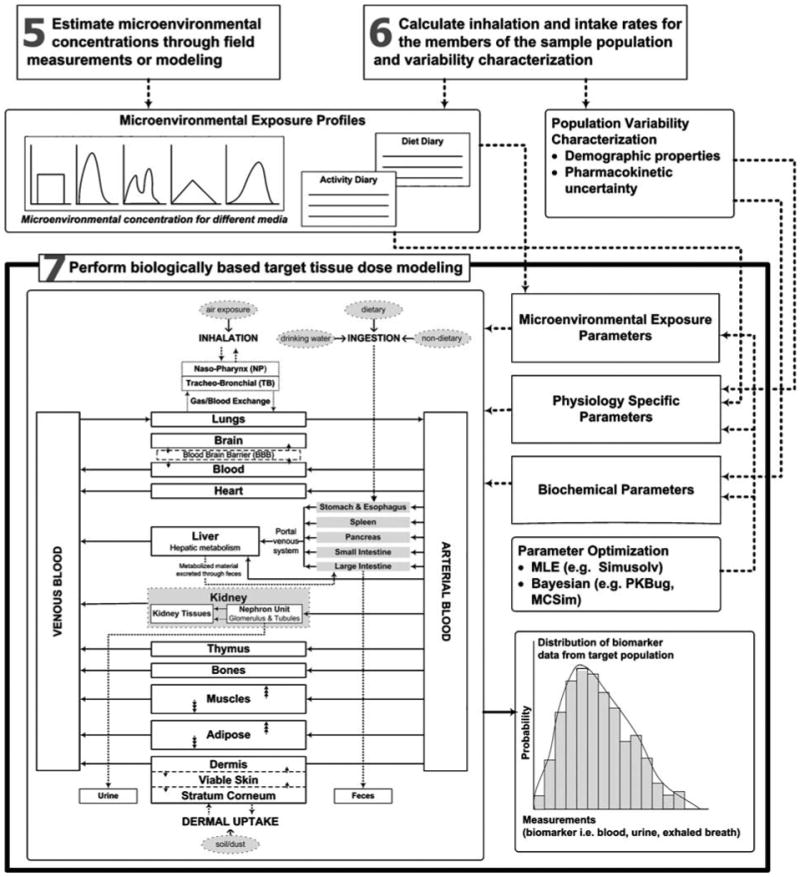
Structure of PBPK modeling of exposure to arsenic in the MENTOR-4M framework (expanding upon steps 5, 6, and 7 shown in Figure 1).
The equations presented here summarize the flow-limited pharmacokinetics of arsenic incorporated in this approach. The venous and arterial concentration of j arsenic compound is:
| (1) |
| (2) |
| (3) |
where Qi,j and Ci,j are volumetric blood flow and concentration with respect to j arsenic compound, and i compartment. Plung,j is the partition coefficient of j arsenic compound between lung compartment and blood, and qlung,j is the amount of j arsenic compound accumulated in the lung compartment.
The mass balance for j arsenic compound in compartment i of volume Vi in the PBPK model, other than the viable skin and stratum corneum compartments, is given by:
| (4) |
where Pi,j is the partition coefficient of j arsenic compound between compartment i and blood, and Rxni,j is the rate of metabolism.
Two types of metabolic reactions are included in this simplified formulation. One is dependent on the GSH concentration with first-order kinetics, where Rxni,j, in every compartment except stomach/small intestine, is given by:
| (5) |
where Ki,j and GSHi are the first-order reaction constant and GSH concentration in the i compartment.
The other one is Michaelis–Menten metabolism in the kidney and liver:
| (6) |
where Vmaxi,j and Kmi,j are Michaelis–Menten constants.
The analysis presented in this work does not include inherent interindividual metabolic variability (i.e., all variability is attributed to physiological and activity variation).
Seven tissue types are included in this simplified population-oriented PBPK model; tissue volumes are calculated as follows (following the formulation of Gallegos and Wenzel (1984)):
where W is body weight, SA is body surface area, and Lstratum corneum is stratum corneum thickness. The volume of fat depends on age and gender:
for females
k < 15 : volumefat = 0.0125 × exp ((−0.693/7.2) ×k)×W2
15 ≤ k : volumefat= 0.003732 × (1.0 + 0.0055 × (k − 14))× W2
for males
k < 18 : volumefat = 0.0125× exp((−0.693/7.2)×k)×W2
18 ≤ k : volumefat = 0.21 + 0.000307×(k − 18) ×W2/100)
where k is age in years. The blood flow (Qblood) for each tissue is calculated from:
where Vi is tissue volume and QFi is fraction of blood flow rate depending on tissue volume. The PBPK model parameters, including fractional blood flow rates (QFi), metabolism parameters (Ki,j, GSHi, Vmaxi,j, Kmij), and tissue/blood partition coefficients (p) are listed in Table 2.
Table 2.
Parameters used for the flow limited arsenic PBPK model (adapted from Yu, 1999b).
| Fractional tissue blood flow (QF) and tissue/blood partition coefficients | |||||
|---|---|---|---|---|---|
| QF (h−1) | As(III) | As(V) | MMA | DMA | |
| Large Intestine | 25.0 | 2.8 | 2.8 | 1.2 | 1.4 |
| Skin | 2.3 | 2.5 | 2.5 | 1.25 | 1.25 |
| Fat | 1.2 | 0.3 | 0.3 | 0.3 | 0.3 |
| Muscle | 2.0 | 2.6 | 2.6 | 1.8 | 2.8 |
| Kidney—VRG | 66.7 | 4.15 | 4.15 | 1.8 | 2.075 |
| Liver | 52.0 | 5.3 | 5.3 | 2.35 | 2.65 |
| Lung | 336.0 | 4.15 | 4.15 | 1.8 | 2.075 |
| Metabolism parameters | |||||
| As(V)→As(III) | As(III)→MMA | As(III)→DMA | MMA→DMA | ||
| K(μmo−1 h−1) | GSH (μmol/l) | ||||
| Large Intestine | 3.36 × 10⁻⁴ | 5.0 × 10³ | — | — | — |
| Skin | 3.36 × 10⁻⁴ | 1.0 × 10³ | — | — | — |
| Fat | 3.36 × 10⁻⁴ | 1.0 × 10³ | — | — | — |
| Muscle | 3.36 × 10⁻⁴ | 5.0 × 10³ | — | — | — |
| Kidney F VRG | 3.36 × 10⁻⁴ | 5.0 × 10³ | Vmax (μmmol/h): 20.8; | Vmax (μmmol/h): 27.8; | Vmax (μmmol/h): 13.9; |
| Km (μmmol/l): 100 | Km (μmmol/l): 100 | Km (μmmol/l): 100 | |||
| Liver | 3.36 × 10T−4 | 1.5 × 10 | Vmax (μmmol/h): 31.2; | Vmax (μmmol/h): 62.4; | Vmax (μmmol/h): 44.5; |
| Km (μmmol/l): 100 | Km (μmmol/l): 100 | Km (μmmol/l): 100 | |||
| Lung | 3.36 × 10T−4 | 5.0 × 10³ | — | — | — |
| First-order elimination rate (1 h −1) | |||||
| As(III) | As(V) | MMA | DMA | ||
| Fecal | — | 1.2 × 10⁻³ | — | — | |
| Urine | 5.0 × 10⁻² | 7.5 × 10⁻² | 4.2 | 2.4 | |
| Biliary | — | 1.8 × 10⁻² | — | — | |
There are well-known limitations associated with the flow limitation assumption as well as the parameters used in the Yu PBPK model (Yu, 1999a, b). However, the approach of Yu has been evaluated with experimental observations from the literature for urinary biomarker levels of speciated arsenic (see e.g., Pomroy et al., 1980; Buchet et al., 1981; and Johnson and Farmer, 1991). The model employed in the present study is in fact a simplified flow-limited version of an “in-progress” arsenic model, which combines both “flow-limited” and “diffusion-limited” (as per the work of Mann et al. (1996)) components and also incorporates developments presented in the work of El-Masri and Kenyon (2007). However, the use of either a fully flow-limited or diffusion-limited formulation results in very similar estimates of total urinary As, which was the “target biomarker” in the present analysis. For this reason, the simpler flow-limited approach was selected for this “proof of concept” demonstration.
Because dermal absorption of inorganic arsenic residue on the surface of objects or soil/dust is low (Wester et al., 1993), exposure to arsenic via the dermal absorption route was assumed to be insignificant in this study. However, upcoming versions of the MENTOR arsenic PBPK model are incorporating new developments in this area (Lowney et al., 2005).
Databases Used for Modeling
The following databases were linked with MENTOR-4M for modeling exposures to arsenic in the three case studies:
Databases for Arsenic in Environmental or Microenvironmental Media
NEI: National Emissions Inventory of the USEPA (USEPA, 2006a), which incorporates the former NTI — National Toxics Inventory
NATA: National Air Toxics Assessment of the USEPA (USEPA, 2006c)
AOED: Arsenic Occurrence and Exposure Database of the USEPA (USEPA, 2000)
NWIS: National Water Information System of the US Geological Survey (USGS) (USGS, 2002)
NHEXAS: National Human Exposure Assessment Survey Database of the USEPA (USEPA, 2006b)
TDS: Total Diet Study of the USFDA (Tao and Bolger, 1999)
Diaries for Dietary and Drinking Water
CSFII: Continuing Survey of Food Intakes by Individuals of the USDA (Tippett et al., 1999)
Activity Diaries
CHAD: Consolidated Human Activity Database of the USEPA (McCurdy et al., 2000; Stallings et al., 2002)
Summary descriptions of thes e and other databases that contain information on multimedia occurrence and concentrations of arsenic can be found in Georgopoulos et al. (2006a).
Results
Model Predictions
Predicted population exposures to arsenic are presented below for the three case studies of Pima County, AZ; Hunterdon County, NJ; and Franklin County, OH.
Case Study I: Pima County, AZ
Outdoor air concentration estimates for arsenic were extracted from the 1996 National Air Toxics Assessment (NATA) modeling study of the USEPA (USEPA, 2006c), which employed the 1996 NTI and the ASPEN model. Drinking water concentrations were obtained from the Arsenic Occurrence and Exposure Database (AOED). CHAD was used to provide the matching activity diaries and associated METS values to calculate inhalation rates. The drinking water consumption rates were obtained by extracting the survey records in the CSFII based on the demographic characteristics of a sample population of “virtual individuals”. There are 115 census tracts in Pima County, and 500 “virtual individuals” were sampled from each census tract for the PBEM simulation. The resulting population distribution curve of daily-accumulated dose is presented in Figure 3a; the food intake route appears to be the major pathway for total arsenic exposure.
Figure 3.
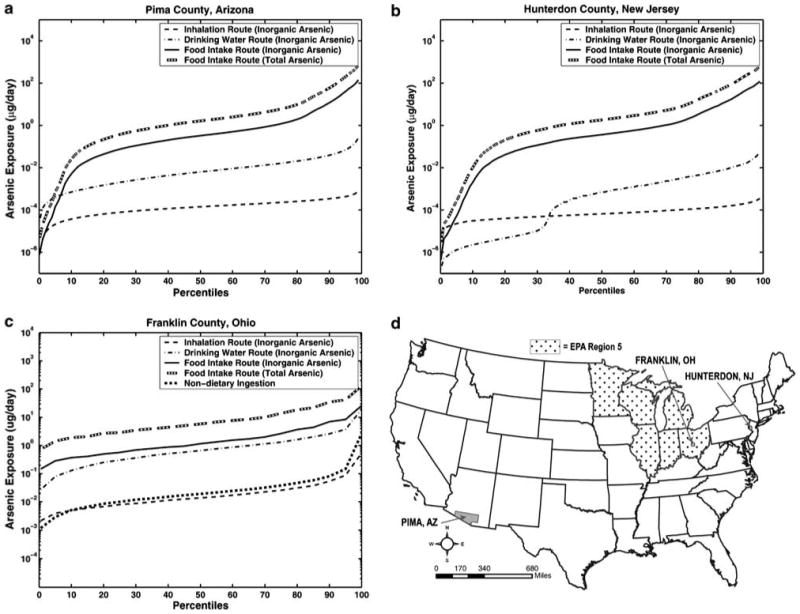
Predicted cumulative arsenic dose distributions from inhalation and ingestion routes for (a) Pima County, AZ, (b) Hunterdon County, NJ, and (c) Franklin County, OH. For the Ohio distribution, non-dietary ingestion is also shown. (d) Locations of the three counties and of the USEPA Region V (domain of the NHEXAS-V study).
Case Study II: Hunterdon County, NJ
This case study used the same data sources as above for outdoor air concentrations, activity diaries, and drinking water consumption rates, except for the drinking water concentrations, which were extracted from the US Geological Survey (USGS) National Water Information System Database. There are 22 census tracts in Hunterdon County, where again 500 virtual individuals were sampled from each census tract to perform a PBEM simulation. As shown in Figure 3b, the population distribution curves of daily-accumulated doses are quite different from the first case. The bimodal distribution of ingestion dose reflects the different drinking water quality between two source supplies in this county — the municipality system and private wells. Because 70% of the population in this county uses private wells, which have significant arsenic levels, the population distribution curve of ingestion dose from drinking water is in the higher dose mode for this population. The remaining 30% of residents use the municipality system, which does not contain elevated arsenic, and their distribution curve is in the lower dose mode. As in the first case study, the food intake route appears to be the major pathway for total arsenic exposure.
Case Study III: Franklin County, OH
This study used the NHEXAS database to extract data for multimedia concentrations of arsenic as well as drinking water and food consumption rates, while CHAD was again used to provide activity diaries and associated METS values. Since Franklin County was included in the National Human Exposure Assessment Survey — Region V (NHEXAS-V) field study, environmental and microenvironmental measurements collected in this county and in surrounding areas were used to perform the PBEM simulation. A total of 10,000 “virtual individuals” were randomly selected as the sample population to statistically reproduce the demographic characteristics of the county.
As shown in Figure 3c, the food intake and drinking water consumption routes appear to be the major pathways for the total arsenic exposure, while the non-dietary and inhalation routes act as minor contributors to the total exposure. The distribution curve for dietary intake of total arsenic is not an accurate risk indicator because of the toxicity differences between arsenic species. The population distribution curve for dietary intake of inorganic arsenic is also plotted for comparison with that of the drinking water route, since arsenic in drinking water is considered almost entirely inorganic.
Inorganic arsenic is comprised of arsenate (As(V)) and arsenite (As(III)). These inorganic species can interconvert and also be methylated into MMA and DMA in the human body. It is important to characterize the dose distributions in target tissues such as kidney and liver. The calculated arsenic exposure estimates were used as inputs to PBPK model calculations to derive population distributions of target tissue doses of inorganic and organic As species. As shown in Figure 4a and b, the tissue doses of inorganic arsenic for both kidney and liver were both higher than those of organic arsenic, while the liver shows the highest dose of inorganic arsenic. Inorganic arsenic in both kidney and liver is predominately in the form of arsenite (As(III)), while organic arsenic is mostly in the form of DMA.
Figure 4.
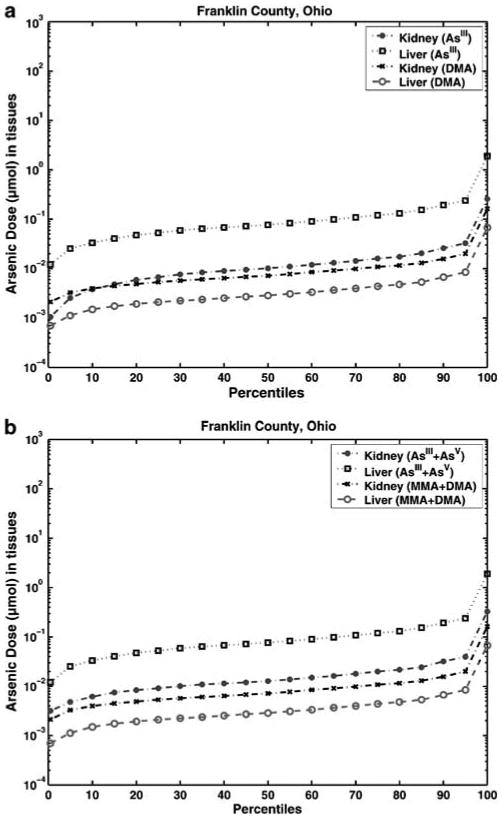
Predicted cumulative (a) inorganic (As(III)) and organic (DMA) arsenic species and (b) inorganic (As(III) + As(V)) and organic (MMA + DMA) arsenic species internal dose distributions of kidney and liver for the population of Franklin County, OH (calculated by the MENTOR-4M Population Based Model).
Model Evaluation
The MENTOR-4M applications for the three US counties were systematically evaluated by comparing modeling outputs with (a) available measurements as well as (b) alternative model predictions at various points within the source-to-dose framework. The outcomes of this model evaluation provide valuable information with respect to expected confidence in applying MENTOR-4M to other areas as well as to identifying data gaps and relevant research needs for improving this confidence. For example, the modeling results of arsenic air exposure concentrations for the three counties were compared with the corresponding 1996 NATA calculations, while the multimedia/multipathway arsenic exposure estimates for one of the case studies (Franklin County, OH) were compared with the results of a national-scale modeling study reported by Meacher et al. (2002). To evaluate the intake/uptake estimates, the calculated biomarker (total arsenic in urine samples) levels for Franklin County, OH were compared with those measured in NHEXAS-V. An independent “pattern recognition” Classification and Regression Tree (CART) (Roy et al., 2003) analysis of the NHEXAS-V study data on arsenic was also performed. The results of this analysis are presented in Figure 5 and corroborate independently the outcome of the MENTOR-based modeling analysis regarding the dominance of the food intake pathway.
Figure 5.
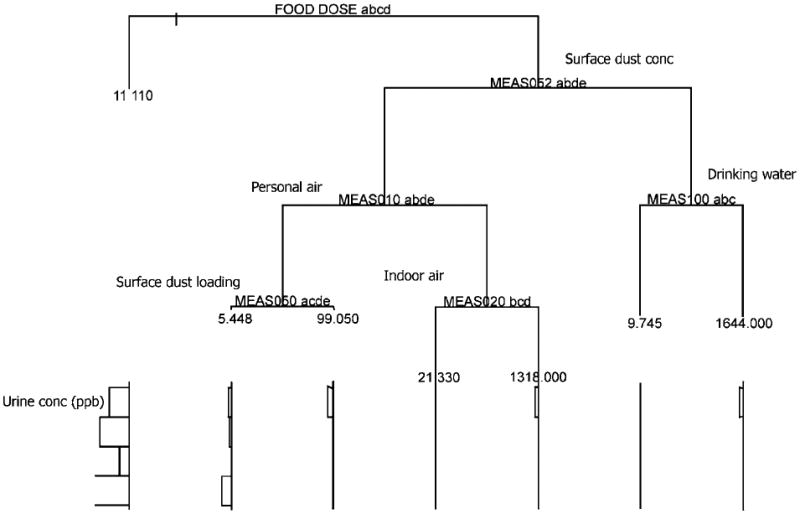
Application of the Classification and Regression Tree (CART) method for “mining” biomarker (total arsenic in urine samples) and exposure data (arsenic in food, water, air, and dust) from NHEXAS-V study. Results show that food-related dose is the dominant variable for predicting biomarker levels, corroborating the outcome of the MENTOR-based modeling analysis.
Comparison of Results with NATA
The personal inhalation exposure concentrations were calculated in each of the three studies as the time-weighted averages of airborne microenvironmental concentrations experienced by each individual, where the “time weights” are the lengths of time spent by the virtual individual in each microenvironment. Then, the estimated exposure concentrations in the above three case studies were compared with the corresponding personal concentrations calculated by the 1996 NATA study for each of the three counties considered here. The MENTOR-4M estimates of airborne arsenic personal exposure concentrations are in agreement with the corresponding 1996 NATA study results for the populations of the first two case studies (Pima County, AZ and Hunterdon County, NJ; see Figure 6a and b), reflecting mainly the fact that the same information on outdoor air concentrations of arsenic were used to estimate exposure concentrations in both studies. However, the results from the NATA study estimates are considerably lower (about a factor of 10) than the arsenic exposure concentrations predicted by MENTOR-4M in the third case study (see Figure 6c), since, in this case, actual NHEXAS measurements were used for personal exposures in Franklin County, OH, suggesting that NATA results seriously underestimate the ambient air concentrations of As in the area.
Figure 6.
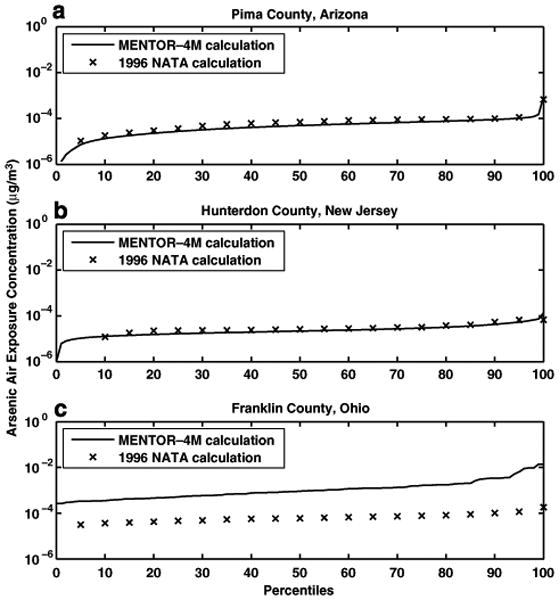
Comparison of cumulative distributions of arsenic air exposure concentrations from MENTOR-4M and 1996 NATA calculations for (a) Pima County, AZ, (b) Hunterdon County, NJ, and (c) Franklin County, OH.
Comparisons of Total Inorganic Arsenic Intake Predictions with Nationwide Estimates
The MENTOR-4M estimates of total inorganic arsenic intakes for adult men and women of Franklin County, OH were compared with the corresponding estimates of a nationwide study (Meacher et al., 2002). The cumulative distributions of intake values estimated in the two studies were compared to assess the agreement across different percentiles of the population. In general, the results for both subpopulations (adult men and adult women) are in agreement between MENTOR-4M estimates and Meacher et al. (2002) estimates, since the corresponding cumulative distributions (see Figure 7) are approximately overlapping with each other except for the high-end exposure estimates (ninety-ninth percentile and above). The ranges of inorganic arsenic intake (at the tenth and ninetieth percentiles) calculated by Meacher et al. were 1.8 to 11.4 μg/day for adult men and 1.3–9.4 μg/day for adult women. The corresponding MENTOR-4M estimates were 1.3 to 14.1 μg/day for adult men and 1.3–8.9 μg/day for adult women. At the extreme values (ninety-ninth percentile and above), the estimates of Meacher et al. are higher than the MENTOR-4M results by a factor of 2–4. Comparisons of the mean amounts of inorganic arsenic intake from the three sources (air, food, and drinking water) between the two studies are shown in Table 3. Food and drinking water are the dominant factors in inorganic arsenic intake for both subpopulations in both studies. However, MENTOR-4M estimates of mean intake amounts from food sources are somewhat greater than those of national and regional (midwest) calculations in the study of Meacher et al. for both subpopulations. On the other hand, mean intake estimates from drinking water sources calculated in Meacher et al. are greater than those calculated via MENTOR-4M. The difference in calculations of inorganic arsenic intake amounts from food pathways between the two studies may be attributed to the fact that different arsenic food residue data are used. Meacher et al. used estimates of the inorganic arsenic content of food to estimate exposures (Schoof et al., 1999). The present study used total arsenic content of food combined with data on the fraction of the inorganic portion to estimate intakes. Specifically, it was assumed that a fixed percentage of total dietary arsenic is in inorganic forms, based on the study by Yost et al. (1998). Furthermore, the present study used a more recent data source, NHEXAS-V survey (conducted in 1995–1997), to estimate dietary intakes of total inorganic arsenic than the study of Meacher et al., where the data of the CSFII 1989–1991 survey were used. Different data sources of arsenic drinking water concentrations and tap water consumption rates used in the two studies contribute to the difference in estimating inorganic arsenic intakes from drinking water pathways. The Meacher et al. study used groundwater measurements from the National Arsenic Occurrence Survey (NAOS-Frey and Edwards, 1997) as tap water arsenic concentrations. Generally, groundwater contains higher concentrations of arsenic than does surface water. By using water arsenic concentrations only from groundwater rather than also including those from surface water, the inorganic arsenic intake values in the Meacher et al. study would be expected to be overestimated. Tap water consumption rates used in the Meacher et al. study may also be biased high, since the underlying study was conducted more than 20 years ago. The present study used tap water measurements from the NHEXAS-V database as well as tap water consumption rates from more recent surveys (CSFII 1994–1996; Tippett et al., 1999) to estimate arsenic exposure from drinking water.
Figure 7.
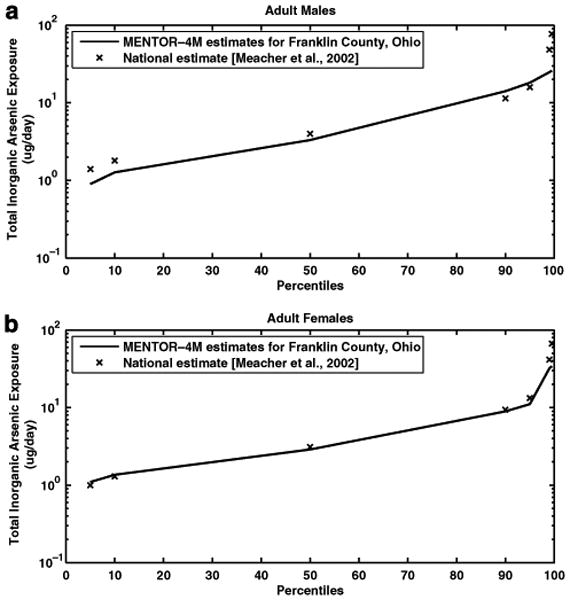
Comparison of cumulative distributions of daily total inorganic arsenic exposure estimated from MENTOR-4M in Franklin County, OH and from the study of Meacher et al. (2002) for (a) adult men and (b) adult women.
Table 3.
Comparisons of mean estimated amounts (μg per day) of inorganic arsenic intake from different pathways from the MENTOR-4M study (Franklin County, OH) and the modeling study of Meacher et al. (2002); the results presented are for the adult population (over 18 years of age).
| Pathway | Meacher study: national | Meacher study: midwest | MENTOR-4M study: Franklin Co. |
|---|---|---|---|
| Female | |||
| Air | 0.02 | 0.01 | 0.02 |
| Food | 2.75 | 2.40 | 3.38 |
| Drinking water | 2.35 | 2.06 | 1.24 |
| Soil | 0.07 | 0.08 | 0.06 |
| Total | 5.18 | 4.55 | 4.70 |
| Male | |||
| Air | 0.03 | 0.02 | 0.03 |
| Food | 3.56 | 2.99 | 4.37 |
| Drinking water | 2.66 | 2.29 | 1.41 |
| Soil | 0.07 | 0.08 | 0.04 |
| Total | 6.31 | 5.38 | 5.85 |
Comparisons of Predicted Total Arsenic Concentrations in Urine with NHEXAS-V Measurements
For the third case study (Franklin County, OH), the population distribution of total arsenic amount in urine calculated by MENTOR-4M was compared with distribution estimates derived from the measurements of the NHEXAS-V study. Since the NHEXAS measurements only provide total arsenic urine concentrations of the first void amount of the participants in the sampling day, several assumptions had to be made in this preliminary analysis to calculate total arsenic in urine:
On the basis of the results of a study by Calderon et al. (1999), the concentration of arsenic in the urine of human subjects was assumed stable throughout the sampling day.
Age- and gender-dependent urine production rates (ICRP, 2003) were used to calculate urine amounts.
Since the NHEXAS data for urine concentrations reflect continuous exposure of the population, MENTOR-4M was used to simulate a “continuous” (3-week long) exposure scenario for each virtual individual of the sample population in Franklin County, OH. (Calculations show that the total body burden of arsenic dose (inorganic + organic) reaches steady state after approximately 2 weeks of continuous exposure for a 32-year-old woman, with very similar patterns for other simulated individuals.)
On the basis of the results of the study by Yost et al. (1998), approximately 39% (for infants) and 26% (for adults) of dietary arsenic intakes were assumed to be in inorganic forms, so as to be consistent with the assumptions regarding food intake in MENTOR-4M calculations. To adjust for contribution of dietary intake of organic arsenic in the MENTOR-4M simulations, it is assumed that 65% of organic arsenic intake is excreted in urine samples according to data reported in ATSDR (2005).
According to Figure 8, the two distributions of total arsenic in urine calculated from MENTOR-4M for Franklin County and from NHEXAS measurements for the Region V study are within a factor of 5 or less, in general. Figure 8 also shows the separate cumulative distributions of total arsenic amount in urine for six age groups of the Franklin County population. The best agreement between model estimates and NHEXAS-derived data appears in age groups 3 (ages 20–34 years) and 4 (ages 35–54 years), where the agreement is within a factor of 2 and the shape of distributions is similar. For age groups 2 (ages 5–19 years) and 6 (ages 65 years and above), the agreement is generally within a factor of 3 and the shape of distributions is also similar. A substantial disagreement is shown in age group 5 (ages 55–64 years), where much higher values of NHEXAS data than model predictions appear above the ninetieth percentile and distort the shape of the distribution. By further examining the exposure measurements for the NHEXAS subjects in this age group, it was found that the two subjects with urine concentrations above the ninetieth percentile have substantially larger amounts (about two orders of magnitude) of total arsenic dietary intakes than the others. For age group 1 (ages 0–4 years), there are only two NHEXAS measurements available, resulting in the distribution taking the shape of a delta function. However, the model predictions in this age group are generally within a factor of 4 from the NHEXAS data. The observed differences for the six age groups mentioned above are partially due to considerable interindividual variation in inherent arsenic metabolism rates in humans, which is not taken into account in the simplified PBPK formulation of this study.
Figure 8.
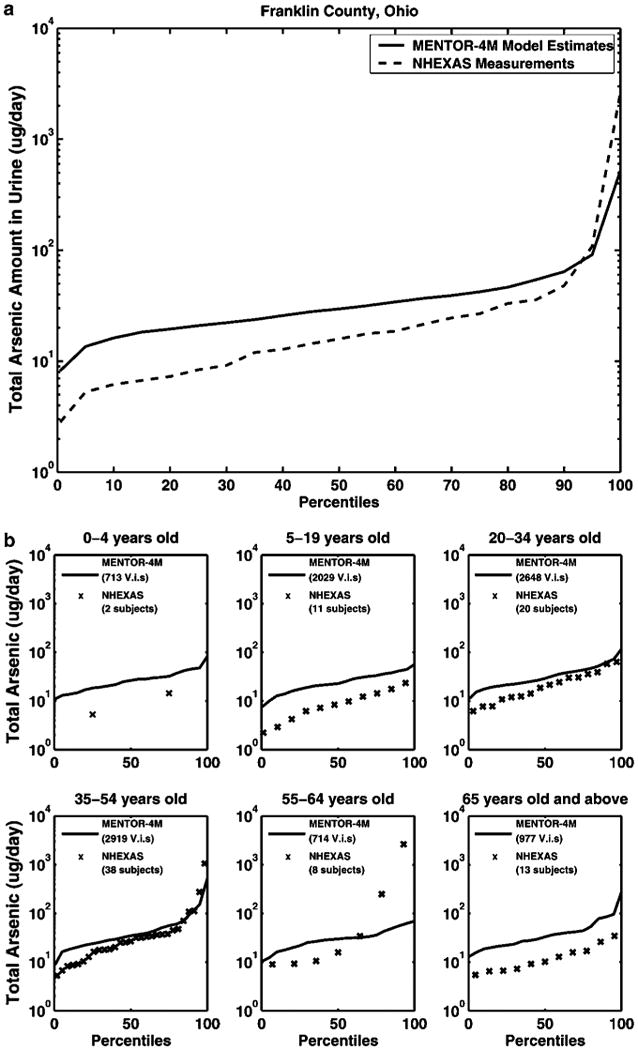
Cumulative distributions of total arsenic amount in urine from MENTOR calculations for Franklin County, Ohio and individual NHEXAS-V measurements (corresponding percentiles) for different age groups: (a) for the whole population, (b) for the 6 individual age groups (note - V.i.s. = virtual individuals).
Discussion
Assessing arsenic exposures requires evaluation of the relative contribution of (1) media (e.g., water, food, and dust), (2) pathways (e.g., drinking water, dietary, and hand-to-mouth) and (3) routes (e.g., oral, inhalation, and dermal) of exposure. For nonoccupationally exposed individuals, studies have generally indicated that uptake of arsenic via dermal exposures from soil and water and from inhalation are minor contributors to total exposure; whereas, intake from food and water account for the most significant environmental arsenic exposure (ATSDR, 2005). A major preliminary finding of the present study is the importance of dietary food intake for inorganic arsenic exposures, which is similar to the finding reported by Meacher et al. (2002); although the arsenic in food is predominantly organic, it appears that for the majority of a typical population (such as the residents of Franklin County, OH), the food ingestion pathway is the most significant contributor to inorganic arsenic intakes. Species-specific data for arsenic (inorganic vs. organic) in food are very limited. Inorganic arsenic is found in meats, poultry, dairy products, and cereals, whereas the organic forms are predominantly found in fruit, vegetables, marine fish, shellfish, and seaweed (Velez et al., 1996). Systematic, comprehensive studies have not been conducted yet to fully evaluate the forms of arsenic in typical US diet(s). Current market basket surveys, conducted by FDA, analyze only total arsenic (a, Gunderson, 1995b), as have the more comprehensive diet studies reported from other countries, (e.g., Dabeka et al., 1993; Munoz et al., 2005). Overestimation or underestimation of inorganic arsenic exposure from foods will result in uncertainties of risk estimates associated with arsenic in food.
It is important to note that, by using a source-to-dose modeling framework which is “driven” by PBPK calculations to estimate target tissue concentrations, it was possible to develop and present here a qualitative comparison of model predictions with measured biomarker levels (total arsenic levels in the urine samples of NHEXAS-V study subjects). Although given the uncertainties involved, this comparison can only be viewed as one of the steps in performing a detailed component-by-component model evaluation, it demonstrates the potential of the approach presented here. Furthermore, comparisons of the results from individual steps of the present analysis with corresponding estimates from previous modeling and field studies were conducted, including, in addition to the NHEXAS-V study, results from NATA of the USEPA (USEPA, 2006c), and from the Meacher et al. (2002) national level modeling study. The three case studies presented here therefore demonstrated the feasibility of characterizing multimedia/multipathway exposures and doses to arsenic through a consistent source-to-dose PBEM framework, using the “tools” of MENTOR-4M in conjunction with other available models and databases, such as the CHAD time–activity data and the CSFII food consumption surveys. The outcomes not only characterize the relative contributions of multipathway exposure routes to the total exposure estimates, but also have the potential to provide internal speciated organic and inorganic arsenic dose estimates for target tissues, and therefore can be used to eventually improve evaluation of health risks associated with exposures to arsenic from multiple sources and multiple routes and pathways.
Acknowledgments
The USEPA has supported this work through the Center for Exposure and Risk Modeling (CERM — EPAR827033) and the Environmental Bioinformatics and Computational Toxicology Center (ebCTC — GAD R 832721-010). Additional support has been provided by the NIEHS sponsored UMDNJ Center for Environmental Exposures and Disease (Grant #: NIEHS P30ES005022). We acknowledge contributions of Elaina Kenyon, Ted Palma, Andrew Schullman, and David Thomas (USEPA); Karen Feld (NJDEP); Eric Vowinkel (USGS); Ming Ouyang, Linda Everett, and Alan Sasso (EOHSI); and numerous EOHSI collaborators.
References
- ATSDR. Toxicological Profile for Arsenic (Draft for Public Comment) 2005 http://www.atsdr.cdc.gov/toxprofiles/tp2.html.
- Buchet JP, Lauwerys R, Roels H. Comparison of the urinary excretion of arsenic metabolites after a single oral dose of sodium arsenite, monomethylarsonate, or dimethylarsinate in man. Int Arch Occup Environ Health. 1981;48(1):71–79. doi: 10.1007/BF00405933. [DOI] [PubMed] [Google Scholar]
- Buck RJ, Ozkaynak H, Xue J, Zartarian VG, Hammerstrom K. Modeled estimates of chlorpyrifos exposure and dose for the Minnesota and Arizona NHEXAS populations. J Expo Anal Environ Epidemiol. 2001;11(3):253–268. doi: 10.1038/sj.jea.7500164. [DOI] [PubMed] [Google Scholar]
- Burke JM, Zufall MJ, Ozkaynak H. A population exposure model for particulate matter: case study results for PM2*5 in Philadelphia, PA. J Expo Anal Environ Epidemiol. 2001;11(6):470–489. doi: 10.1038/sj.jea.7500188. [DOI] [PubMed] [Google Scholar]
- Calderon RL, Hudgens E, Le XC, Schreinemachers D, Thomas DJ. Excretion of arsenic in urine as a function of exposure to arsenic in drinking water. Environ Health Perspect. 1999;107(8):663–667. doi: 10.1289/ehp.99107663. [DOI] [PMC free article] [PubMed] [Google Scholar]
- Dabeka RW, McKenzie AD, Lacroix GM, Cleroux C, Bowe S, Graham RA, Conacher HB, Verdier P. Survey of arsenic in total diet food composites and estimation of the dietary intake of arsenic by Canadian adults and children. J AOAC Int. 1993;76(1):14–25. [PubMed] [Google Scholar]
- El-Masri HA, Kenyon EM. Development of a human physiologically based pharmacokinetic (PBPK) model for inorganic arsenic and its mono- and di-methylated metabolites. J Pharmacokinet Pharmacodyn. 2007 doi: 10.1007/s10928-007-9075-z. Advance Online Publication. [DOI] [PubMed] [Google Scholar]
- Frey MM, Edwards MA. Surveying arsenic occurrence in US drinking water. J Am Water Works Assoc. 1997;89(3):105–117. [Google Scholar]
- Gallegos AF, Wenzel WJ. HUMTRN: documentation and verification for an ICRP-based age- and sex-specific human simulation model for radionuclide dose assessment. Los Alamos National Laboratory; Los Alamos, NM: 1984. [Google Scholar]
- Georgopoulos P. A multiscale approach for assessing the interactions of environmental and biological systems in a holistic health risk assessment framework. Water Air Soil Pollut Focus. 2007 doi: 10.1007/s11267-007-9137-7. Advance online publication. [DOI] [Google Scholar]
- Georgopoulos PG, Bandi S, Efstathiou C, Li W, Shade P, Tan H, Tanwar S, Tong S, Vyas VM, Wang SW, Yang YC. Infrastructure for an Arsenic Exposure Information System, CERM: 2006:01, Prepared by Computational Chemodynamics Laboratory for USEPA. 2006a http://ccl.rutgers.edu/reports/cerm/Georgopoulos-etal_CERM2006-report_ArsenicEXIS.pdf.
- Georgopoulos PG, Lioy PJ. From theoretical aspects of human exposure and dose assessment to computational model implementation: the MOdeling ENvironment for TOtal Risk studies (MENTOR) J Toxicol Environ Health B Crit Rev. 2006;9(6):457–483. doi: 10.1080/10937400600755929. [DOI] [PubMed] [Google Scholar]
- Georgopoulos PG, Wang SW, Georgopoulos IG, Yononne-Lioy MJ, Lioy PJ. Assessment of human exposure to copper: a case study using the NHEXAS database. J Expo Sci Environ Epidemiol. 2006b;16:397–409. doi: 10.1038/sj.jea.7500462. [DOI] [PubMed] [Google Scholar]
- Georgopoulos PG, Wang SW, Vyas VM, Sun Q, Burke J, Vedantham R, McCurdy T, Ozkaynak H. A source-to-dose assessment of population exposures to fine PM and ozone in Philadelphia, PA, during a summer 1999 episode. J Expo Anal Environ Epidemiol. 2005;15(5):439–457. doi: 10.1038/sj.jea.7500422. [DOI] [PubMed] [Google Scholar]
- Gunderson EL. Dietary intakes of pesticides, selected elements, and other chemicals: FDA Total Diet Study, June 1984–April 1986. J AOAC Int. 1995a;78(4):910–921. [PubMed] [Google Scholar]
- Gunderson EL. FDA Total Diet Study, July 1986–April 1991, dietary intakes of pesticides, selected elements, and other chemicals. J AOAC Int. 1995b;78(6):1353–1363. [PubMed] [Google Scholar]
- Hays AM, Srinivasan D, Witten ML, Carter DE, Lantz RC. Arsenic and cigarette smoke synergistically increase DNA oxidation in the lung. Toxicol Pathol. 2006;34(4):396–404. doi: 10.1080/01926230600824926. [DOI] [PubMed] [Google Scholar]
- ICRP. ICRP Publication 89: Basic Anatomical and Physiological Data for Use in Radiological Protection: Reference Values. Elsevier Publishing Company; New York: 2003. [Google Scholar]
- Johnson LR, Farmer JG. Use of human metabolic studies and urinary arsenic speciation in assessing arsenic exposure. Bull Environ Contam Toxicol. 1991;46(1):53–61. doi: 10.1007/BF01688254. [DOI] [PubMed] [Google Scholar]
- Lowney YW, Ruby MV, Wester RC, Schoof RA, Holm SE, Hui XY, Barbadillo S, Maibach HI. Percutaneous absorption of arsenic from environmental media. Toxicol Ind Health. 2005;21(1–2):1–14. doi: 10.1191/0748233705th205oa. [DOI] [PubMed] [Google Scholar]
- Mann S, Droz PO, Vahter M. A physiologically based pharmacokinetic model for arsenic exposure II: Validation and application in humans. Toxicol Appl Pharmacol. 1996;140:471–486. doi: 10.1006/taap.1996.0244. [DOI] [PubMed] [Google Scholar]
- Maslia ML, Sautner JB, Aral MM, Reyes JJ, Abraham JE, Williams RC. Using water-distribution system modeling to assist epidemiologic investigations. J Water Resour Plann Manag. 2000;126(4):180–198. [Google Scholar]
- McCurdy T, Glen G, Smith L, Lakkadi Y. The national exposure research laboratory's consolidated human activity database. J Expo Anal Environ Epidemiol. 2000;10(6 Part 1):566–578. doi: 10.1038/sj.jea.7500114. [DOI] [PubMed] [Google Scholar]
- Meacher DM, Menzel DB, Dillencourt MD, Bic LF, Schoof RA, Yost LJ, Eickhoff JC, Farr CH. Estimation of multimedia inorganic arsenic intake in the U.S. population. Hum Ecol Risk Assess. 2002;8(7):1697–1721. [Google Scholar]
- Meza MM, Yu L, Rodriguez YY, Guild M, Thompson D, Gandolfi AJ, Klimecki WT. Developmentally restricted genetic determinants of human arsenic metabolism: association between urinary methylated arsenic and CYT19 polymorphisms in children. Environ Health Perspect. 2005;113(6):775–781. doi: 10.1289/ehp.7780. [DOI] [PMC free article] [PubMed] [Google Scholar]
- Munoz O, Bastias JM, Araya M, Morales A, Orellana C, Rebolledo R, Velez D. Estimation of the dietary intake of cadmium, lead, mercury, and arsenic by the population of Santiago (Chile) using a Total Diet Study. Food Chem Toxicol. 2005;43(11):1647–1655. doi: 10.1016/j.fct.2005.05.006. [DOI] [PubMed] [Google Scholar]
- NRC. Arsenic in Drinking Water: 2001 Update. National Academy Press; Washington, DC: 2001. p. 244. [Google Scholar]
- Pellizzari ED, Clayton CA. Assessing the measurement precision of various arsenic forms and arsenic exposure in the National Human Exposure Assessment Survey (NHEXAS) Environ Health Perspect. 2006;114(2):220–227. doi: 10.1289/ehp.8104. [DOI] [PMC free article] [PubMed] [Google Scholar]
- Peterson B, Berry M, Elkins A. Assessment of ingestion exposures in the residential environment. In: Baker S, Driver J, McCallum DB, editors. Residential Exposure Assessment, A Sourcebook. Kluwer Academic/Plenum; New York: 2001. pp. 131–160. [Google Scholar]
- Pomroy C, Charbonneau SM, McCullough RS, Tam GK. Human retention studies with 74As. Toxicol Appl Pharmacol. 1980;53(3):550–556. doi: 10.1016/0041-008x(80)90368-3. [DOI] [PubMed] [Google Scholar]
- Rossman LA. EPANET 2 Users Manual. EPA/600/R-00/057. U.S. Environmental Protection Agency; Cincinnati, OH: 2000. [Google Scholar]
- Roy A, Ouyang M, Freeman N, Georgopoulos PG, Lioy PJ. Environmental, dietary, demographic, and activity variables associated with biomarkers of exposure for benzene and lead. J Expo Anal Environ Epidemiol. 2003;13(6):417–426. doi: 10.1038/sj.jea.7500296. [DOI] [PubMed] [Google Scholar]
- Schoof RA, Yost LJ, Eickhoff J, Crecelius EA, Cragin DW, Meacher DM, Menzel DB. A market basket survey of inorganic arsenic in food. Food Chem Toxicol. 1999;37(8):839–846. doi: 10.1016/s0278-6915(99)00073-3. [DOI] [PubMed] [Google Scholar]
- Stallings C, Tippett JA, Glen G, Smith L. CHAD User's Guide — Extracting Human Activity Information from CHAD on the PC, Written for USEPA National Exposure Research Laboratory by ManTech Environmental Technologies. 2002 http://www.epa.gov/chadnet1/reports/CHAD_Manual.pdf.
- Suzuki KT. Metabolomics of arsenic based on speciation studies. Anal Chim Acta. 2005;540(1):71–76. [Google Scholar]
- Tao SSH, Bolger PM. Dietary arsenic intakes in the United States: FDA Total Diet Study, September 1991–December 1996. Food Addit Contam. 1999;16(11):465–472. doi: 10.1080/026520399283759. [DOI] [PubMed] [Google Scholar]
- Thomas DJ, Styblo M, Lin S. The cellular metabolism and systemic toxicity of arsenic. Toxicol Appl Pharmacol. 2001;176(2):127–144. doi: 10.1006/taap.2001.9258. [DOI] [PubMed] [Google Scholar]
- Thomas DJ, Waters SB, Styblo M. Elucidating the pathway for arsenic methylation. Toxicol Appl Pharmacol. 2004;198(3):319–326. doi: 10.1016/j.taap.2003.10.020. [DOI] [PubMed] [Google Scholar]
- Thomas KW, Pellizzari ED, Berry MR. Population-based dietary intakes and tap water concentrations for selected elements in the EPA region V National Human Exposure Assessment Survey (NHEXAS) J Expo Anal Environ Epidemiol. 1999;9(5):402–413. doi: 10.1038/sj.jea.7500051. [DOI] [PubMed] [Google Scholar]
- Tippett KS, Enns CW, Moshfegh AJ. Food consumption surveys in the US Department of Agriculture. Nutr Today. 1999;34(1):33–46. [Google Scholar]
- USEPA. Research plan for arsenic in drinking water. EPA/600/R-98/042. U.S. Environmental Protection Agency; Cincinnati, OH: 1998. [Google Scholar]
- USEPA. Arsenic occurrence in public drinking water supplies. EPA-815-R-00-02. U.S. Environmental Protection Agency; Washington, DC: 2000. http://www.epa.gov/OGWDW/arsenic/pdfs/occurrence.pdf. [Google Scholar]
- USEPA. About the National Emission Inventory Database. 2006a http://www.epa.gov/air/data/neidb.html.
- USEPA. NHEXAS — National Human Exposure Assessment Survey. 2006b http://www.epa.gov/nerl/research/nhexas/nhexas.htm.
- USEPA. Technology Transfer Network — National Air Toxics Assessment. 2006c http://www.epa.gov/ttn/atw/nata/natsaov.html.
- USGS. NWISWeb Data for the Nation. 2002 http://waterdata.usgs.gov/nwis.
- Valenzuela OL, Borja-Aburto VH, Garcia-Vargas GG, Cruz-Gonzalez MB, Garcia-Montalvo EA, Calderon-Aranda ES, Del Razo LM. Urinary trivalent methylated arsenic species in a population chronically exposed to inorganic arsenic. Environ Health Perspect. 2005;113(3):250–254. doi: 10.1289/ehp.7519. [DOI] [PMC free article] [PubMed] [Google Scholar]
- Velez D, Ybanez N, Montoro R. Monomethylarsonic and dimethylarsinic acid contents in seafood products. J Agric Food Chem. 1996;44:859–864. [Google Scholar]
- Wester RC, Maibach HI, Sedik L, Melendres J, Wade M. In vivo and in vitro percutaneous absorption and skin decontamination of arsenic from water and soil. Fundam Appl Toxicol. 1993;20(3):336–340. doi: 10.1006/faat.1993.1043. [DOI] [PubMed] [Google Scholar]
- WHO. Gomez-Caminero A, Howe P, Hughes M, Kenyon E, Lewis DR, Moore M, Ng J. Arsenic and Arsenic Compounds (updated November 2004), Environmental Health Criteria 224, World Health Organization. 2001 http://www.who.int/ipcs/publications/ehc/ehc_224/en/
- Xue J, Zartarian VG, Ozkaynak H, Dang W, Glen G, Smith L, Stallings C. A probabilistic arsenic exposure assessment for children who contact chromated copper arsenate (CCA)-treated playsets and decks, Part 2: sensitivity and uncertainty analyses. Risk Anal. 2006;26(2):533–541. doi: 10.1111/j.1539-6924.2006.00748.x. [DOI] [PubMed] [Google Scholar]
- Yost LJ, Schoof RA, Aucoin R. Intake of inorganic arsenic in the North American diet. Hum Ecol Risk Assess. 1998;4(1):137–152. [Google Scholar]
- Yu DH. A pharmacokinetic modeling of inorganic arsenic: a short-term oral exposure model for humans. Chemosphere. 1999a;39(15):2737–2747. doi: 10.1016/s0045-6535(99)00207-6. [DOI] [PubMed] [Google Scholar]
- Yu DH. A physiologically based pharmacokinetic model of inorganic arsenic. Regul Toxicol Pharmacol. 1999b;29(2):128–141. doi: 10.1006/rtph.1999.1282. [DOI] [PubMed] [Google Scholar]
- Zartarian VG, Ozkaynak H, Burke JM, Zufall MJ, Rigas ML, Furtaw EJ. A modeling framework for estimating children's residential exposure and dose to chlorpyrifos via dermal residue contact and nondietary ingestion. Environ Health Perspect. 2000;108(6):505–514. doi: 10.1289/ehp.00108505. [DOI] [PMC free article] [PubMed] [Google Scholar]
- Zartarian VG, Xue J, Ozkaynak H, Dang W, Glen G, Smith L, Stallings C. A probabilistic arsenic exposure assessment for children who contact CCA-treated playsets and decks, part 1: model methodology, variability results, and model evaluation. Risk Anal. 2006;26(2):515–531. doi: 10.1111/j.1539-6924.2006.00747.x. [DOI] [PubMed] [Google Scholar]