

Abstract
The feasibility of using ultrasound-based elastic modulus imaging to visualize thermal ablation zones in an in vivo porcine model is reported in this article. Elastic modulus images of soft tissues are estimated as an inverse optimization problem. Ultrasonically-measured displacement data are utilized as inputs to determine an elastic modulus distribution that provides the best match to this displacement field.
A total of 14 in vivo thermal ablation zones were investigated in this study. To determine the accuracy of delineation of each thermal ablation zone using elastic modulus imaging, the dimensions (lengths of long and short axes) and the are of each thermal ablation zone obtained from an elastic modulus image was compared to the corresponding gross pathology photograph of the same ablation zone. Comparison of elastic modulus imaging measurements and gross pathology measurements showed high correlation with respect to the area of thermal ablation zones (Pearson coefficient = 0.950 and p<0.0001). The radiological-pathological correlation was slightly lower (correlation = 0.853, p<0.0001) for strain imaging among these 14 in vivo ablation zones. We also found that, on average, elastic modulus imaging can more accurately depict thermal ablation zones, when compared to strain imaging (14.7% versus 22.3% absolute percent error in area measurements, respectively). Furthermore, elastic modulus imaging also provide higher (more than a factor of two) contrast-to-noise ratios for evaluating these thermal ablation zones than those on corresponding strain images, thereby reducing inter-observer variability. Our preliminary results suggest that elastic modulus imaging might potentially enhance the ability to visualize thermal ablation zones, thereby improving assessment of ablative therapies.
Keywords: elasticity imaging, modulus reconstruction, inverse problems, elastography, optimization, elastic modulus imaging, ablation
1. Introduction
Image-guided radiofrequency (RF) and microwave (MW) ablation are increasingly used to treat primary and some metastatic tumors in the liver (Sato et al., 1996; Lencioni et al., 2005; Lu et al., 2005; Liang et al., 2005). In recent reports, excellent outcomes of treating renal tumors using RF and MW ablation techniques were also achieved by several groups (Gervais et al., 2000; Gervais et al., 2005; Zagoria et al., 2007; Laeseke et al., 2007). The clinical potential of these techniques for treatment of neoplasms at other sites, including breast (Jeffrey et al., 1999), bone (Rosenthal et al., 1998; Callstrom et al., 2006), and lung (Nguyen et al., 2005; Wolf et al., 2008; White and D'Amico, 2008), has also been reported. While thermal ablation can be an effective cancer treatment tool, the lack of a reliable imaging modality to monitor progression of ablation treatment is still a significant problem. (Gazelle et al., 2000; Solbiati et al., 1997; Goldberg et al., 2000; Montgomery et al., 2004). To eradicate the entire tumor mass, thermal ablation must ensure delivery of a lethal thermal dose to the whole tumor and an ablative margin, while minimizing heat damage to vulnerable areas (e.g. bowel, stomach, gall bladder, bile ducts, and the renal cortex). Unfortunately, because of a lack of adequate imaging-based treatment monitoring options, undertreated portions of the tumor often go undetected until follow-up. Accordingly, a rapid feedback imaging technique would be useful for the real-time or near real-time evaluation of the ablation zone to help reduce the number of local recurrences and subsequent re-treatment sessions after thermal tumor ablation.
In many centers, the insertion of the RF/MW applicator is usually done under ultrasound guidance, since it offers a fast and effective real-time method of guidance. Unfortunately, attempts to monitor ablation with conventional B-mode ultrasound have been largely unsuccessful. Hyperechoic areas caused by micro-bubbles and gas formed during tissue heating have been used as a surrogate for the ablation zone but do not correlate well with the actual ablation zone (Bush et al., 1993). In addition, these hyperechoic areas gradually disappear within 30 minutes after ablation, making post-treatment evaluation difficult. Contrast-enhanced ultrasound (CEUS) has been shown to be of benefit (Solbiati et al., 2004) but is not approved for use in all countries. CEUS is also plagued by a relatively short cycle time in the livers and kidneys. In addition, to monitor an ablation procedure, micro-bubble contrast-agents must thereafter be continuously injected throughout the treatment.
X-ray Computed Tomography (CT) can predict the coagulation zone with a precision of 2-3 mm (Goldberg et al., 2000). However, the use of CT or contrast-enhanced CT (Dupuy and Goldberg, 2001) is limited by the amount of contrast agent that can be injected (due to possible renal failure) and concerns regarding the radiation dose to both the patient and the physician. Magnetic Resonance Imaging (MRI) can be utilized for imaging the ablation zone in several ways (Goldberg et al., 1998; Weidensteiner et al., 2003; Stern et al., 2008; Pilatou et al., 2009; Hyodoh et al., 1998). However, there is limited availability of FDA-approved MRI-compatible applicators and a shortage of interventional MRI scanners (Carter et al., 1998; Wacker et al., 2004).
During RF ablation, protein denaturation during heating results in an increase in the elastic modulus of tissue (Kiss et al., 2004). Therefore, thermal ablation zones appear to be stiffer than surrounding untreated tissue and may be differentiated by new elasticity imaging methods that directly estimate mechanical properties of soft tissue (Gao et al., 1996; Greenleaf et al., 2003; Ophir et al., 1999; Hall, 2003). Several methods, including strain imaging (Varghese et al., 2002; Kallel et al., 1999), sonoelastography (Zhang et al., 2008) and acoustic radiation force imaging (Fahey et al., 2006), have demonstrated good correspondence between elasticity imaging findings and gross pathology features.
Our group, among others, has been developing quasi-static elasticity imaging methods that employ unmodified clinical equipment and examination techniques similar to standard clinical ultrasound examinations. With these methods, an ultrasound transducer is used to acquire phase-sensitive ultrasound echo data (either radiofrequency (RF) or quadrature data). Ultrasound echo signals are tracked as the anatomy is deformed to obtain local tissue displacement information. The displacement field is then used to calculate the component of strain along the direction of the acoustic beam (hereafter referred as to strain) to form a 2D/3D strain image. This strain image is interpreted as an image of the reciprocal of the shear or Young's modulus for the tissue (Ophir et al., 1991). Unlike strain, the Young's or shear modulus is an intrinsic material property of the tissue being studied, thereby providing unambiguous information regarding tissue elasticity (Barbone and Bamber, 2002). Considerable research efforts have been directed to use the same displacement field to solve an inverse elasticity problem to explicitly determine the spatial distribution of the elastic modulus of interest. While a few techniques (Kallel and Bertrand, 1996; Zhu et al., 2003; Doyley et al., 2000; Oberai et al., 2004) have been proposed, only few applications to date (Oberai et al., 2009) have been applied to in vivo soft tissue. In this study, we will apply our relative elastic modulus imaging (EMI) technique specifically designed for using ablation applicator-induced deformation (Jiang et al., 2009) in an in vivo porcine liver model.
Our objective is to evaluate the radiological-pathological correlation and accuracy of this technique in pre-clinical animal studies. In this article, we compare the dimension and area measurements of in vivo thermal ablation zones obtained using strain imaging and relative EMI against the dimension and area measurements using corresponding gross-pathology photographs of the same thermal ablation zones. Furthermore, both a contrast-noise ratio metric (Song et al., 2004) and inter-observer variability among three human observers of elastic modulus and strain images are assessed to demonstrate that the EMI could become a potentially enhanced modality for visualizing thermal ablation zones.
2. Materials and Methods
A brief description of the proposed EMI method including data acquisition and analysis is given in this section. Figure 1 shows a flowchart describing, in general, the proposed EMI method used for data acquisition and processing.
Figure 1.
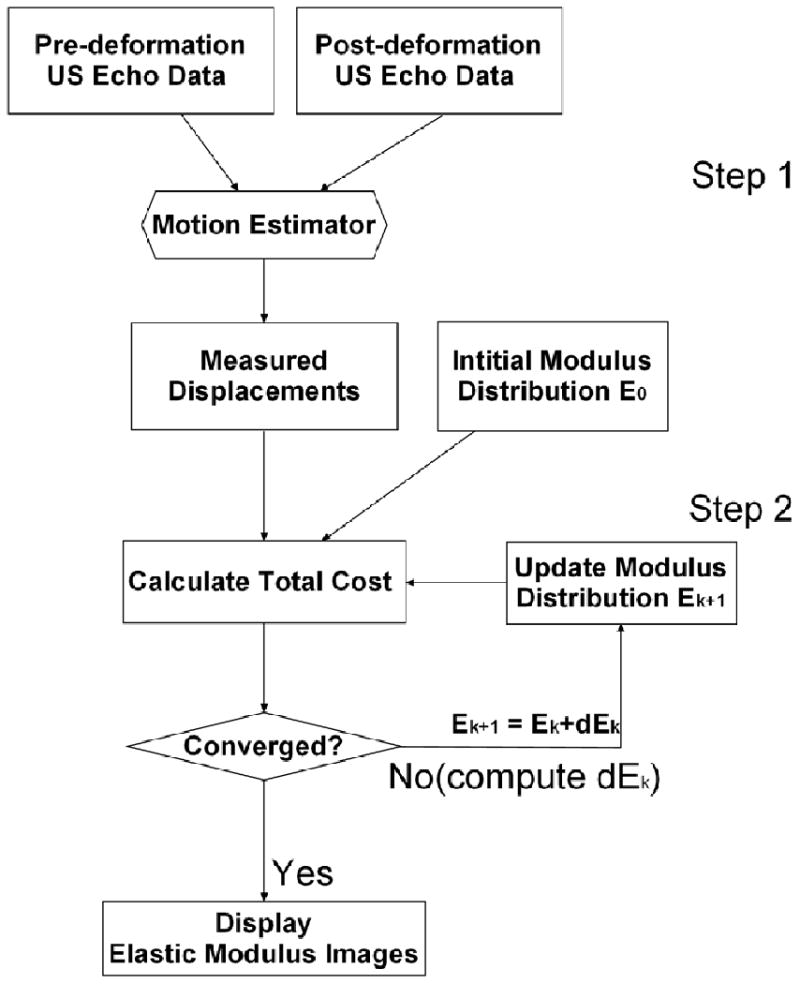
A flowchart describing the EMI procedure.
2.1 Animal Preparation and Experiments
Following an institutionally-approved animal protocol, a total of 15 ablation zones were created in vivo in 5 porcine animals with normal livers (radiofrequency n=14 and microwave n=1). During open-abdomen ablation experiments, general anesthesia was first induced with an intramuscular injection of teletamine and zolazepam (Telazol; Fort Dodge Laboratories, Fort Dodge, IA) and xylazine (Rompun; Bayer Corporation, Shawnee Mission, KS) and was maintained with inhaled isoflurane 1% to 3%. Subsequently, laparotomy was performed for each animal to expose the liver for open abdominal ablation. Fourteen radiofrequency ablation procedures were performed using a 17-guage cooled needle electrode (Valleylab Inc., CO, USA) with a 30-mm electrically-active tip, while the only microwave ablation experiment was performed using a 17-gauge triaxial antenna prototype (Brace et al., 2007). Ablation experiments were performed for 4-12 minutes to create various sized thermal ablation zones (1-3 cm diameter).
Immediately following each ablation procedure, the hand-held ultrasound transducer was positioned adjacent to the ablation applicator, and a radiologist (AA) first scanned the entire thermal ablation zone. After identification of an appropriate imaging plane by the radiologist for each ablation zone, ultrasound echo data were collected under the guidance of a real-time strain imaging system (eSie Touch, Siemens Antares, Siemens Healthcare Inc, Ultrasound Division). During ultrasound data acquisition, an RF or MW applicator was used to perturb liver tissues to create the deformations needed for strain imaging and EMI as shown in Fig. 2. (Varghese et al., 2002). Of note, small (<0.5 mm from [ultrasound] frame-to-frame) deformation of the tissue was achieved by pulling or pushing the ablation electrode enabling a deformation force to be transmitted to the tissue being imaged through the adherence of ablated soft tissue to the metal electrode (Mikami et al., 2004). All ultrasound data were acquired using a linear array ultrasound transducer (VFX 9-4; Siemens Healthcare [USA] Inc.) pulsed at 6 MHz in conjunction with the Axius Direct™ Ultrasound Research Interface (URI) package (Brunke et al., 2007). The lateral beam spacing and axial sample size for the ultrasound data acquired were approximately 0.15-mm and 0.02-mm, respectively.
Figure 2.
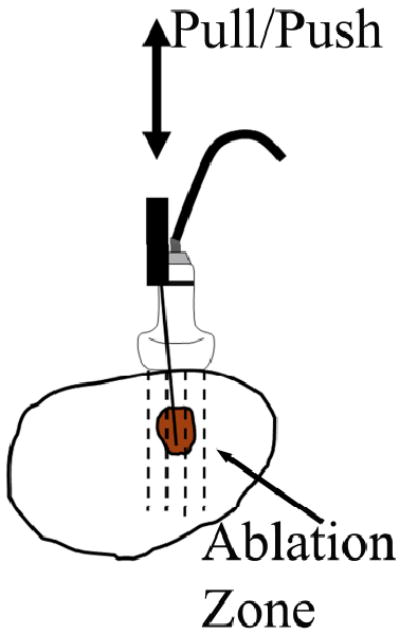
A schematic diagram illustrating the experimental setup for ultrasound data acquisition using RF electrode deformation. The arrow points to the thermal ablation zone (the shadowed area). Ultrasound echo data are acquired from the area covered by the dashed lines using a linear array ultrasound transducer.
After each animal was euthanized, the entire liver was removed and was serially sectioned at approximately 3 mm intervals to expose the ultrasound imaging plane for gross pathology analysis. Section planes of each ablation zone were nearly parallel to the corresponding insertion track of the ablation applicator and were determined under the guidance of surface markers representing the corresponding imaging plane.
2.2 Formation of Strain and Elastic Modulus Images
As illustrated in Fig. 1, in the first step, a previously published speckle tracking method (Jiang and Hall, 2009) was used to obtain the ultrasonically measured displacement field. These displacement measurements were then used as inputs for the inverse reconstruction of the modulus distribution in the second step. This speckle tracking algorithm is a constrained block matching algorithm (BMA) that tracks ultrasonic speckle patterns by searching for a kernel of echo data from the pre-compression echo data in a 2-D search region of the post-compression echo field to minimize the following cost function:
| (1) |
where the first item EC is a penalty term for speckle de-correlation, the second term Φ(ES) is a penalty term due to the loss of motion continuity from a cluster of displacement vectors, and α is a positive regularization parameter. We set α to 1 for all data investigated in this article.
Using axial (parallel to the acoustic beam direction) displacements obtained from the above-described speckle tracking algorithm, a 2D finite element-based iterative modulus reconstruction algorithm developed in our previous work (Jiang et al., 2009) was used to obtain modulus distributions in and around all 14 thermal ablation zones. The basic idea of EMI is to iteratively adjust local modulus values to enforce a biomechanical model to produce displacements close to those obtained from ultrasonic speckle tracking. We formulate the EMI as a constrained minimization problem and assume the tissue being imaged is linearly elastic as a first approximation for small deformations (approximately 1.0% frame-to-frame average strain),
| (2) |
| (3) |
| (4) |
where T(Ê) is the predicted axial displacement by a forward finite element simulation based on the current estimated modulus distribution Ê and Û is the estimated axial displacement using the ultrasound-based speckle tracking algorithm described above. In Eqn. (3), ▽ is a gradient operator, is the Euclidean norm, and γ is a small positive constant.
To stabilize the solution of Eqn. (2), regularization (Vogel, 2002) is often used, and the resulting solution is a tradeoff between fidelity to the measured displacement data (the first item on the right hand side of Eqn. (2)) and bias due to the regularity of the solution constrained through the regularization function (the second item on the right hand side of Eqn(2)). In other words, regularization injects a priori knowledge to balance this tradeoff for a given situation. In this sense, β is a positive parameter controlling the trade-off between the fidelity and variability in Ê. In our experience, ablated tissues typically have a sharp transition in tissue stiffness between the normal and the ablated regions, whereas the tissue stiffness within both the normal and ablated regions gradually varies. Therefore, an edge-preserving regularization function V(Ê) is selected to enforce such a priori knowledge in the hope of accurately capturing boundaries of a thermal zone in the reconstructed modulus map. In this study, β (Eqn. (2)) and γ (Eqn. (3)) were set to 5e-7 and 0.1, respectively, for all data investigated. Detailed formulations to solve Eqns. (2-4) can be found in our previous work (Jiang et al., 2009).
2.3 Implementation of EMI Algorithm
To obtain a relative elastic modulus image, the basic procedures involved are summarized as follows:
Estimate displacement Û from a region of interest (ROI; see the white box in Fig. 3a) defined by an user.
Identify the location of the ablation electrode in both axial displacement and B-mode images. In axial displacement image, pulling/pushing of the ablation electrode results in a rigid-body motion, that is, relatively constant displacements within a small region (see the arrow in Fig. 3c). In the B-mode image, a metal electrode typically results in reflection (see the arrow in Fig. 3a) or shadowing behind it. The locations of the ablation electrode on displacement and B-mode images should be spatially consistent.
Assume an initial uniform Young's modulus distribution Ê. The displacements within the identified electrode region and the displacements at the edges of the ROI will be enforced as boundary conditions to solve the 2D FEA forward solution (i.e. T(Ê) in Eqn. 2).
Compare these predicted displacements T(Ê) with the ultrasonically measured displacements Û. Simultaneously, the assumed modulus distribution Ê is updated. Iterations between (3) and (4) continue until one or all convergence criteria are satisfied. Usually, the criteria for convergence can be set with pre-determined thresholds ε1 and ε2 such that, delta(Ê) < ε1 and/or J(Ê) < ε2. delta(Ê) above denotes the difference in the modulus distributions between two consecutive iterations. Convergence was typically reached within 30 iterations when we set both ε1 and ε2 to 10-6 in this study.
Once convergence is reached, all modulus values within the ROI will be normalized by an averaged modulus value from a small area (typically 5 mm by 5 mm) identified by the user as the normal liver tissue. This step converts all of our results to relative elastic modulus images.
Figure 3.
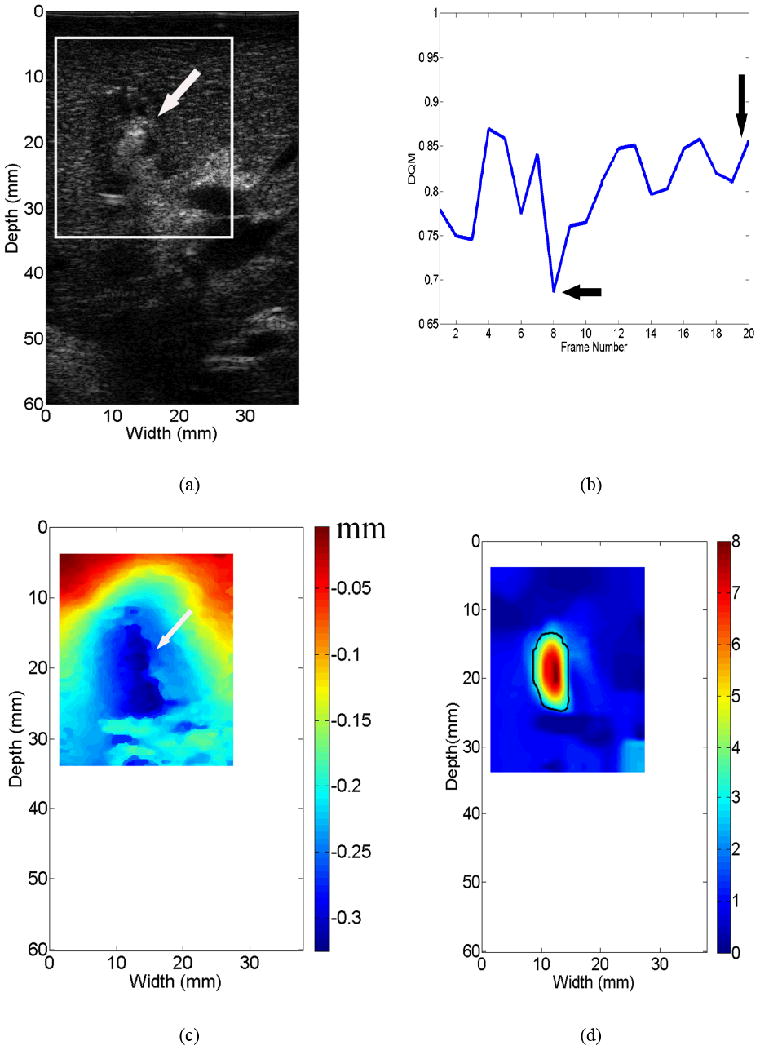
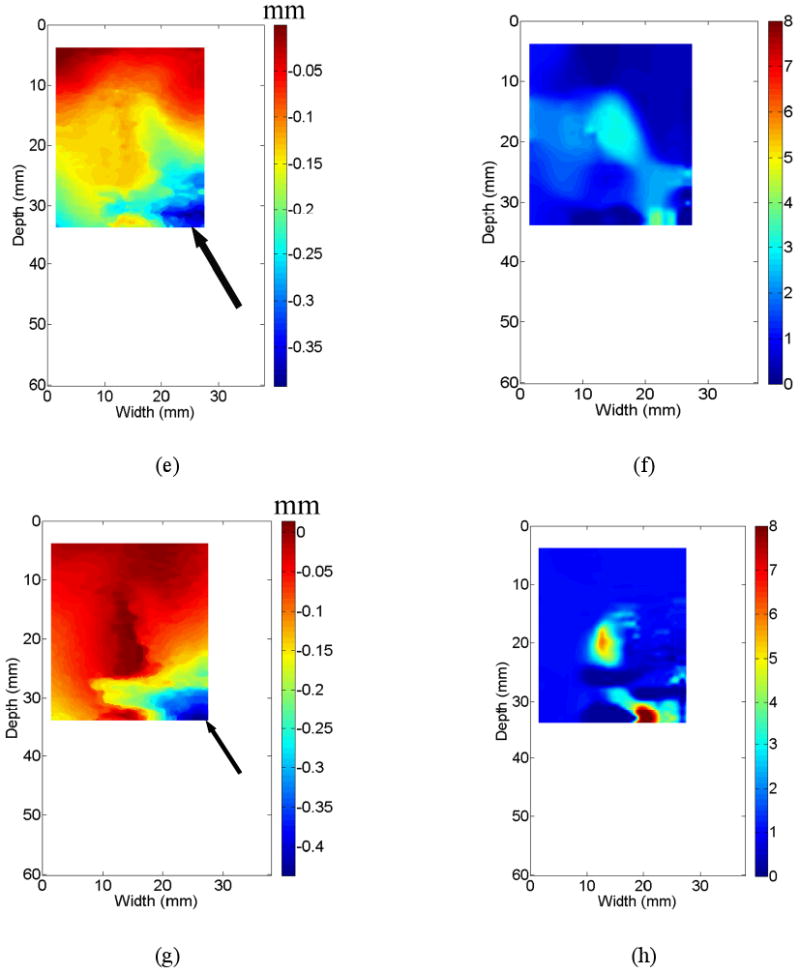
An example demonstrating that different displacement fields affect the quality of resultant elastic modulus images. All three displacement fields [(c), (e) and (g)] were obtained from the same thermal ablation zone shown by the B-mode image in (a). Three resultant elastic modulus images from (c), (e) and (g) are shown in (d), (f) and (h), respectively. Estimated DQM values from a sequence of strain images shown in Movie 1 can be found in (b). The vertical and horizontal arrows point to the DQM values correspond to in displacement fields displayed in (c) and (e), respectively. The arrows in (a) and (c) point to the location of the ablation applicator, while arrows in (e) and (g) point to decorrelation noise in the displacement fields.
2.4 Data Selection and Processing
RF echo data (approximately 160 frames for each thermal ablation zone) acquired for each ablation zone were processed offline using Matlab (Mathworks Inc., MA, USA) to obtain a sequence of strain images using the modified block matching algorithm described above (Jiang and Hall, 2009). During strain image formation, a small two-dimensional kernel (0.90 mm lateral width by 0.40 mm axial length with 83% overlap laterally and 50% overlap axially) was used to track axial displacements (a pixel size of 0.15 mm [lateral] × 0.2 mm [axial]). Then, axial strain images were obtained by fitting the local estimated axial displacement data to a line (i.e. linear regression) whose slope provides local strain at the center of this small (1.8-mm) segment of axial displacement estimates (Kallel and Ophir, 1997).
A displacement quality metric (DQM; (Jiang et al., 2006)) was calculated for each displacement and strain image. The DQM is the product of the normalized cross correlation coefficient among the pre-deformation and motion-compensated post-deformation RF echo fields (a measure of motion tracking accuracy applied to the entire region of interest) and the normalized cross correlation coefficient between two consecutive motion-compensated strain images (a measure of strain image consistency) (Jiang et al. 2006). The DQM values lie between 0 and 1, with one providing the best result. The DQM method is used for semi-automated data selection as described below. Strain images are marked as “high” quality only if at least three consecutive strain images possess DQM values greater than 0.75. One example of DQM estimates for 20 consecutive strain images estimated from a thermal ablation zone (see Fig. 3a) is shown in Fig. 3b. The corresponding 20 frames of strain images displayed side by side with B-mode images can be found in Movie 1. If more than one “high” quality strain image for a given thermal ablation zone exist, one displacement field (typically the displacement field whose corresponding strain image had the highest DQM value and least decorrelation noise as demonstrated in Fig. 3(c) below) is selected to reconstruct the corresponding elastic modulus image as described in Sections 2.2 and 2.3.
Due to computational limitations, the displacement fields selected for the modulus reconstruction (see the ROIs in Figs. 3a and 3c) were spatially decimated to accommodate a smaller finite element mesh (41 × 41). For all cases, the size of finite elements (with modulus constant within a finite element) used for EMI was variable but approximately 0.75 mm × 0.75 mm.
Three displacement images shown in Figs. 3(c), (e) and (g) all correspond to the same thermal ablation zones displayed in Fig. 3(a). Their DQM values are 0.85 (the 20th frame in Fig. 3(b) and Movie 1), 0.68 (the 8th frame in Fig. 3(b) and Movie 1) and 0.42 (not in Movie 1), respectively. In two displacement images (Figs. 3(e) and (g)) with relatively low DQM values, relatively high noise can be observed as indicated by arrows at the lower right corner. Consequently, when we reconstructed elastic modulus images using these three displacement fields, the quality of elastic modulus images was variable. In the case of high quality displacement image (i.e. Fig. 3(c)), a single coherent region where relative modulus values were elevated can be clearly seen from Fig. 3(d). However, the resultant elastic modulus images from two relatively low quality displacement images could either contain considerable noise (Fig. 3(f)) or deviate from the expected shape of the thermal ablation zone (Fig. 3(h)).
Image quality of resultant strain and elastic modulus images was assessed by weighted contrast-to-noise ratio (CNR) defined below (Song et al., 2004):
| (5) |
where S and σ2 denote means and variances of signals, and subscripts b and t represent the background and target, respectively. w is a weighting of the area of the target and the background to the total area given by wx = areax / areatotal. The inclusion of the weighted area is necessary because the target and the background contribute in different amounts to the noise estimates. (Song et al. 2004) It is worth noting that we converted all strain and elastic modulus images to the same resolution (a pixel size of 0.2 mm by 0.2 mm) prior to the estimation of CNR values and all human measurements described below in Section 2.5. To calculate the CNR using Eqn. (5) for each elasticity (strain and modulus) image, we used the manually-segmented thermal ablation zone (see an example given by Fig. 3(d)) and the rest of the image as the target and the background, respectively.
2.5 Measurement of Thermal Ablation Zones
Data from one RF ablation zone was excluded because the thermal ablation zone could not be seen using any modalities including B-mode, strain imaging and EMI. Only data obtained from the remaining 14 thermal ablation zones were processed and analyzed in this study. These 14 thermal ablation zones were manually delineated by three independent observers on strain and elastic modulus images, and corresponding pathology photographs using ImageJ (http://rsbweb.nih.gov/ij/). All three observers are ultrasound physicists/engineers who actively perform research related to ultrasound-based elasticity imaging. To understand the influence of color maps, both color and grayscale strain and elastic modulus images were presented to human readers.
In the first step, all observers were given grayscale strain and elastic modulus images, together with the co-registered B-mode ultrasound images, in a random order and were asked to delineate the thermal lesion boundaries in B-mode, strain and elastic modulus images. All observers had knowledge of the approximate position of each thermal ablation zone by simultaneously viewing the corresponding B-mode image. To look for sites of ablation zones in ultrasound B-mode images, observers were instructed to examine echogenicity changes. Observers were also instructed to look for a smooth contour representing a sharp transition (i.e. large gradient in image contrast) between the normal liver tissue and the ablated tissue on the strain and elastic modulus image. When boundaries of a thermal ablation zone were not clearly defined on corresponding ultrasound B-mode, strain and elastic modulus images, observers were asked to complete their task by conservatively outlining a smooth contour around the position of the ablation applicator (known from the corresponding B-mode image).
In the second step, all observers were given a set of color (color map “jet” in MATLAB) strain and elastic modulus images, together with the co-registered B-mode ultrasound images in a different random order. These color strain and elastic modulus images were exactly the same set of strain and elastic modulus images except the color map. Following the same guidelines mentioned above, observers were asked to delineate the thermal lesion boundaries in those color strain and elastic modulus images. Dynamic range for all strain images was set from either 0 to 2% or 4 times of the frame-average strain, whichever was less. Similarly, we also limited the dynamic range for all elastic modulus images either by using a relative scale ranging from 1 to 8 or 4 times of the frame-average relative modulus value, whichever was less.
In the third step, only 14 gross pathology images were given to these three observers, in a random order. Most in vivo thermal ablation zones contain a central white/gray zone representing coagulation necrosis and a surrounding red ring of about 1–3 mm thickness, representing hemorrhagic and inflammatory reactions (Goldberg et al., 2003; Cha et al., 2000). Because the outer red rim of the thermal ablation zone contains no viable cells (Goldberg et al., 2003; Cha et al., 2000), observers were instructed to include this thin layer from their segmented thermal ablation zones. In all three steps, after the thermal ablation zones were depicted, dimensions and areas of the thermal ablation zones were measured using the ImageJ software. Contouring with ImageJ described above was performed on the same monitor (MultiSync LCD 1860NX, NEC, Japan) with the same default monitor setting.
In the fourth step, we calculated the extent of overlap of areas of thermal ablation zones segmented manually by three observers in gross pathology, elastic modulus and strain images. The overlap was computed as follows:
| (6) |
where ∩ and ∪ represent intersection and union, respectively.
3. Results
Overall we found that there was virtually no difference (< 5%) between measurements made on grayscale and color strain images, though measurements on grayscale strain images resulted in slightly lower errors as compared to measurements obtained from gross pathology photographs. On the other hand, measurements made on color elastic modulus images were slightly more accurate. Therefore, in this section, the comparison between strain imaging and EMI was based on measurements on grayscale strain and color elastic modulus images.
3.1 Visibility of In Vivo Thermal Ablation Zones
As agreed upon by all three observers, the boundaries of all 14 thermal ablation zones were visualized by EMI (100%), while only 11 (78.5%) and 9 (64.5%) were detected by strain imaging and conventional B-mode ultrasound, respectively.
The estimated CNR values (Eqn. (5)) from all strain and elastic modulus images are plotted in Fig. 4. Similar to the results subjectively rated by the human observers, the estimated CNRs also clearly indicate that modulus images (mean ± standard deviation: 3.32 ± 0.81; Minimum: 1.96; Maximum: 5.19) outperform the corresponding strain images (mean ± standard deviation: 1.40 ± 0.78; Minimum: 0.36; Maximum: 2.64).
Figure 4.
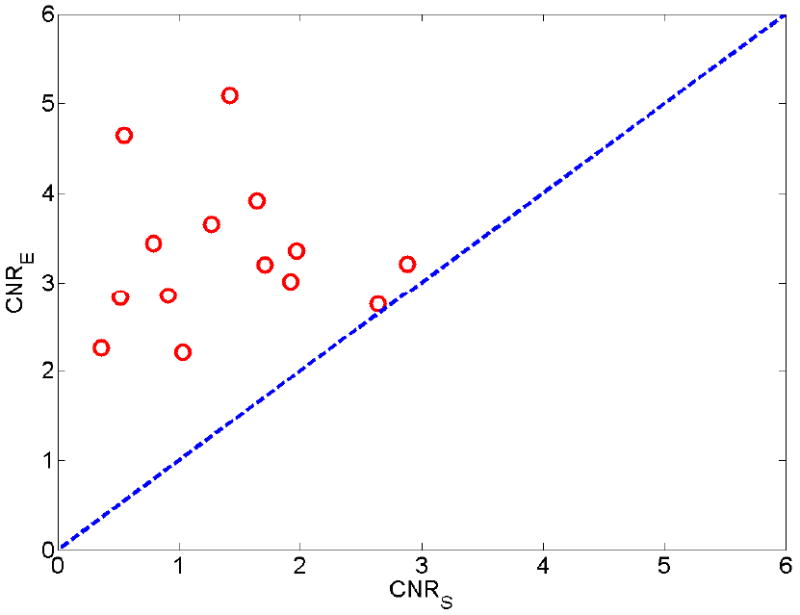
A plot of estimated contrast-to-noise ratios (CNRS) obtained from strain images (X-axis) with respect to estimated CNRE obtained from elastic modulus images (Y-axis). The dashed line indicates a perfect slope representing equal contrast-to-noise ratio from both modalities.
We found, in two cases, that the estimated CNR values were comparable between the strain and modulus imaging. Figure 5 presents matching sonogram, strain, modulus, and gross pathology images of a cross-section from one of these two thermal ablation zones. The thermal ablation zone can be visualized both from the strain (Fig. 5(b)) and elastic modulus (Fig. 5(c)) images. The size delineated by three different observers was consistent and comparable to that in the gross pathology photography. It seems that different observers merely chose different intensity thresholds when asked to manually segment the thermal ablation zone. The estimated CNR (Eqn. (5)) for the strain and elastic modulus images shown in Fig. 5 were 2.64 and 2.75, respectively.
Figure 5.
Images of an in vivo thermal ablation zone: (a) B-mode, (b) strain, (c) reconstructed relative elastic modulus and (d) photography of gross pathology. The contours on (b) and (c) were replicas of human observers' boundaries of ablation zones. Arrows on (a) and (d) point to the thermal ablation zone.
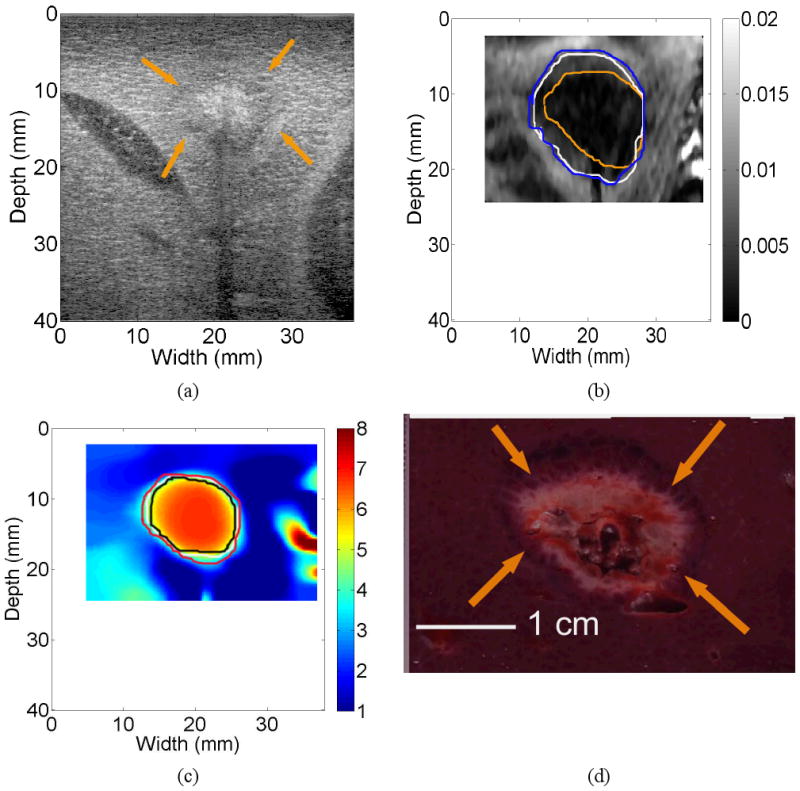
In three cases, the CNR values obtained from strain images were fairly low (0.55, 0.52 and 0.36, respectively). These three cases were three “undetectable” cases agreed upon by all three human observers. One of these three cases is shown in Fig. 6. The calculated CNRs were 0.55 and 4.65 for the strain (Fig. 6(b)) and elastic modulus (Fig. 6(c)) images, respectively. It is easy to see that the thermal ablation zone can be visualized from the elastic modulus images (Fig. 6(c)) but cannot be confidently depicted based on the corresponding strain image (Fig. 6(b)). In fact, there was minimal overlap among the three contours depicted by the three different observers.
Figure 6.

Images of an in vivo thermal ablation zone: (a) B-mode, (b) strain, (c) reconstructed relative elastic modulus and (d) photography of gross pathology. The contours on (b) and (c) were replicas of human observers' boundaries of ablation zones. Arrows on (a) and (d) point to the thermal ablation zone.
3.2 Measurement Variability
In determining the measurement variability, the calculated differences in measured dimensions and areas among three different observers were listed in Table 1. In Table 1, the relative absolute difference between two observers A and B was calculated as follows: relative absolute difference = [measurement of A − measurement of B]/averaged measurement of gross pathology. Generally the measurement variability of the elastic modulus image data was comparable to measurements of the gross pathology data and was much smaller than those of strain imaging data. For example, the average percent difference (mean ± standard deviation) over area measurements of the 14 thermal ablation zones for strain imaging, EMI and gross pathology were 38.1 ± 39.5%, 15.8 ± 13.2% and 11.8 ± 10.5%, respectively.
Table 1.
Inter-observer Variations in Measurements of Thermal Ablation Zones. In this table, “Abs” stands for absolute difference (units: mm for dimensions and mm2 for area measurements) and “Rel” stands for relative absolute difference with respect to measurements obtained from the gross pathology.
| Mean Difference | Standard Deviation | Maximum Difference | Minimum Difference | |||||
|---|---|---|---|---|---|---|---|---|
| Abs (mm or mm2) | Rel | Abs (mm or mm2) | Rel | Abs (mm or mm2) | Rel | Abs (mm or mm2) | Rel | |
| Short Axis (strain) | 3.3 | 27.7% | 2.5 | 22.3% | 10.4 | 98.7% | 0.0 | 0.0% |
| Long Axis (strain) | 3.2 | 19.1% | 3.3 | 26.7% | 15.6 | 97.1% | 0.1 | 0.4% |
| Area (strain) | 61.3 | 38.6% | 54.4 | 39.5% | 212.2 | 176.5% | 1.5 | 0.7% |
| Short Axis (modulus) | 1.2 | 10.0% | 1.1 | 8.2% | 5.6 | 40.4% | 0.0 | 0.4% |
| Long Axis (modulus) | 2.1 | 12.2% | 2.0 | 12.7% | 6.9 | 54.0% | 0.2 | 1.0% |
| Area (modulus) | 28.8 | 15.8% | 22.4 | 13.2% | 79.8 | 43.8% | 0.6 | 0.2% |
| Short Axis (pathology) | 1.5 | 12.9% | 1.2 | 12.0% | 4.8 | 50.9% | 0.0 | 0.0% |
| Long Axis (pathology) | 1.2 | 7.1% | 0.8 | 6.2% | 3.5 | 29.2% | 0.0 | 0.0 |
| Area (pathology) | 20.9 | 11.8% | 15.0 | 10.5% | 51.7 | 48.5% | 0.4 | 0.3% |
The averaged calculated overlap (Eqn. (6)) among three independent observers for strain, elastic modulus and gross pathology images were 0.52 ± 0.21 (mean ± standard deviation), 0.74 ± 0.09 and 0.82 ± 0.10, respectively. Again, in all 14 thermal ablation zones, the calculated overlaps by Eqn. (6) from elastic modulus images were higher than the calculated overlaps from corresponding strain images.
For the thermal ablation zone illustrated in Fig. 5, the calculated overlap of the elastic modulus image was 0.69 and was slightly better than the calculated overlap (0.59) from the strain image. However, in an extreme case shown in Fig. 6 where the thermal ablation zone is barely visible (CNR = 0.55) in the strain image (Fig. 6(b)), the calculated overlap among the three observers for the strain image was only 0.03. It is easy to see that none of these three contours delineated by human observers on the strain image (Fig. 6(b)) were similar to that displayed by the gross pathology image. However, contours depicted by three human observers using the corresponding elastic modulus image (Fig. 6(c)) resulted in a calculated overlap value of 0.70 and were more consistent with the shape of the thermal ablation zone shown by the gross pathology photograph (Fig. 6(d)).
The thermal ablation zone shown in Fig. 7 is an interesting case. Although the calculated CNR value from the strain image (Fig. 7(b)) were only 0.36 and all three observers indicated low confidence on the detectability of the thermal ablation zone using the strain image (Fig. 7(b)). The contours delineated by human observers were remarkably consistent (0.60) as shown in Fig. 7(b), and these three delineated contours were moderately similar to shape and size of the thermal ablation zone on the gross pathology image (Fig. 7(d)). Of note, the calculated CNR and overlap values for the corresponding elastic modulus image (Fig. 7(c)) were 2.26 and 0.67, respectively.
Figure 7.
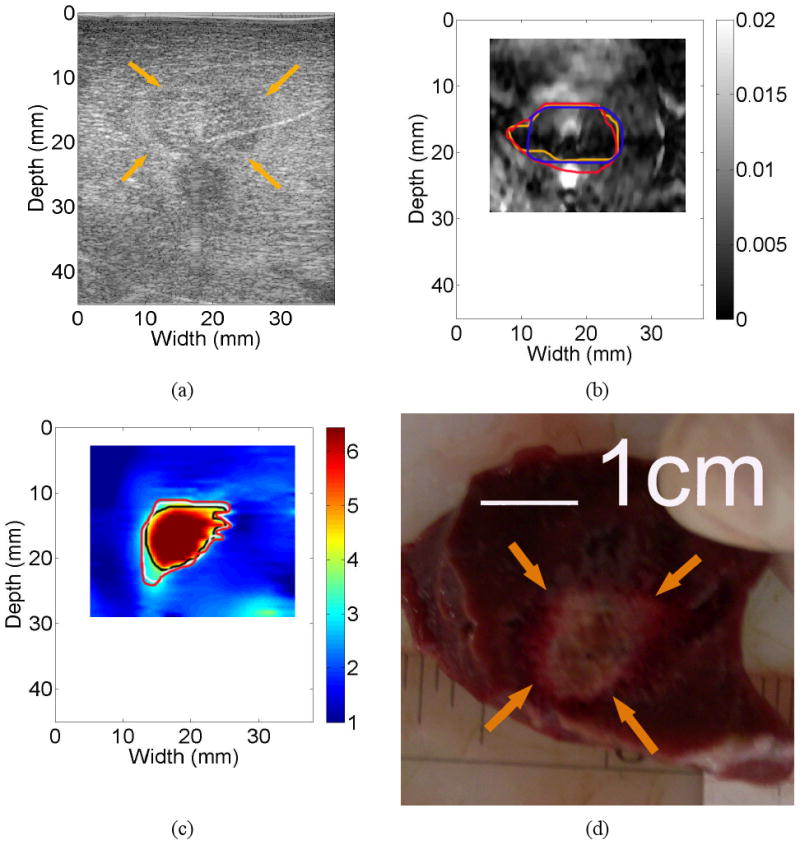
Images of an in vivo thermal ablation zone: (a) B-mode, (b) strain, (c) reconstructed relative elastic modulus and (d) photography of gross pathology. The contours on (b) and (c) were replicas of human observers' boundaries of ablation zones. Arrows on (a) and (d) point to the thermal ablation zone.
3.3 Dimension and Area Correlation Analysis
Measurements of the coagulation area using elasticity imaging and gross pathology were recorded by manually drawing contours (solid lines in three different colors) on respective images (see Figs. 5-7) as described before. Figure 8 shows scatter plots of averaged area measurements among three observers, comparing strain and EMI with freshly sliced gross pathology areas along respective imaging planes. In Fig. 8, the dash-dotted line indicate a perfect slope of 1, while the dashed and solid lines denote the linear fits for EMI and strain imaging data, respectively. Error bars are the standard deviation of three measurements made by three independent human observers, representing the uncertainty of the averaged measurements. Consistent with data discussed before, the error bars of the EMI data are smaller than those of the strain imaging data. The correlation coefficient between EMI and gross pathology areas (r=0.950; p<0.001) is better than between strain imaging and gross pathology areas (r=0.853; p<0.001). Furthermore, the average of absolute percent errors, defined as the average of absolute differences in area measurements between elasticity imaging and gross pathology over the corresponding averaged area measurements obtained from the gross pathology, were 14.7% and 22.3% for EMI and strain imaging, respectively.
Figure 8.
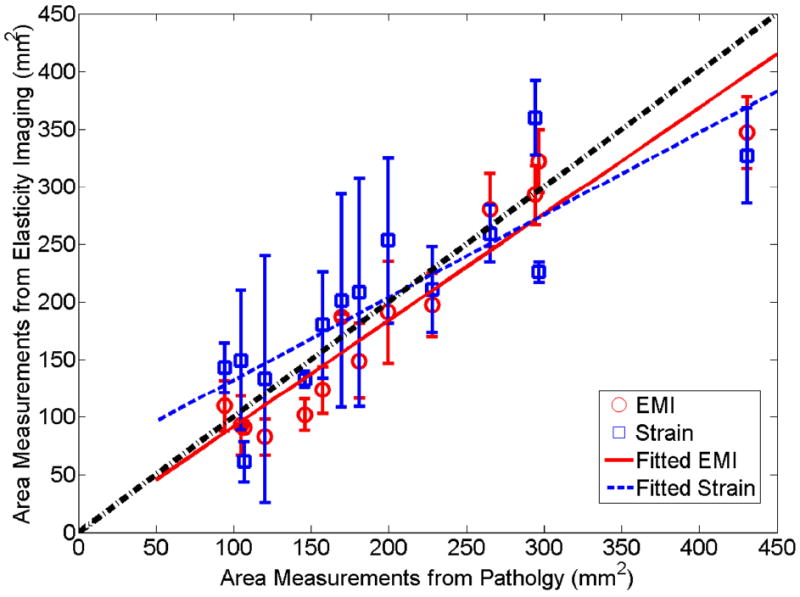
A plot comparing the area of thermal ablation zones between gross pathology and elasticity imaging (squares and circles represent averaged area measurements from three observers obtained from strain imaging and EMI). The estimated linear correlation coefficient between pathology and EMI was 0.950 (p<0.0001), while the estimated linear correlation coefficient between pathology and strain images was 0.857 (p<0.0001). Error bars denote one standard deviation among three observers made the measurements.
Scatter plots of the averaged dimensions (short and long axes) of ablation zones among three observers are presented in Figs. 9(a) and (b), respectively. As these scatter plots show, we found that the short axes of ablation zones obtained using elasticity imaging (elastic modulus and strain imaging) corresponded well to the short axes of the ablation zones on the digitized photographs of gross pathology specimens (r = 0.903 [p<0.001] and 0.733 [p=0.003] and for elastic modulus and strain imaging, respectively). The long axes of the ablation zones on elastic modulus and strain images had a slightly worse correspondence to measurements obtained from the pathologic specimens (r = 0.887 [p<0.001] and 0.747 [p=0.002] for elastic modulus and strain imaging, respectively). To obtain averaged lengths of short and long axes for each thermal ablation zone from three independent observers, we simply averaged their measurements. Therefore, errors that may be caused by the angular shifts of the principle axes among different observers were not taken into account. In both plots, the dash-dotted line indicates a perfect slope of 1, while the dashed and solid lines denote the linear fits for EMI and strain imaging data, respectively.
Figure 9.
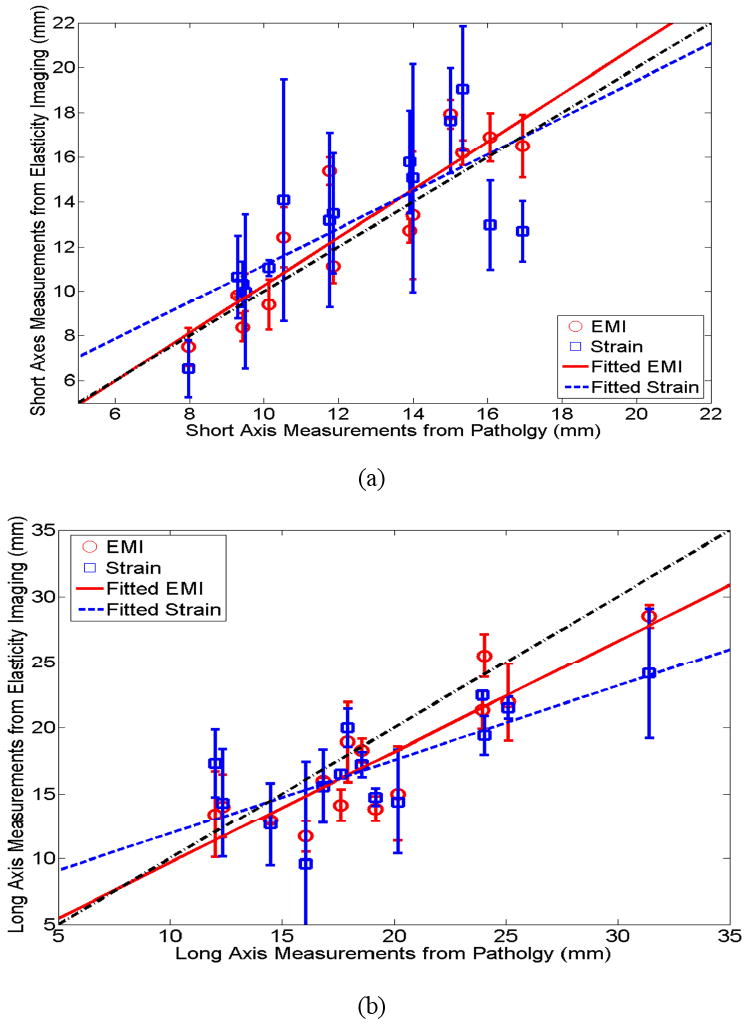
Plots of (a) short axis and (b) long axis of thermal ablation zones between gross pathology and elasticity imaging (squares and circles represent averaged dimension measurements from three observers obtained from strain imaging and EMI). The estimated linear correlation coefficients between pathology and EMI for short and long axes were 0.903 (p<0.001) and 0.887 (p<0.001), respectively, while the estimated linear correlation coefficients for long and short axes between pathology and strain images were 0.733 (p=0.003) and 0.747 (p=0.002), respectively.
3.4 Other Notable Cases
3.4.1. Bifurcated thermal ablation zone
The B-mode (Fig. 10(a)) and strain image (Fig. 10(b)) largely showed a single coherent ablation zone, while, in the reconstructed elastic modulus image (Fig. 10(c)), the bifurcation of the ablation zone is apparent and matches with the gross pathology image (Fig. 10(d)) more accurately in terms of the overall shape. We speculate that, during the insertion of the ablation applicator, a vessel was damaged, causing intra-parenchymal hemorrhage. Possibly, the formation of a blood bubble or the blood itself around the RF electrode (known as the heat sink effect) may have prevented local heat conduction, causing the bifurcated ablation zone. It is interesting to note that only one observer delineated the bifurcated shape of the thermal ablation zone on the elastic modulus image (Fig. 10(c)) and the other two observers were more conservative because of the unusual shape of the thermal ablation. However, two human observers overestimated the size of the thermal ablation zone on the corresponding strain image as shown by contours in Fig. 10(c). In clinical practice, the overestimation of the size of thermal ablation could cause premature termination of the thermal ablation procedure, thereby leaving viable cancerous tissue untreated.
Figure 10.
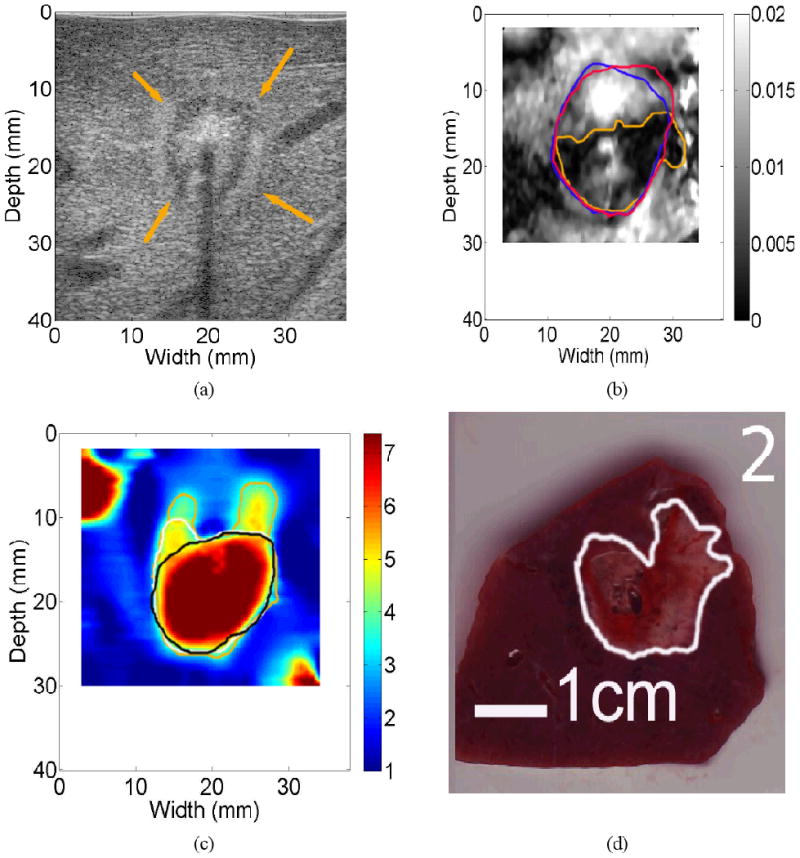
Images of an in vivo thermal ablation zone: (a) B-mode, (b) strain, (c) reconstructed relative elastic modulus and (d) photography of gross pathology. The contours on (b)-(d) were replicas of human observers' boundaries of ablation zones. Arrows on (a) point to the thermal ablation zone.
3.4.2. Detection of a small liver vessel only with Strain Imaging
In Fig. 11(b), the strain image successfully detected the presence of a small vessel (approximately 1.2-mm diameter measured from the B-mode image; see the horizontal arrows on Figs. 11(a), (b) and (d)) because the collapse of the small vessel under the deformation resulted in a bright spot in the corresponding strain image. However, the same vessel was not visualized on the corresponding elastic modulus image (Fig. 11(c)). To completely coagulate a liver tumor, it is desirable to fully destruct some small blood vessels in and around the targeted tumor. Therefore, during an ablation procedure, strain imaging (as well as the B-mode in this case) may have sufficient sensitivity to detect these small vessels that have similar sizes to the liver vessel presented in Figs. 11(a)-(d). The loss of resolution in EMI, probably due to both regularization and large element size (approximately 0.75-mm), is also apparent in other relative elastic modulus images such as Fig. 5(c).
Figure 11.
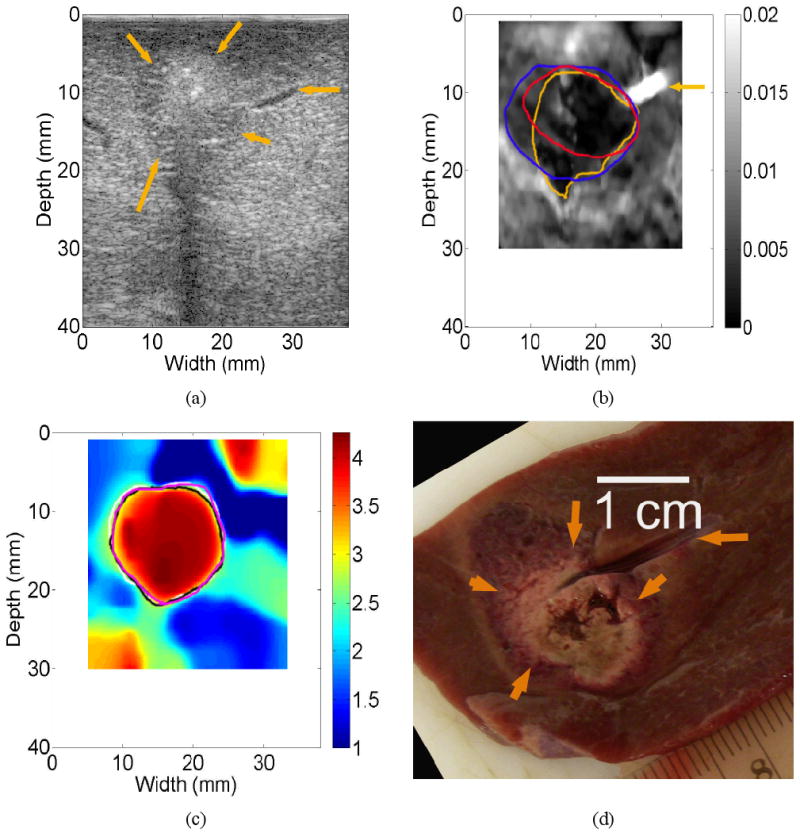
Images of an in vivo thermal ablation zone: (a) B-mode, (b) strain, (c) reconstructed relative elastic modulus and (d) photography of gross pathology. The contours on (b) and (c) were replicas of human observers' boundaries of ablation zones. Horizontal arrows in (a), (b) and (d) point to a small liver vessel, while other arrows on (a) and (b) point to the thermal ablation zone.
4. Discussion
One contribution of our work is that we applied an EMI technique (Jiang et al., 2009) to visualize in vivo thermal ablation zones. Since our ultimate goal is to use this modality to determine whether complete coagulation of a targeted tumor has been achieved in a clinical environment, it is significant to determine the fidelity of such a decision. Although a similar technique has been applied to characterize pathologically-confirmed in vivo breast lesions (Oberai et al., 2009), their imaging results have not been compared to actual pathological findings of these lesions. Our initial results showed that good agreement of the area of thermal ablation zones (correlation = 0.950, p value < 0.001) between EMI measurements and gross pathology. Compared to strain imaging (correlation = 0.85, p value < 0.001), EMI results also showed improved detectability of thermal ablation zones and reduced inter-observer variability both in terms of calculated CNR values (see Fig. 4) and calculated measurement variability (see Tables 1 and 2). More importantly, in one case, the elastic modulus image (Fig. 10(c)) clearly indicated a bifurcated thermal ablation zone and thereby avoided a potential gross pattern error in detection of the thermal ablation zone, compared to the corresponding strain image (Fig. 10(b)). These enhancements will likely improve clinicians' ability to evaluate the ablation zone immediately after the ablation procedure. We also found that there were subtle differences between corresponding EMI and pathological boundaries of ablation zones, because of limited resolution (approximately 0.75-mm element size) and sensitivity (noise in measured displacements) in EMI. The small detected differences (e.g. 1.2-2.5 mm on average in terms of dimension measurements; see Table 3) between corresponding pathology and EMI boundaries are less of a concern for a newly developed technique, given that liver ablation tends to ablate an additional 5 to 10 mm of normal hepatic parenchyma to achieve a safe margin (Nakazawa et al., 2007; Kei et al., 2008).
Table 2.
Area Overlaps Among 3 Observers
| Averaged Overlap (mean ± standard deviation) | Minimum Overlap | Maximum Overlap | |
|---|---|---|---|
| Gross Pathology | 0.82 ± 0.10 | 0.50 | 0.90 |
| Strain | 0.52 ± 0.21 | 0.03 | 0.78 |
| Modulus | 0.74 ± 0.09 | 0.59 | 0.91 |
Table 3.
Summary of Measurement Difference between EMI and Gross Pathology Photos for 14 Thermal Ablation Zones. In this table, “Abs” stands for absolute difference (units: mm for dimensions and mm2 for area measurements) and “Rel” stands for relative absolute different with respect to measurements obtained from gross pathology.
| Mean Difference | Standard Deviation | Maximum Difference | Minimum Difference | |||||
|---|---|---|---|---|---|---|---|---|
| Abs (mm or mm2) | Rel | Abs (mm or mm2) | Rel | Abs (mm or mm2) | Rel | Abs (mm or mm2) | Rel | |
| Short Axis (strain) | 2.0 | 16.0% | 1.2 | 7.8% | 4.2 | 33.7% | 0.5 | 5.1% |
| Long Axis (strain) | 3.5 | 18.6% | 2.1 | 12.2% | 7.3 | 44.1% | 1.1 | 6.2% |
| Area (strain) | 40.3 | 22.3% | 27.2 | 14.7% | 103.5 | 52.1% | 6.1 | 2.3% |
| Short Axis (modulus) | 1.2 | 9.6% | 1.0 | 7.9% | 3.6 | 30.8% | 0.4 | 2.5% |
| Long Axis (modulus) | 2.5 | 13.4% | 1.6 | 8.6% | 5.3 | 27.8% | 0.3 | 1.5% |
| Area (modulus) | 26.7 | 14.8% | 20.3 | 9.1% | 83.2 | 31.4% | 1.4 | 0.5% |
Our three observers missed nearly 40% of thermal ablation zones using conventional B-mode images while the radiologist (AA) was able to identify all thermal ablation zones during data acquisition (aided by the improved visualization of gas bubbles and improved B-mode images). This reduced detectability could be explained as follows. First, the radiologist has considerable experience and training for ultrasound-guided thermal ablation, while our human observers are researchers with various years of training in ultrasound-based elasticity imaging. Second, the radiologist used high quality B-mode images produced by the imaging system whereas offline B-mode images used by the three observers were reconstructed using envelope detection of ultrasound echo data and are of poorer quality than the manufacturer's B-mode images. Furthermore, the echogenicity of the RF thermal ablation zone was variable and could be hypoechoic, hyperechoic, isoechoic, and/or mixed-echoic (Cha et al., 2000; Liu et al., 2004). Consequently, it is possible that small echogenicity differences between normal liver and ablated tissues were missed.
It is known that high CNRs in elasticity images (Bilgen, 1999) indicate enhanced detectability of targets. We plot the estimated overlaps (Eqn. (6)) among three observers with respect to estimated CNR values (Eqn. (5)) in Fig. 12. The high inter-observer variability (overlap < 0.5) in 4 thermal ablation zones (lower right quarter in Fig. 12) could be attributed to low CNR values (< 1.0) in the strain images. The exception is the thermal ablation zone presented in Fig. 7 where the CNR and overlap are 0.36 and 0.60 for the strain image shown in Fig. 7(b). Since only a small number of samples were investigated, further studies are needed.
Figure 12.
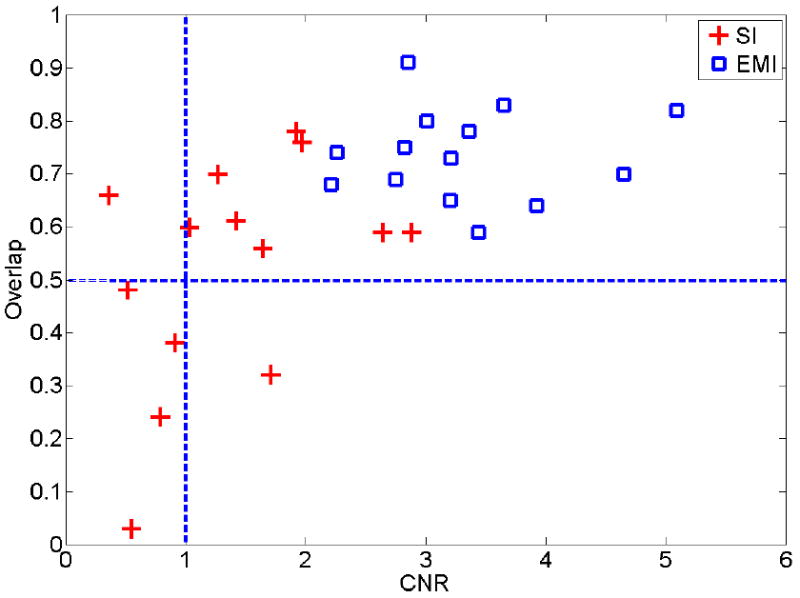
A plot illustrating the distribution of area overlap values (Eqn. 6) measured among three human observers with respect to the estimated CNR values (Eqn. 5) from strain (cross) and relative elastic modulus (square) images.
We also recognize that the calculated CNR values will be inevitably affected by the selected dynamic range for strain and elastic modulus images. In this work, the dynamic range was limited to an empirical range (approximately 1∼8) for relative elastic modulus images so that human observers could easily visualize the sharp transition [typically between 3 to 5 time stiffer than normal liver tissue (Kiss et al., 2004)] of modulus values between the thermal ablation zone and its normal surrounding liver tissues. For all strain images, since the contrast transfer function between intrinsic elastic moduli and mechanical strain values is highly nonlinear (Ponnekanti et al., 1995; Bharat and Varghese, 2006), it is more difficult to determine an ideal dynamic range. We used both 2% of absolute strain (or 4 times of the frame-average strain) and 3 times of the frame-average strain (data were not shown) as the cutoffs. The differences in terms of area measurements between these two dynamic ranges were insignificant. The dynamic range of 0-2% slightly improved the averaged absolute percent error from 27.3% to 22.3%. Therefore, the dynamic range of 0-2% was reported throughout this article.
One study by our colleagues (Pareek et al., 2006) investigated the utility of strain imaging for visualizing thermal ablation zones for renal ablation in a porcine model. They reported statistically significant correlations (r=0.93) between ablation area measurements of strain imaging and pathology. In another recent study by researchers from the University of Rochester (Zhang et al., 2008), sonoelastography technique was used to depict in vivo thermal ablation zones created both by high intensity focused ultrasound (HIFU) and radiofrequency ablation. In 18 thermal ablation zones created by radiofrequency ablation, they calculated a correlation of 0.88 between the sono-elastographical area measurements and pathological area measurements. Our correlation values (both strain imaging and EMI) were comparable with these two studies.
Our results showed that strain imaging slightly overestimated (on average 6.7%) sizes of the thermal ablation zones. From our theoretical study of numerical phantoms (Jiang et al., 2007), we found that, because of the complex stress/displacement pattern induced by the ablation applicator, elastic contrast was fairly low in axial strain images at points corresponding to the lateral margins of thermal ablation zones. This phenomenon may interfere with human observers' ability to depict boundaries of the thermal ablation zones using axial strain images.
Consistent with the above-mentioned elasticity imaging studies (Pareek et al., 2006; Zhang et al.), EMI slightly underestimated (on average 8.9 %) sizes of thermal ablation zones. Furthermore, relative elastic contrast estimated by EMI between the untreated and ablated tissue (1-cm2 regions at the center of each ablation zone) was only 8.37 ± 1.41. This value was lower than our internal mechanical compression testing results (approximately 15) of these same thermal ablation zones where 1-cm3 cubes of each ablation volume were tested following a previously published protocol (Kiss et al., 2004). Similar elastic contrast values between treated and untreated porcine liver tissues were also reported by Zhang et al. (Zhang et al., 2008). This underestimation was much larger than what previously reported for similar techniques (15-25% underestimation) in tissue mimicking phantoms (Oberai et al., 2004; Doyley et al., 2000). However, to spare the central cores of ablation zones for mechanical testing, all ultrasound (therefore EMI) imaging planes were at least 1-cm away from central planes of thermal ablation zones. It is logical to expect ablated tissue away from the needle applicator to be less stiff than the ablated tissue near the needle applicator, because the tissue stiffness change is largely temperature-dependent (Bharat et al., 2005). Our ongoing research is to address both underestimations (i.e. size and elastic contrast) by using a more intelligent regularization method during inverse modulus reconstruction and improving the accuracy of speckle tracking.
We used a DQM metric (Jiang et al., 2006) as the basis to pre-select displacement images. First, as demonstrated in Figs. 3(a)-(h), the quality of displacements affected the outcomes of EMI because the displacement estimates provide fundamental information for modulus reconstruction. Although good regularization methods (Doyley et al., 2006) make the reconstruction process more robust, good quality displacement measurements should enable us to reduce the dependence on regularization. Second, we generally obtain a sequence of displacement fields for EMI in a clinical setting. The use of DQM could be a method for automated displacement data selection, thereby potentially eliminating user-dependency.
We also found that, when grayscale elastic modulus images were used, human observers tended to further underestimate sizes of thermal ablation zones. The underestimation increased to 12.0% (up from 8.9% as described above) Compared to measurements made from color elastic modulus images using the same dynamic range described in Section 2.5, the correlation of area measurements between grayscale elastic modulus images and gross pathology reduced to 0.90 (down from 0.95 as described above). Further studies of this topic may help us understand how to use appropriate color maps to improve the visualization of thermal ablation zones (Rogowitz and Treinish, 2005).
One limitation of our study is that ultrasound images were not automatically registered with photographs of gross pathology. Since markers corresponding to respective imaging planes were created on the surfaces of liver lobes during data acquisition, we are reasonably confident that imaging planes of gross pathology should be in the vicinity of elasticity imaging planes. However, during post-processing of gross pathology and ultrasound-related imaging results, we were not able to find enough landmarks to estimate the errors of such manual alignments. This limitation could be resolved in our future studies. In the literature, multiple fiducial needles were used to register 3D images in and near ablation zones with sufficient accuracy (approximately 1-mm error) (Lazebnik et al., 2003). Another limitation with the porcine model is that all thermal ablation zones were created in healthy parenchyma. The basic assumption of using EMI to differentiate ablation zones is that protein denaturation due to heating causes an increase of stiffness in ablated tissue (Kiss et al., 2004). Because of this, the presence of certain liver masses which may be also harder (e.g. cholangiocarcinomas (Yeh et al., 2002)) or softer (e.g. HCCs (Yeh et al., 2002)) than normal liver tissue will likely make this differentiation more difficult.
The modulus reconstruction method (Eqns. 2-4) described in this article assumes that both normal and ablated liver tissues are linearly elastic. Since nearly all soft tissue are nonlinear (Fung, 1993), using a hyper-elastic material model similar to the model used by Oberai et al. (Oberai et al., 2009) may improve our results at the expense of larger computational demands. However, inverse reconstruction of nonlinear material properties as in their work (Oberai et al., 2009) might not be feasible because the large accumulative deformation (e.g. 15-20% of compression) required would be difficult to achieve in the liver with electrode displacement elastography.
Another limitation of our method is that we require an user to identify the location of the ablation applicator so that the deformation induced by the applicator (i.e. the source of mechanical stimulus) is a part of the boundary conditions.
In this study, open abdominal ablation procedures were performed. Clinically, approaches for hepatic ablation include both percutaneous and surgical ablation (laparoscopy and open) techniques. Although the percutaneous approach is preferred by many institutions because of its minimally invasive nature (e.g. less morbidity, complications and associated healthcare costs), thermal ablation using surgical procedures including open-abdominal approach also provide distinct advantages (Siperstein et al., 1997; Burdio et al., 2008). In large number of cases, hepatic ablation is still performed as open-abdominal procedures. With surgical ablation techniques, the entire liver can be imaged with a high-frequency intra-operative ultrasound transducer placed directly on the surface of the liver, resulting in better placement for ablation applicators and subsequent lower recurrence rates (Burdio et al., 2008). Although we do not make any assumptions about the liver geometry, we use all displacement estimates along edges of a user-defined ROI (see Fig. 3(a)) as a part of the boundary conditions. If our method would be applied to percutaneous ablation, the presence of the body wall may induce phase aberration, signal loss and distortion in ultrasound data, thereby resulting in less accurate displacement estimation under certain conditions (Varghese et al., 2001). If these inaccurate displacements happen to be around the edge of the ROI, they would likely degrade our ability to visualize the thermal ablation zone as the examples demonstrated in Figs. 3(f) and (g). This use of EMI during open abdominal ablation, a less complicated imaging condition, is a necessary first step to test its clinical utility. Our ongoing research is to test the above-mentioned EMI method in the presence of a tumor background and using percutaneous ablation.
Currently, the elastic modulus reconstruction algorithm is implemented using MATLAB (Mathworks Inc., MA, USA) and provides an elastic modulus image in 15-20 minutes. However, achieving a reasonably fast frame rate (20 second/frame) for EMI is indeed possible. The formation of a 2D elastic modulus image in 30 seconds using advanced programming language C in conjunction with a much less advanced personal computer (Pentium 1-GHz) was reported in by Oberai et al. (Oberai et al., 2004)
5. Conclusions
The use of our EMI method to visualize in vivo thermal ablation zones was presented. In all fourteen cases, when compared to strain imaging, the elastic modulus images show equal or better detectability in terms of visualization of the in vivo thermal ablation zones. Our results also demonstrate that the proposed EMI method has the potential to accurately (correlation = 0.950 and mean error = 8.9%) depict boundaries of complex thermal ablation zones. This initial result is encouraging and warrants further carefully-planned studies involving a reasonably large number of pre-clinical animal experiments, in particular, using tumor-bearing animal models. If successful, the ultrasound-based EMI method can be a useful means for monitoring and evaluating thermal ablation procedures involving human patients.
Supplementary Material
Acknowledgments
We gratefully acknowledge the support by NIH grants R01CA100373, R01CA112192 and R01CA112192-03S1. Ted Fisher and Ryan DeWall are supported, in part, by a NIH training grant T32CA09206. We are also grateful to colleagues at the University of Wisconsin (especially Drs. Mark Kliewer and Shyam Bharat and Ms. Lisa Sampson) for their assistance in equipment access and data acquisition during ablation experiments.
References
- Barbone PE, Bamber JC. Quantitative elasticity imaging: what can and cannot be inferred from strain images. Physics in Medicine & Biology. 2002;47:2147–64. doi: 10.1088/0031-9155/47/12/310. [DOI] [PubMed] [Google Scholar]
- Bharat S, Techavipoo U, Kiss MZ, Liu W, Varghese T. Monitoring stiffness changes in lesions after radiofrequency ablation at different temperatures and durations of ablation. Ultrasound in Medicine and Biology. 2005;31:415–22. doi: 10.1016/j.ultrasmedbio.2004.12.020. [DOI] [PubMed] [Google Scholar]
- Bharat S, Varghese T. Contrast-transfer improvement for electrode displacement elastography. Phys Med Biol. 2006;51:6403–18. doi: 10.1088/0031-9155/51/24/008. [DOI] [PubMed] [Google Scholar]
- Bilgen M. Target detectability in acoustic elastography. IEEE Transactions on Ultrasonics, Ferroelectrics and Frequency Control. 1999;46:1128–33. doi: 10.1109/58.796118. [DOI] [PubMed] [Google Scholar]
- Brace CL, Laeseke PF, Sampson LA, Frey TM, van der Weide DW, Lee FT., Jr Microwave ablation with a single small-gauge triaxial antenna: in vivo porcine liver model. Radiology. 2007;242:435–40. doi: 10.1148/radiol.2422051411. [DOI] [PMC free article] [PubMed] [Google Scholar]
- Brunke SS, Insana MF, Dahl JJ, Hansen C, Ashfaq M, Ermert H. An ultrasound research interface for a clinical system. IEEE Trans Ultrason Ferroelectr Freq Control. 2007;54:198–210. doi: 10.1109/tuffc.2007.226. [DOI] [PubMed] [Google Scholar]
- Burdio F, Mulier S, Navarro A, Figueras J, Berjano E, Poves I, Grande L. Influence of approach on outcome in radiofrequency ablation of liver tumors. Surg Oncol. 2008;17:295–9. doi: 10.1016/j.suronc.2008.03.002. [DOI] [PubMed] [Google Scholar]
- Bush NL, Rivens I, ter Haar GR, Bamber JC. Acoustic properties of lesions generated with an ultrasound therapy system. Ultrasound Med Biol. 1993;19:789–801. doi: 10.1016/0301-5629(93)90095-6. [DOI] [PubMed] [Google Scholar]
- Callstrom MR, Atwell TD, Charboneau JW, Farrell MA, Goetz MP, Rubin J, Sloan JA, Novotny PJ, Welch TJ, Maus TP, Wong GY, Brown KJ. Painful metastases involving bone: percutaneous image-guided cryoablation--prospective trial interim analysis. Radiology. 2006;241:572–80. doi: 10.1148/radiol.2412051247. [DOI] [PubMed] [Google Scholar]
- Carter DL, MacFall JR, Clegg ST, Wan X, Prescott DM, Charles HC, Samulski TV. Magnetic resonance thermometry during hyperthermia for human high-grade sarcoma. Int J Radiat Oncol Biol Phys. 1998;40:815–22. doi: 10.1016/s0360-3016(97)00855-9. [DOI] [PubMed] [Google Scholar]
- Cha CH, Lee FT, Jr, Gurney JM, Markhardt BK, Warner TF, Kelcz F, Mahvi DM. CT versus sonography for monitoring radiofrequency ablation in a porcine liver. AJR Am J Roentgenol. 2000;175:705–11. doi: 10.2214/ajr.175.3.1750705. [DOI] [PubMed] [Google Scholar]
- Doyley MM, Meaney PM, Bamber JC. Evaluation of an iterative reconstruction method for quantitative elastography. Physics in Medicine & Biology. 2000;45:1521–40. doi: 10.1088/0031-9155/45/6/309. [DOI] [PubMed] [Google Scholar]
- Doyley MM, Srinivasan S, Dimidenko E, Soni N, Ophir J. Enhancing the performance of model-based elastography by incorporating additional a priori information in the modulus image reconstruction process. Phys Med Biol. 2006;51:95–112. doi: 10.1088/0031-9155/51/1/007. [DOI] [PubMed] [Google Scholar]
- Dupuy DE, Goldberg SN. Image-guided radiofrequency tumor ablation: challenges and opportunities--part II. J Vasc Interv Radiol. 2001;12:1135–48. doi: 10.1016/s1051-0443(07)61670-4. [DOI] [PubMed] [Google Scholar]
- Fahey BJ, Hsu SJ, Wolf PD, Nelson RC, Trahey GE. Liver ablation guidance with acoustic radiation force impulse imaging: challenges and opportunities. Phys Med Biol. 2006;51:3785–808. doi: 10.1088/0031-9155/51/15/013. [DOI] [PMC free article] [PubMed] [Google Scholar]
- Fung YC. Biomechanics : mechanical properties of living tissues. New York: Springer-Verlag; 1993. [Google Scholar]
- Gao L, Parker KJ, Lerner RM, Levinson SF. Imaging of the elastic properties of tissue--a review. Ultrasound in Medicine & Biology. 1996;22:959–77. doi: 10.1016/s0301-5629(96)00120-2. [DOI] [PubMed] [Google Scholar]
- Gazelle GS, Goldberg SN, Solbiati L, Livraghi T. Tumor ablation with radio-frequency energy. Radiology. 2000;217:633–46. doi: 10.1148/radiology.217.3.r00dc26633. [DOI] [PubMed] [Google Scholar]
- Gervais DA, McGovern FJ, Arellano RS, McDougal WS, Mueller PR. Radiofrequency ablation of renal cell carcinoma: part 1, Indications, results, and role in patient management over a 6-year period and ablation of 100 tumors. AJR Am J Roentgenol. 2005;185:64–71. doi: 10.2214/ajr.185.1.01850064. [DOI] [PubMed] [Google Scholar]
- Gervais DA, McGovern FJ, Wood BJ, Goldberg SN, McDougal WS, Mueller PR. Radio-frequency ablation of renal cell carcinoma: early clinical experience. Radiology. 2000;217:665–72. doi: 10.1148/radiology.217.3.r00dc39665. [DOI] [PubMed] [Google Scholar]
- Goldberg SN, Charboneau JW, Dodd GD, 3rd, Dupuy DE, Gervais DA, Gillams AR, Kane RA, Lee FT, Jr, Livraghi T, McGahan JP, Rhim H, Silverman SG, Solbiati L, Vogl TJ, Wood BJ. Image-guided tumor ablation: proposal for standardization of terms and reporting criteria. Radiology. 2003;228:335–45. doi: 10.1148/radiol.2282021787. [DOI] [PubMed] [Google Scholar]
- Goldberg SN, Gazelle GS, Mueller PR. Thermal ablation therapy for focal malignancy: a unified approach to underlying principles, techniques, and diagnostic imaging guidance. AJR Am J Roentgenol. 2000;174:323–31. doi: 10.2214/ajr.174.2.1740323. [DOI] [PubMed] [Google Scholar]
- Goldberg SN, Gazelle GS, Solbiati L, Livraghi T, Tanabe KK, Hahn PF, Mueller PR. Ablation of liver tumors using percutaneous RF therapy. AJR Am J Roentgenol. 1998;170:1023–8. doi: 10.2214/ajr.170.4.9530053. [DOI] [PubMed] [Google Scholar]
- Greenleaf JF, Fatemi M, Insana M. Selected methods for imaging elastic properties of biological tissues. Annual Review of Biomedical Engineering. 2003;5:57–78. doi: 10.1146/annurev.bioeng.5.040202.121623. [DOI] [PubMed] [Google Scholar]
- Hall TJ. AAPM/RSNA physics tutorial for residents: topics in US: beyond the basics: elasticity imaging with US. Radiographics. 2003;23:1657–71. doi: 10.1148/rg.236035163. [DOI] [PubMed] [Google Scholar]
- Hyodoh H, Hyodoh K, Takahashi K, Furuse M, Kawamoto C, Isoda N, Hozumi M, Ido K, Hirota N. Microwave coagulation therapy on hepatomas: CT and MR appearance after therapy. J Magn Reson Imaging. 1998;8:451–8. doi: 10.1002/jmri.1880080228. [DOI] [PubMed] [Google Scholar]
- Jeffrey SS, Birdwell RL, Ikeda DM, Daniel BL, Nowels KW, Dirbas FM, Griffey SM. Radiofrequency ablation of breast cancer: first report of an emerging technology. Arch Surg. 1999;134:1064–8. doi: 10.1001/archsurg.134.10.1064. [DOI] [PubMed] [Google Scholar]
- Jiang J, Hall T. A Generalized Speckle Tracking Algorithm for Ultrasonic Strain Imaging Using Dynamic Programming. Ultrasound in Medicine & Biology. 2009 doi: 10.1016/j.ultrasmedbio.2009.05.016. In Press. [DOI] [PMC free article] [PubMed] [Google Scholar]
- Jiang J, Hall TJ, Sommer AM. A novel performance descriptor for ultrasonic strain imaging: a preliminary study. IEEE Trans Ultrason Ferroelectr Freq Control. 2006;53:1088–102. doi: 10.1109/tuffc.2006.1642508. [DOI] [PMC free article] [PubMed] [Google Scholar]
- Jiang J, Varghese T, Brace C, Madsen E, Hall T, Bharat S, Hobson M, Zagzebski J, Lee F., Jr Young's Modulus Reconstruction for Radio-Frequency Ablation Electrode-Induced Displacement Fields: A Feasibility Study. IEEE Trans Med Imaging. 2009 doi: 10.1109/TMI.2009.2015355. [DOI] [PMC free article] [PubMed] [Google Scholar]
- Jiang J, Varghese T, Chen Q, Hall TJ, Zagzebski JA. Finite element analysis of tissue deformation with a radiofrequency ablation electrode for strain imaging. IEEE Trans Ultrason Ferroelectr Freq Control. 2007;54:281–9. doi: 10.1109/tuffc.2007.242. [DOI] [PubMed] [Google Scholar]
- Kallel F, Bertrand M. Tissue elasticity reconstruction using linear perturbation method. IEEE Transactions on Medical Imaging. 1996;15:299–313. doi: 10.1109/42.500139. [DOI] [PubMed] [Google Scholar]
- Kallel F, Ophir J. A least-squares strain estimator for elastography. Ultrasonic Imaging. 1997;19:195–208. doi: 10.1177/016173469701900303. [DOI] [PubMed] [Google Scholar]
- Kallel F, Stafford RJ, Price RE, Righetti R, Ophir J, Hazle JD. The feasibility of elastographic visualization of HIFU-induced thermal lesions in soft tissues. Image-guided high-intensity focused ultrasound. Ultrasound in Medicine & Biology. 1999;25:641–7. doi: 10.1016/s0301-5629(98)00184-7. [DOI] [PubMed] [Google Scholar]
- Kei SK, Rhim H, Choi D, Lee WJ, Lim HK, Kim YS. Local tumor progression after radiofrequency ablation of liver tumors: analysis of morphologic pattern and site of recurrence. AJR Am J Roentgenol. 2008;190:1544–51. doi: 10.2214/AJR.07.2798. [DOI] [PubMed] [Google Scholar]
- Kiss MZ, Varghese T, Hall TJ. Viscoelastic characterization of in vitro canine tissue. Physics in Medicine & Biology. 2004;49:4207–18. doi: 10.1088/0031-9155/49/18/002. [DOI] [PMC free article] [PubMed] [Google Scholar]
- Laeseke PF, Sampson LA, Frey TM, Mukherjee R, Winter TC, 3rd, Lee FT, Jr, Brace CL. Multiple-electrode radiofrequency ablation: comparison with a conventional cluster electrode in an in vivo porcine kidney model. J Vasc Interv Radiol. 2007;18:1005–10. doi: 10.1016/j.jvir.2007.05.010. [DOI] [PubMed] [Google Scholar]
- Lazebnik RS, Lancaster TL, Breen MS, Lewin JS, Wilson DL. Volume registration using needle paths and point landmarks for evaluation of interventional MRI treatments. IEEE Trans Med Imaging. 2003;22:653–60. doi: 10.1109/TMI.2003.812246. [DOI] [PubMed] [Google Scholar]
- Lencioni R, Cioni D, Crocetti L, Franchini C, Pina CD, Lera J, Bartolozzi C. Early-stage hepatocellular carcinoma in patients with cirrhosis: long-term results of percutaneous image-guided radiofrequency ablation. Radiology. 2005;234:961–7. doi: 10.1148/radiol.2343040350. [DOI] [PubMed] [Google Scholar]
- Liang P, Dong B, Yu X, Yu D, Wang Y, Feng L, Xiao Q. Prognostic factors for survival in patients with hepatocellular carcinoma after percutaneous microwave ablation. Radiology. 2005;235:299–307. doi: 10.1148/radiol.2351031944. [DOI] [PubMed] [Google Scholar]
- Liu W, Techavipoo U, Varghese T, Zagzebski JA, Chen Q, Lee FT., Jr Elastographic versus x-ray CT imaging of radio frequency ablation coagulations: an in vitro study. Medical Physics. 2004;31:1322–32. doi: 10.1118/1.1738963. [DOI] [PubMed] [Google Scholar]
- Lu MD, Xu HX, Xie XY, Yin XY, Chen JW, Kuang M, Xu ZF, Liu GJ, Zheng YL. Percutaneous microwave and radiofrequency ablation for hepatocellular carcinoma: a retrospective comparative study. J Gastroenterol. 2005;40:1054–60. doi: 10.1007/s00535-005-1671-3. [DOI] [PubMed] [Google Scholar]
- Mikami T, Takahashi A, Hashi K, Gasa S, Houkin K. Performance of bipolar forceps during coagulation and its dependence on the tip material: a quantitative experimental assay. Technical note. J Neurosurg. 2004;100:133–8. doi: 10.3171/jns.2004.100.1.0133. [DOI] [PubMed] [Google Scholar]
- Montgomery RS, Rahal A, Dodd GD, 3rd, Leyendecker JR, Hubbard LG. Radiofrequency ablation of hepatic tumors: variability of lesion size using a single ablation device. AJR Am J Roentgenol. 2004;182:657–61. doi: 10.2214/ajr.182.3.1820657. [DOI] [PubMed] [Google Scholar]
- Nakazawa T, Kokubu S, Shibuya A, Ono K, Watanabe M, Hidaka H, Tsuchihashi T, Saigenji K. Radiofrequency Ablation of Hepatocellular Carcinoma: Correlation Between Local Tumor Progression After Ablation and Ablative Margin. Am J Roentgenol. 2007;188:480–8. doi: 10.2214/AJR.05.2079. [DOI] [PubMed] [Google Scholar]
- Nguyen CL, Scott WJ, Young NA, Rader T, Giles LR, Goldberg M. Radiofrequency ablation of primary lung cancer: results from an ablate and resect pilot study. Chest. 2005;128:3507–11. doi: 10.1378/chest.128.5.3507. [DOI] [PubMed] [Google Scholar]
- Oberai AA, Gokhale NH, Doyley MM, Bamber JC. Evaluation of the adjoint equation based algorithm for elasticity imaging. Physics in Medicine & Biology. 2004;49:2955–74. doi: 10.1088/0031-9155/49/13/013. [DOI] [PubMed] [Google Scholar]
- Oberai AA, Gokhale NH, Goenezen S, Barbone PE, Hall TJ, Sommer AM, Jiang J. Linear and nonlinear elasticity imaging of soft tissue in vivo: demonstration of feasibility. Phys Med Biol. 2009;54:1191–207. doi: 10.1088/0031-9155/54/5/006. [DOI] [PMC free article] [PubMed] [Google Scholar]
- Ophir J, Alam SK, Garra B, Kallel F, Konofagou E, Krouskop T, Varghese T. Elastography: ultrasonic estimation and imaging of the elastic properties of tissues. Proceedings of the Institution of Mechanical Engineers Part H - Journal of Engineering in Medicine. 1999;213:203–33. doi: 10.1243/0954411991534933. [DOI] [PubMed] [Google Scholar]
- Ophir J, Cespedes I, Ponnekanti H, Yazdi Y, Li X. Elastography: a quantitative method for imaging the elasticity of biological tissues. Ultrasonic Imaging. 1991;13:111–34. doi: 10.1177/016173469101300201. [DOI] [PubMed] [Google Scholar]
- Pareek G, Wilkinson ER, Bharat S, Varghese T, Laeseke PF, Lee FT, Jr, Warner TF, Zagzebski JA, Nakada SY. Elastographic measurements of in-vivo radiofrequency ablation lesions of the kidney. J Endourol. 2006;20:959–64. doi: 10.1089/end.2006.20.959. [DOI] [PubMed] [Google Scholar]
- Pilatou MC, Stewart EA, Maier SE, Fennessy FM, Hynynen K, Tempany CM, McDannold N. MRI-based thermal dosimetry and diffusion-weighted imaging of MRI-guided focused ultrasound thermal ablation of uterine fibroids. J Magn Reson Imaging. 2009;29:404–11. doi: 10.1002/jmri.21688. [DOI] [PMC free article] [PubMed] [Google Scholar]
- Ponnekanti H, Ophir J, Huang Y, Cespedes I. Fundamental mechanical limitations on the visualization of elasticity contrast in elastography. Ultrasound in Medicine & Biology. 1995;21:533–43. doi: 10.1016/0301-5629(94)00136-2. [DOI] [PubMed] [Google Scholar]
- Rogowitz BE, Treinish LA. Why Should Engineers and Scientists Be Worried About Color? Yorktown Heights, NY: IBM Thomas J. Watson Research Center; 2005. [Google Scholar]
- Rosenthal DI, Hornicek FJ, Wolfe MW, Jennings LC, Gebhardt MC, Mankin HJ. Percutaneous radiofrequency coagulation of osteoid osteoma compared with operative treatment. J Bone Joint Surg Am. 1998;80:815–21. doi: 10.2106/00004623-199806000-00005. [DOI] [PubMed] [Google Scholar]
- Sato M, Watanabe Y, Ueda S, Iseki S, Abe Y, Sato N, Kimura S, Okubo K, Onji M. Microwave coagulation therapy for hepatocellular carcinoma. Gastroenterology. 1996;110:1507–14. doi: 10.1053/gast.1996.v110.pm8613057. [DOI] [PubMed] [Google Scholar]
- Siperstein AE, Rogers SJ, Hansen PD, Gitomirsky A. Laparoscopic thermal ablation of hepatic neuroendocrine tumor metastases. Surgery. 1997;122:1147–54. doi: 10.1016/s0039-6060(97)90221-x. discussion 54-5. [DOI] [PubMed] [Google Scholar]
- Solbiati L, Ierace T, Goldberg SN, Sironi S, Livraghi T, Fiocca R, Servadio G, Rizzatto G, Mueller PR, Del Maschio A, Gazelle GS. Percutaneous US-guided radio-frequency tissue ablation of liver metastases: treatment and follow-up in 16 patients. Radiology. 1997;202:195–203. doi: 10.1148/radiology.202.1.8988211. [DOI] [PubMed] [Google Scholar]
- Solbiati L, Ierace T, Tonolini M, Cova L. Guidance and monitoring of radiofrequency liver tumor ablation with contrast-enhanced ultrasound. European journal of radiology. 2004;51:S19–S23. doi: 10.1016/j.ejrad.2004.03.035. [DOI] [PubMed] [Google Scholar]
- Song X, Pogue BW, Jiang S, Doyley MM, Dehghani H, Tosteson TD, Paulsen KD. Automated region detection based on the contrast-to-noise ratio in near-infrared tomography. Appl Opt. 2004;43:1053–62. doi: 10.1364/ao.43.001053. [DOI] [PubMed] [Google Scholar]
- Stern JM, Merritt ME, Zeltser I, Raman JD, Cadeddu JA. Phase One Pilot Study Using Magnetic Resonance Spectroscopy to Predict the Histology of Radiofrequency-Ablated Renal Tissue. Eur Urol. 2008 doi: 10.1016/j.eururo.2008.03.106. [DOI] [PubMed] [Google Scholar]
- Varghese T, Bilgen M, Ophir J. Phase aberration effects in elastography. Ultrasound in Medicine & Biology. 2001;27:819–27. doi: 10.1016/s0301-5629(01)00379-9. [DOI] [PubMed] [Google Scholar]
- Varghese T, Zagzebski JA, Lee FT., Jr Elastographic imaging of thermal lesions in the liver in vivo following radiofrequency ablation: preliminary results. Ultrasound in Medicine & Biology. 2002;28:1467–73. doi: 10.1016/s0301-5629(02)00656-7. [DOI] [PubMed] [Google Scholar]
- Vogel CR. Computational methods for inverse problems. Philadelphia: Society for Industrial and Applied Mathematics; 2002. [Google Scholar]
- Wacker FK, Nour SG, Eisenberg R, Duerk JL, Lewin JS. MRI-guided radiofrequency thermal ablation of normal lung tissue: in vivo study in a rabbit model. AJR Am J Roentgenol. 2004;183:599–603. doi: 10.2214/ajr.183.3.1830599. [DOI] [PubMed] [Google Scholar]
- Weidensteiner C, Quesson B, Caire-Gana B, Kerioui N, Rullier A, Trillaud H, Moonen CT. Real-time MR temperature mapping of rabbit liver in vivo during thermal ablation. Magn Reson Med. 2003;50:322–30. doi: 10.1002/mrm.10521. [DOI] [PubMed] [Google Scholar]
- White DC, D'Amico TA. Radiofrequency ablation for primary lung cancer and pulmonary metastases. Clin Lung Cancer. 2008;9:16–23. doi: 10.3816/CLC.2008.n.003. [DOI] [PubMed] [Google Scholar]
- Wolf FJ, Grand DJ, Machan JT, Dipetrillo TA, Mayo-Smith WW, Dupuy DE. Microwave ablation of lung malignancies: effectiveness, CT findings, and safety in 50 patients. Radiology. 2008;247:871–9. doi: 10.1148/radiol.2473070996. [DOI] [PubMed] [Google Scholar]
- Yeh WC, Li PC, Jeng YM, Hsu HC, Kuo PL, Li ML, Yang PM, Lee PH. Elastic modulus measurements of human liver and correlation with pathology. Ultrasound in Medicine & Biology. 2002;28:467–74. doi: 10.1016/s0301-5629(02)00489-1. [DOI] [PubMed] [Google Scholar]
- Zagoria RJ, Traver MA, Werle DM, Perini M, Hayasaka S, Clark PE. Oncologic efficacy of CT-guided percutaneous radiofrequency ablation of renal cell carcinomas. AJR Am J Roentgenol. 2007;189:429–36. doi: 10.2214/AJR.07.2258. [DOI] [PubMed] [Google Scholar]
- Zhang M, Castaneda B, Christensen J, Saad W, Bylund B, Hoyt K, Strang JG, Rubens DJ, Parker KJ. Real-time sonoelastography of hepatic thermal lesions in a swine model. Medical Physics. 2008;35:4132. doi: 10.1118/1.2968939. [DOI] [PMC free article] [PubMed] [Google Scholar]
- Zhu Y, Hall TJ, Jiang J. A finite-element approach for Young's modulus reconstruction. IEEE Transactions on Medical Imaging. 2003;22:890–901. doi: 10.1109/TMI.2003.815065. [DOI] [PubMed] [Google Scholar]
Associated Data
This section collects any data citations, data availability statements, or supplementary materials included in this article.