Abstract
Accurate cortical thickness estimation is important for the study of many neurodegenerative diseases. Many approaches have been previously proposed, which can be broadly categorised as mesh-based and voxel-based. While the mesh-based approaches can potentially achieve subvoxel resolution, they usually lack the computational efficiency needed for clinical applications and large database studies. In contrast, voxel-based approaches, are computationally efficient, but lack accuracy. The aim of this paper is to propose a novel voxel-based method based upon the Laplacian definition of thickness that is both accurate and computationally efficient. A framework was developed to estimate and integrate the partial volume information within the thickness estimation process. Firstly, in a Lagrangian step, the boundaries are initialized using the partial volume information. Subsequently, in an Eulerian step, a pair of partial differential equations are solved on the remaining voxels to finally compute the thickness. Using partial volume information significantly improved the accuracy of the thickness estimation on synthetic phantoms, and improved reproducibility on real data. Significant differences in the hippocampus and temporal lobe between healthy controls (NC), mild cognitive impaired (MCI) and Alzheimer’s disease (AD) patients were found on clinical data from the ADNI database. We compared our method in terms of precision, computational speed and statistical power against the Eulerian approach. With a slight increase in computation time, accuracy and precision were greatly improved. Power analysis demonstrated the ability of our method to yield statistically significant results when comparing AD and NC. Overall, with our method the number of samples is reduced by 25% to find significant differences between the two groups.
Keywords: Cortical thickness estimation, Partial volume classification, Power analysis, Mild cognitive impairment, Alzheimer’s disease
1. Introduction
The measurement of cortical thickness from 3D magnetic resonance (MR) images can be used to aid diagnosis or perform longitudinal studies of a wide variety of neurodegenerative diseases, such as Alzheimer’s. Manual measurements are labour intensive and have a high variability. Accurate and automated software that maps the three dimensional cortical thickness of the entire brain is thus desirable.
The approaches used for cortical thickness estimation in the literature can be broadly categorised as mesh-based and voxel-based. One common aspect of these techniques is the need for an initial classification of the different brain tissue type, namely gray matter (GM), white matter (WM) and cerebrospinal fluid (CSF). Automatic classification and cortical thickness measurement from MR images are affected by artifacts such as intensity inhomogeneity, noise, and partial volume (PV) effect. PV introduces considerable errors in the measure due to the finite resolution of MR images (~1 mm) compared to the size of the cortical structures (~2–3 mm). Typically, two sulci banks in contact within a voxel may appear connected if the CSF is not detected within the GM. This results in erroneously high thickness estimates or topologically wrong surfaces of the brain.
Mesh based approaches use a deformable mesh to extract the inner and outer boundaries of the cortex before measuring thickness. Deformable model techniques fit closed parametric surfaces to the boundaries between regions (Pham et al., 2000), such as the inner (GM/WM) and outer (GM/CSF) boundaries of the cortex. The main advantage of deformable model is the smoothness constraint, which provides robustness to noise and false edges. They are also capable of operating in the continuous spatial domain and therefore achieving subvoxel resolution. However, deformable model are complex, incorporating methods to prevent self-intersection of surfaces or topology correction. Another disadvantage of some of these approaches is the need for manual interaction to initialize the model and to choose appropriate parameters. Some implementations impose thickness constraints on the cortex (Zeng et al., 1999; MacDonald et al., 2000) in order to model sulci. Fischl and Dale (2000) imposed a self-intersection constraint, forcing the surface to meet in the middle of sulci. A detailed comparison of three well established methods, CLASP (Kim et al., 2005), BrainVISA (Mangin et al., 1995), Freesurfer (Dale et al., 1999; Fischl and Dale, 2000) is presented in Lee et al. (2006). To our knowledge, CLASP (Kim et al., 2005) is the only approach to explicitly model the partial volume effect to fit the deformable mesh. It is however computationally intensive, with typical running time of over 20 h on a standard PC, as reported in Lee et al. (2006).
In contrast, voxel-based techniques (Hutton et al., 2008; Diep et al., 2007; Lohmann et al., 2003; Srivastava et al., 2003; Hutton et al., 2002) operate directly on the 3D voxel grid of the image, and are therefore more computationally efficient. Those methods are however less robust to noise and mis-segmentation as they typically lack the mechanisms required to assess and correct topological errors. They are also hampered by the MR limited resolution, in small and highly convoluted structures such as the GM sulci, where partial volume effects are preponderant.
Cortical thickness can be estimated using several metrics. The definition of thickness based on Laplace’s equation simulating the laminar structure of the cortex, first introduced by Jones et al. (2000), has gained wide acceptance. Haidar and Soul (2006) showed that the Laplacian approach is the most robust definition of thickness, compared to nearest neighbour and orthogonal projections, with respect to variations in MR acquisition parameters. Lerch and Evans (2005) performed cortical surface reconstruction and compared six cortical thickness metrics. They found that the coupled surfaces method was the most reproducible, followed by the Laplacian definition. However, the coupled surface method is highly dependant on the scheme used to construct the surface.
Whereas Jones et al. (2000) explicitly traced streamlines (Lagrangian approach), Yezzi and Prince (2003) proposed a more efficient method that involves solving a pair of first order linear partial differential equations (PDEs) without any explicit construction of correspondences (Eulerian approach). The major drawback of the Eulerian approach is the limited accuracy when estimating thickness, especially within thin structures since it is solved over a discrete grid. The initialization of the PDEs affects the accuracy, when the distance to the real boundary is not explicitly computed ignoring the PV effect. A hybrid Eulerian–Lagrangian approach was proposed by Rocha et al. (2007) to improve accuracy while preserving efficiency, but for subvoxel initialization at tissue boundaries a precomputed surface was required. For clinical applications, precision is of upmost importance. For example, the expected change in GM thickness during the early stages of Alzheimer’s disease has been shown to be less than 1mm in most brain regions (Lerch et al., 2005; Singh et al., 2006).
Building upon Yezzi and Prince (2003), we have improved the precision of the voxel-based thickness measurement by taking into account the PV coefficients at the GM boundaries to appropriately initialize the PDEs without previous upsampling and interpolation of the images. Our scheme can be considered as a combined Lagrangian–Eulerian approach: the boundaries are initialized with an explicit integration along the streamlines achieving subvoxel accuracy, and for the remaining grid points two PDEs are solved as in the Eulerian approach, preserving the computational efficiency. Unlike Rocha et al. (2007), the detection of the boundaries is performed within the gray matter partial volume map, without previous delineation of the surface. Rocha et al. (2007) additionally proposed the correction for divergent streamlines in thick and irregular structures, introducing a distance tolerance (λ). In cortical thickness this is unlikely to occur as the GM, which is a few mm thick, spans one or two voxels (for a typical full brain MR resolution in a clinical setting: 1 mm × 1mm × 1.2 mm).
In the remainder of this paper, we first describe the method. We then validate the accuracy of our approach on synthetic data, and its reproducibility on real MR data. In the final section, we apply our cortical thickness estimation approach to a subset of the ADNI database, including 43 healthy elderly individuals or normal controls (NC), 53 mild cognitive impaired (MCI) and 22 Alzheimer’s disease patients (AD). We compared our method against the Eulerian approach of Yezzi and Prince (2003). The ability of our method to reach higher power when comparing two groups was demonstrated, with good computational efficiency (30 min in average on a standard PC).
2. Methods
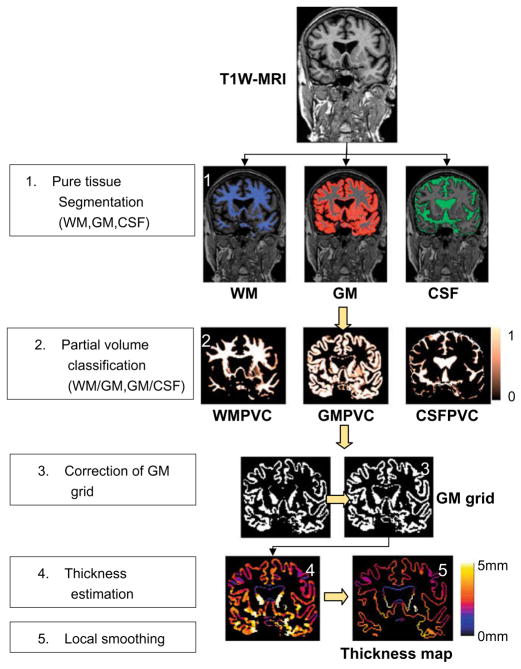
The proposed method consists of several stages as depicted in Fig. 1: firstly, 3D T1-weighted MR images are classified into GM, WM and CSF in their original space using a priori probability maps registered with an affine followed by non-rigid registration (Section 2.1). Secondly, the fractional content of GM for the voxels along tissue interfaces is computed by modelling mixture of tissues and performing a maximum a posteriori classification (Section 2.2), which results in a GM partial volume coefficients (GMPVC) map. In a further step, a continuous GM layer covering the WM is obtained (Section 2.3). Then, the thickness is computed with accurate initialization of the PDEs (Section 2.4). Finally, regional statistical analysis is performed using the automated anatomical labelling (AAL) after extraction and smoothing of the cortical thickness map projected along the WM/GM boundary (Section 2.5).
Fig. 1.
Overall process for cortical thickness estimation.
2.1. Pure tissue segmentation
Based on the previously proposed expectation maximisation segmentation (EMS) algorithm (Van Leemput et al., 1999a; Van Leemput et al., 1999b), we have implemented a method for the segmentation of brain tissues (GM, WM and CSF), which includes a fourth order 3D polynomial-based bias field model and a Markov Random Field (MRF) to improve spatial coherence, reducing the effects of noise. The probability density functions of the tissues are modelled with six Gaussian functions (one for each of the main three tissue types, and three for non-brain tissues including skull and background). Colin atlas is first affinely registered to the data using a robust block matching approach (Ourselin et al., 2001), followed by a free form non-rigid registration (NRR) (Rueckert et al., 1999) seeking to maximise normalised mutual information (Studholme et al., 1998). Probabilistic tissue maps associated with the atlas were used to initialize and guide the segmentation. NRR control points were restricted to 20 mm spacing to reduce computation time while achieving excellent matching. Smooth deformation fields were obtained in less than 6 min on a standard PC.
The resulting output probability maps (soft classifications) for each class are discretised by assigning each voxel to its most likely tissue type. Hard segmentations (Fig. 2b) and bias field corrected images are used as an input for the partial volume estimation.
Fig. 2.
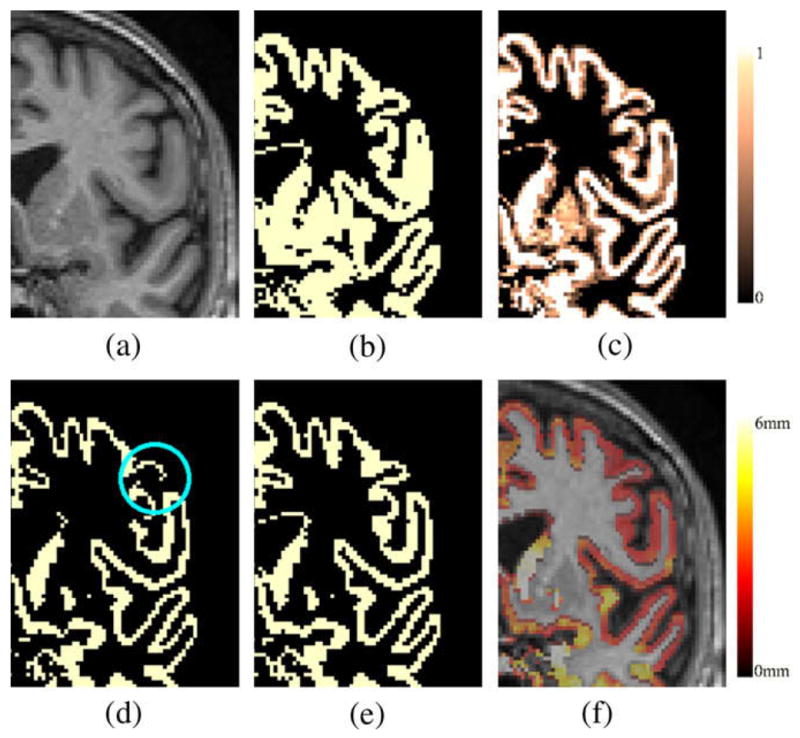
(a) MR T1W image. (b) Initial GM hard segmentation from EMS. (c) Computed GMPVC map. (d) GM pure tissue voxels (GMPVC = 1). The lost of continuity in the GM is highlighted. (e) Continuity corrected GM grid. (f) Overlaid of resulting thickness map and original MR image.
2.2. Partial volume classification
In this step, partial volume (PV) along tissue interfaces is estimated by modelling mixtures of pure tissues and performing a maximum a posteriori (MAP) classification. We adopted a two-stage procedure relying on both intensity and spatial interaction similar to the one presented by Shattuck et al. (2001) and Tohka et al. (2004). This scheme has been optimised to compute eventually a single map containing the fractional content of GM using the hard segmentations and bias corrected images obtained after the EMS algorithm. Since voxels containing partial volume are mostly present along boundaries, PV evaluation is restricted to the region formed by a dilated GM grid (radius 4).
In our implementation only three pure classes (GM, WM and CSF) and two mixture classes (GM/CSF and GM/WM) are considered. Although there are some other possible combinations, they are not taken into account as they are unlikely to occur (e.g. CSF/WM or CSF/GM/WM) or they are not relevant (e.g. CSF-background). The labels are thus restricted to the set Γ = {GM, CSF, WM, GM/CSF, GM/WM}. Pure voxels are assumed to have a Gaussian probability density function, defined by its mean (μ) and standard deviation (σ). These values μ and σ are computed over the bias field corrected MR image using the hard segmentations obtained in the previous segmentation step. Mixed voxels, containing at most two tissues, are modelled with a probability density function which uses weighted sums of Gaussians over all the possible values of PV as proposed by Santago and Gage (1993). The labelling is performed with a Potts model as in Shattuck et al. (2001) and solved with the Iterative Condition Modes (ICM) algorithm (Besag, 1986). This model encourages configurations of voxels that are likely to occur such as GM/CSF or GM/WM voxels adjacent to GM, and guarantees spatial coherence of pure tissue segmentations WM, GM and CSF.
Once voxels have been labelled using Γ, we compute for each voxel the portion of pure tissue, called here fractional content, which ranges between [0, 1]. The fractional content Fj of voxels classified as pure tissue are set to 1 for the class j and 0 otherwise. For voxels classified as mixed, their fractional content Fj/k between both pure tissues j and k is computed as in Shattuck et al. (2001), using the bias corrected intensity x̃i and the means μj and μk of the two pure tissue types obtained in the previous step as:
| (1) |
where U(·) is a limiter restricting the range of the fractional content to [0,1]. The final partial volume coefficients (PVC) map of GM used for cortical thickness estimation is then obtained as GMPVC = FGM/WM ∪ FGM ∪ FGM/CSF. Likewise, a GM grid is constituted with only those voxels classified as pure GM tissue FGM. Fig. 2c and d shows an example of computed GMPVC map and GM grid.
2.3. Correction of 3D GM grid
It is assumed that the GM is a continuous layer of neurons covering the WM surface. To compute a reliable GM thickness, a continuous domain (GM grid) is required where the PDEs can be solved. Because in very thin regions (less than one voxel thick), the partial volume classification step may introduce some gaps, a further correction of the GM grid, obtained in Section 2.2, is required to enforce continuity. This is achieved by re-labelling any voxel at the interface WM/CSF to GM. We implemented an algorithm which checks whether in the 3 × 3 × 3 neighbourhood of each WM boundary voxels there is any CSF voxel breaking the GM/WM continuity, in which case it is reclassified as GM. Fig. 2e depicts in an example the result of this reclassification at the GM boundary after the pure tissue voxels (Fig. 2d) are selected. This does not affect the measure of thickness as the algorithm relies afterwards on the partial volume information, but it allows a reliable computation of laplace’s equation, and subsequent distance functions as described in Section 2.4.
Restricting the GM mask to only pure tissue voxels provides a good delineation of deep sulci as illustrated in Fig. 2d and e compared to the initial GM segmentation shown in Fig. 2b. Furthermore, correcting for the WM/CSF gaps allows us to measure thin GM zones, even when they span less than one voxel. The deep gray matter and GM detected around the ventricles is not taken into account for thickness estimation purposes.
2.4. Thickness estimation
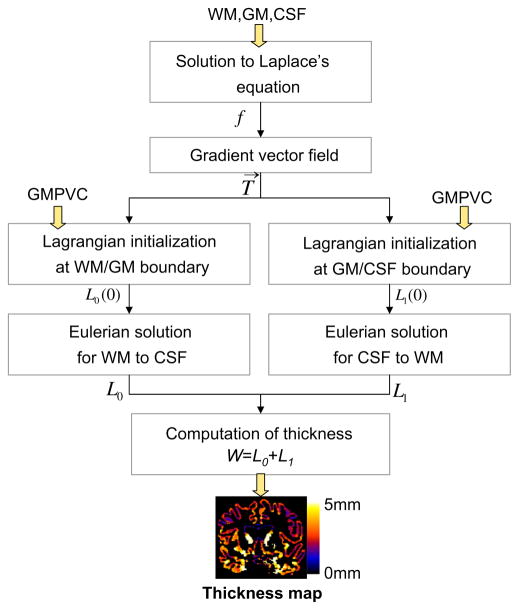
Once pure tissue segmentation and partial tissue classification are performed, the thickness of the resulting GM is afterwards computed following Jones’s definition (Jones et al., 2000) as shown in Appendix A, but here in a combined Lagrangian–Eulerian approach. The reader should refer to Appendix A for the notation. Fig. 3 illustrates the different steps yielding to a GM thickness map. The Laplace’s equation ∇2f(x) = 0 is first solved within the corrected GM grid obtained in Section 2.3. Then, a normalised gradient vector field T→ of f(x) is computed as , which provides several paths, or streamlines, guaranteeing a unique correspondence between WM and CSF. The thickness is therefore the distance between WM and CSF along these paths, but projecting them outwards into the GMPVC map to detect the real boundaries. This is done by solving the Eulerian PDEs for the distances L0 and L1 within the discrete GM grid, as in Yezzi and Prince (2003), but after a Lagrangian initialization using the GMPVC map.
Fig. 3.
Combined Lagrangian–Eulerian thickness estimation.
To detect the real boundary without any resampling, for each GM voxel sharing a boundary with one or more mixed voxel GM/CSF (or GM/WM) we follow the streamline, in a ray casting scheme, from the GM in the direction of T→ (−T→, respectively). Assuming that the point spread function is a boxcar, the boundary is the point where the GM partial volume coefficient equals the CSF (WM, respectively) partial volume coefficient. The implementation is based on a dichotomy search restricted in one direction, with decreasing stepsize down to ε = 1/10−3 of the voxel size.
Fig. 4 illustrates the idea of the initialization in a 1D model of voxels shared by two tissues A and B. Assuming the PVC map is known, a simple model for the combined signal is the summed fractional signals of tissues A and B. Let hx be the voxel size, α < 1 the fraction of voxel i occupied by tissue A and APVC the discrete PVC map for the tissue A. Because the PV is represented at the centre of the voxels, the boundary between A and B (between voxels i − 1 and i) is the point (x0) where the interpolated PVC is equal to 0.5, resulting in a measured size of the tissue A as hx + αhx. The boundary point (x0), can be detected with a ray cast from the centre of the voxel i − 1 (tissue A) towards the mixed voxel i.
Fig. 4.
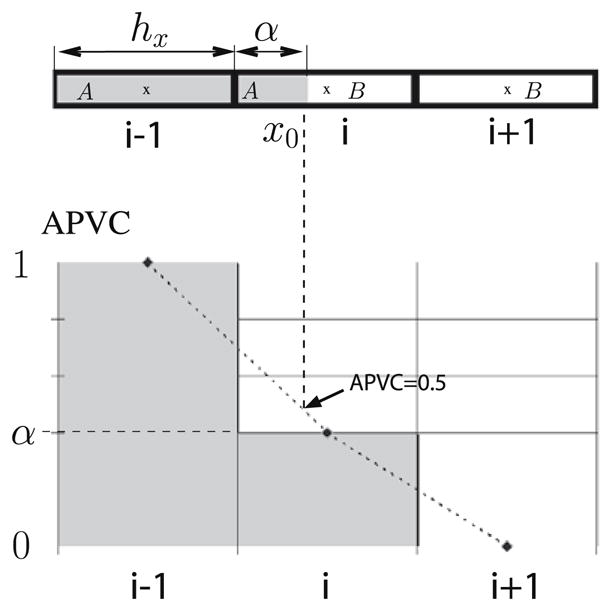
Unidimensional model of a voxel occupied by two pure tissues A and B. Top: Voxel i − 1 contains only tissue A, voxel i contains both A and B and voxel i + 1 contains only tissue B. Bottom: PVC representation for the tissue A. The boundary (x0) of A is found by linear interpolation at APVC = 0.5.
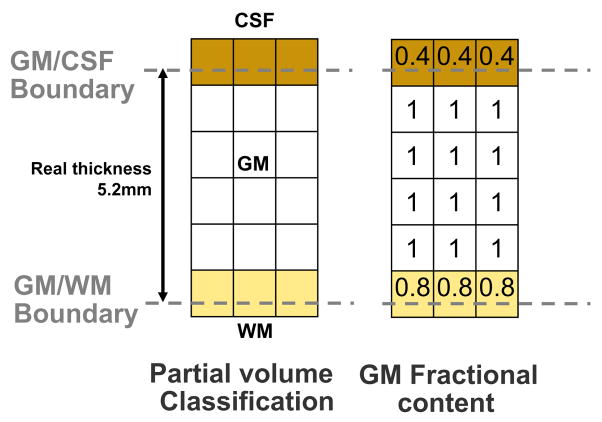
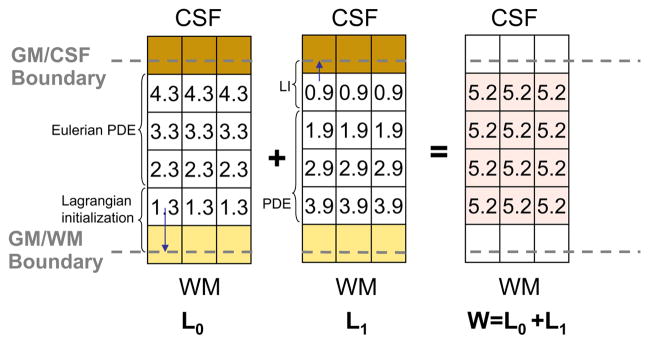
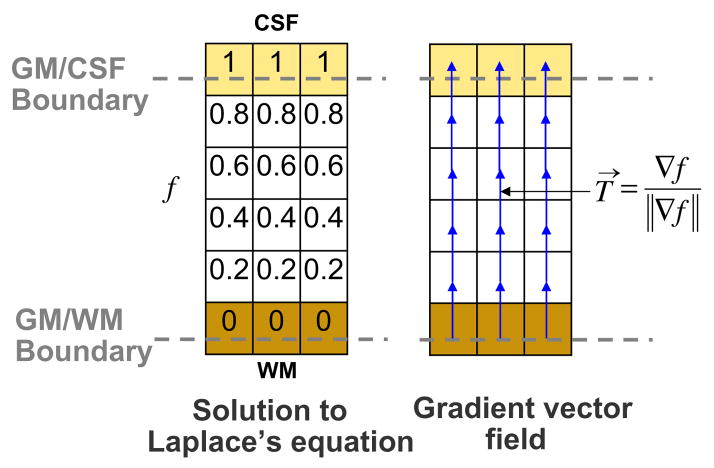
Figs. 5–7 shows un example of thickness computation of a 5.2 voxels thick structure (mimicking GM) in a regular grid. The spatial sampling of the structure leads to its representation in both pure and partial volumed voxels. To achieve an accurate measure, voxels being shared by two pure tissues are tagged within the corresponding GMPVC map before computing their fractional content. In this example, the fractional content of GM at the CSF boundary is 0.4 and the fractional content of GM at the WM boundary is 0.8. Afterward, with the boundary conditions fixed at the WM and CSF interfaces (0 and 1, respectively), Laplace’s equation is solved within the pure tissue voxels and the gradient vector field is obtained defining the streamlines between the WM and the CSF (Fig. 6). The gradient vector field is regularised with a Gaussian convolution (typically σ = 1 to reduce discretisation effects). Subsequently, the Eulerian PDEs are solved within the GM grid after a Lagrangian initialization at the boundaries (Fig. 7). Finally, the expected thickness of 5.2 voxels is computed as W= L0 + L1.
Fig. 5.
Example of an isotropic 5.2 voxels thick structure (GM), represented in pure and mixed tissue voxels. If only pure tissue voxels were considered the resulting thickness would be 4.
Fig. 7.
Computation of thickness. After initialization of distance functions L0 in the GM/WM interface, and L1 in the GM/CSF interface with the GM fractional content, the PDEs are solved for the remaining voxels. The thickness is computed as expected and the values are updated only in the GM grid.
Fig. 6.
Solution to Laplace’s equation and computation of gradient vector field within the GM grid.
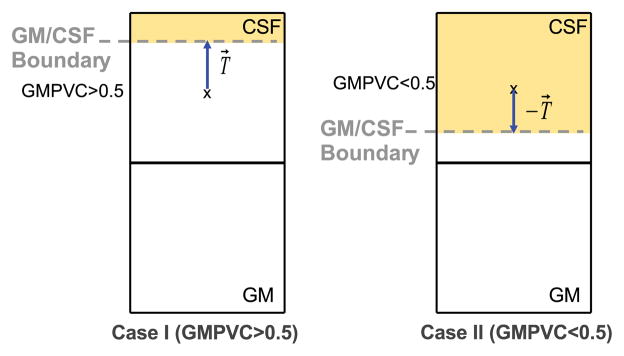
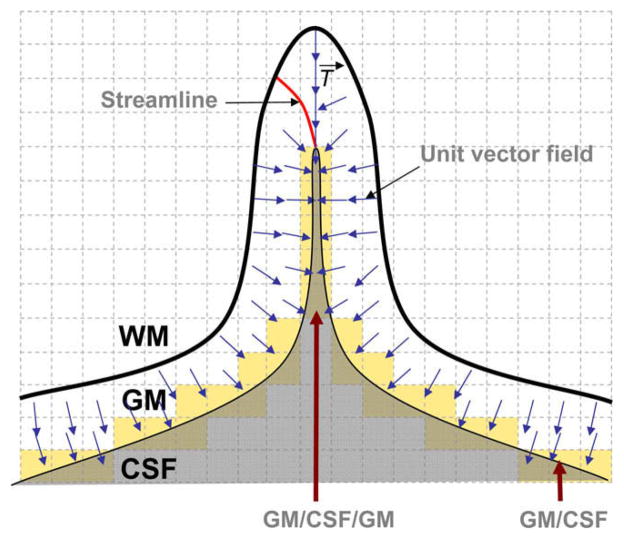
Because of the thin and convoluted structure of the brain, special care is taken for two configurations of partial volumed voxels. Firstly, when GM voxels appear with low GMPVC values in thin regions, as depicted in Fig. 8; Secondly, in deep sulci where mixed GM/CSF voxels appear surrounded by GM in opposite directions as depicted in Fig. 9. On one hand, in very thin structures after the correction of the 3D GM grid, it might occur that for a given voxel x within the GM grid at the boundary, the computed GMPVC (x) < 0.5. In that case, the direction of the ray cast must be reversed towards the actual position of the boundary supposedly inwards. This means, for instance, that for a GM voxel lying on the GM/CSF boundary and whose fractional content is lower than 0.5, the ray r follows the streamline in the direction of −T→(opposite signs) as shown in Fig. 8. On the other hand, in deep sulci it is common to find mixed GM/CSF voxels surrounded by GM in opposite directions as depicted in Fig. 9. When the fractional content of GM is computed it might not reflect the actual geometry of the structure, leading to overestimated thickness if the ray casting approach is used. Because of the spatial sampling, those voxels are indeed a mixture of GM/CSF/GM. They are therefore split into two mixed voxels (GM/CSF and CSF/GM) and their PVC is redistributed consequently according to the magnitude of the projection of the 3D unit vector field T→ over the rectangular grid.
Fig. 8.
Depending on the computed GMPVC for a given GM voxel x, two cases of boundary detection are considered. When GMPVC > 0.5 the ray r follows the direction of the unit vector field. The opposite when GMPVC < 0.5 as the boundary has to be supposed inwards with respect to the centre of the voxel x.
Fig. 9.
Partial volumed voxels in deep sulci are composed of a mixture GM/CSF/GM (GM in opposite directions) which can be reapportioned in mixtures GM/CSF and CSF/GM.
2.5. Smoothing of cortical thickness maps and region-based analysis
Finally, when studying regional population changes, each individual cortical thickness map is smoothed using the interquartile mean (IQM) within a 5 mm radius sphere within the GM. Thus, the effects of discontinuities is reduced. Smoothing is currently applied in many other methods when comparing populations and assessing brain significant changes (Lerch et al., 2005; Hutton et al., 2008). To overcome variability of the cortical folding, our smoothing is performed on the WM/GM boundary, and restricted to the connected components of the GM mask inscribed within the sphere and thus respecting anatomical boundaries (Fig. 10). After thickness estimation and smoothing, the automated anatomical labelling (AAL) template (Tzourio-Mazoyer et al., 2002) is mapped to the patient, using the deformation field previously computed, resulting in a list of mean thickness per region to be used for interindividual comparisons, as shown further in this paper.
Fig. 10.
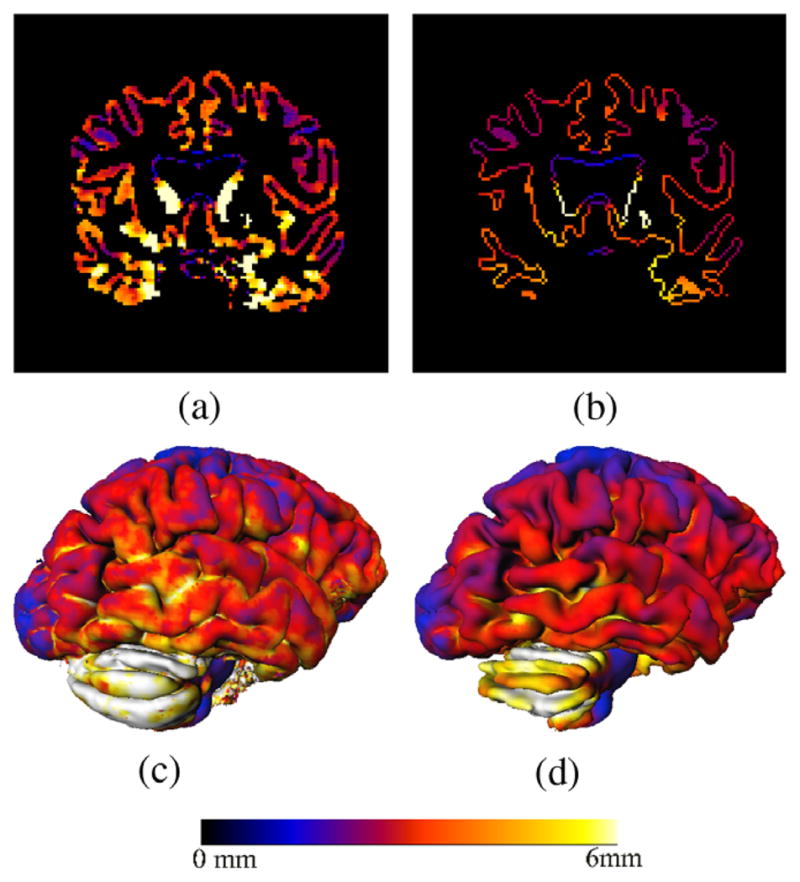
Example of cortical smoothing. (a) Computed cortical thickness map. (b) Smooth map of GM/WM surface using a 5 mm radius sphere over the connected components. (c and d) Marching cubes rendering of voxel maps (a) and (b), respectively.
3. Experiments and results
This section describes the experiments performed to evaluate the proposed method. Our approach was to validate each step separately on both phantoms and real data, then test the reproducibility on the overall technique and, finally, show the results of a study on clinical data. We also compared the performance of our method with the Eulerian implementation as proposed by Yezzi and Prince (2003) ignoring the PV. All the algorithms were implemented in C++, using the open source ITK libraries. Tests were performed on a Dual Core 2.4 GHz computer running linux.
3.1. Fractional content and PV validation
To evaluate the accuracy of the fractional content computation and PV labelling, experiments were performed on BrainWeb simulated data set (Kwan et al., 1996; Collins et al., 1998). The images had an isotropic voxel resolution of 1 mm3 and varying degrees of noise and intensity inhomogeneity. The resulting PV maps were compared with the ground truth fractional volumes using the root mean square error (RMS).
The low RMS error (Table 1) demonstrates that most of the partial voluming occurs along tissue boundaries validating the PV labelling assumption. A higher RMS error for CSF is attributed to the fact that the mixture between CSF and background is not considered by our model. Fig. 11 shows an example of partial volume classification on a BrainWeb simulated image (noise 3%, bias field 20%), compared to the ground truth.
Table 1.
Average RMS error per level of noise of the fractional content of PV voxels.
| Noise 1% | Noise 3% | Noise 5% | Noise 7% | Noise 9% | |
|---|---|---|---|---|---|
| GM | 0.17 | 0.08 | 0.07 | 0.08 | 0.10 |
| WM | 0.02 | 0.01 | 0.02 | 0.05 | 0.09 |
| CSF | 0.27 | 0.28 | 0.31 | 0.33 | 0.35 |
Fig. 11.
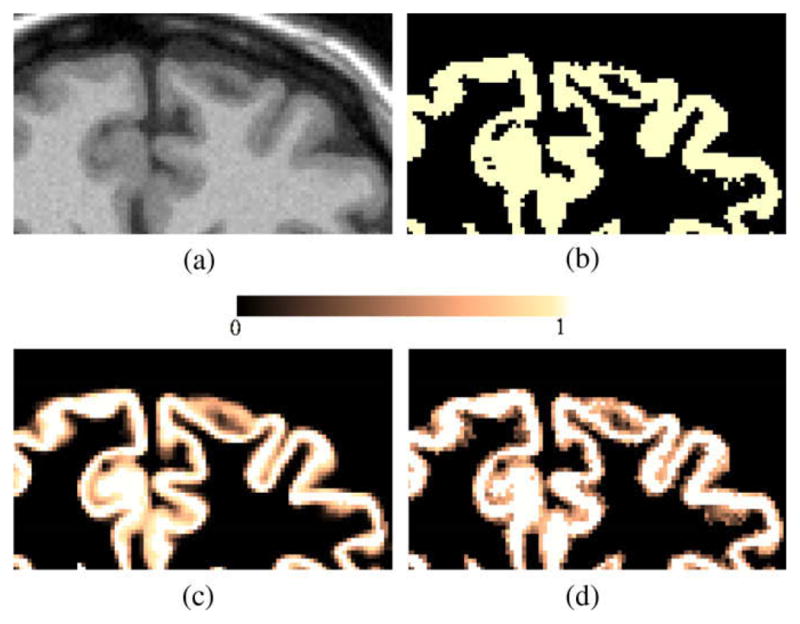
Example of partial volume classification on simulated MR data: (a) Initial MR T1 weighted Image (noise 3%, bias field 20%), (b) Hard GM segmentation obtained with EMS algorithm, (c) Ground truth PV map, and (d) Computed GMPVC map.
3.2. Accuracy of the thickness measurement over phantoms
To determine the accuracy of the thickness measurement using PV estimation, experiments over synthetic spherical shells with constant thickness and a spiky shell, mimicking cortical folds, were performed. To simulate the partial voluming occurring at the boundary of a real object when discretised, the binary phantoms were first generated on a high resolution grid (N × N × N, with N = 1100) with 0.1 mm3 spacing and resampled to a lower resolution similar to actual MR. The value of each voxel was defined by the percentage of non-zero voxels within the region covered by this voxel on the original grid.
3.2.1. Spherical shell
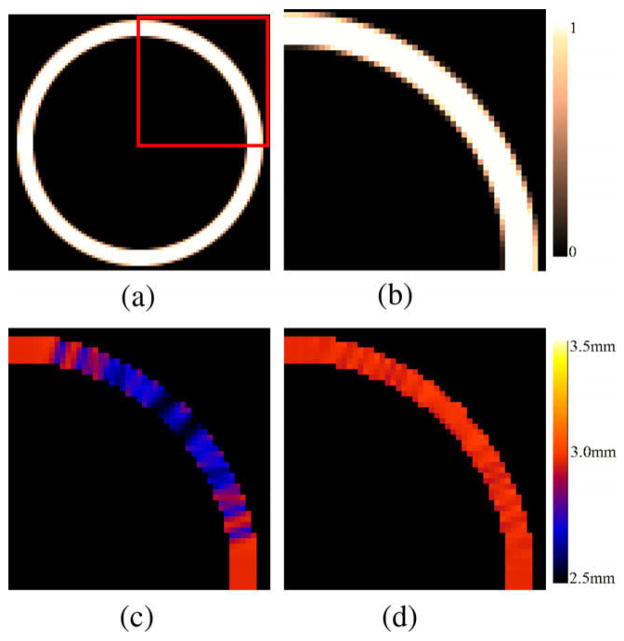
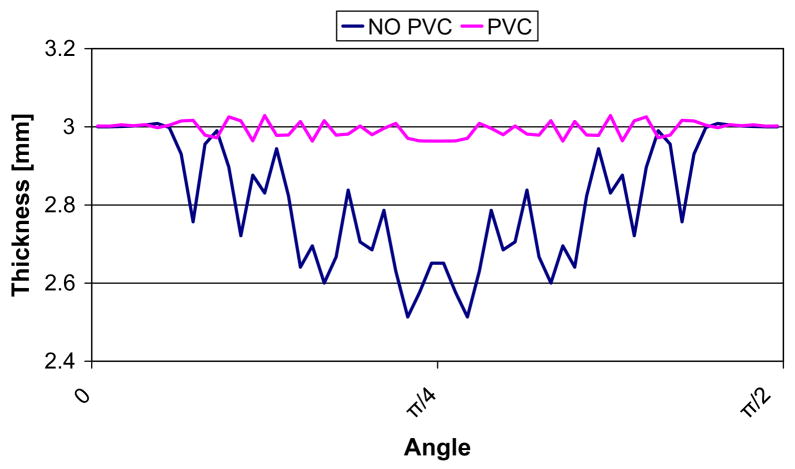
A hollow sphere with inner radius r = 20 mm and external radius R = 23 mm was constructed to define a size and thickness similar to the ones of the brain cortex. Fig. 12 depicts an example of simulated PVC map for an isotropic 0.5 mm sphere and the computed thickness differences when the PVC is taken into account. Fig. 13 shows the computed thickness around the sphere (angles between 0 and π/2) at a single slice with and without PVC. The results of thickness estimation for different resolution spheres is shown in Table 2. A further comparison was performed taking into account voxels PVC > 0.5. The results showed that with PVC, accurate measurements can be performed for both isotropic and anisotropic data and that accuracy is proportional to the image resolution. The errors caused by the partial volume effect on the sphere mean thickness were greatly reduced with the use of PVC maps. For a 1 mm3 resolution image the error was reduced from 9.33% to 1.33%. As expected, without the PVC map the thickness measurements were as accurate as with the PVC only along the orthogonal axes of the sphere and when the borders coincide with the spatial sampling, whereas the error was increased in oblique directions. Similar results were found when PVC map was thresholded to 0.5. In contrast, when the PV map was used and the boundaries were initialized according to the direction of the structure an accurate measurement over the entire sphere was computed. The combined Eulerian–Lagrangian approach used in average 38% more computation time for these examples. The increase was due to the intialization using the ray casting at the boundary. As an example, for the sphere with the largest amount of GM voxels (139429, for the 0.5 mm3) the computation time incremented from 1.585 s to 2.005 s.
Fig. 12.
Example of thickness computation for a 3 mm synthetic hollow sphere (isotropic 0.5 mm spacing). (a and b) PVC map generated from a high resolution sphere. (c) Computed thickness with initialization at negative half of the voxel spacing. (d) Computed thickness with PVC initialization.
Fig. 13.
Comparison of computed thickness for the 0.5 × 0.5 × 0.5 mm sphere. The thickness was measured around the WM/GM surface in the central slice, with angles ranging between 0 and π/2.
Table 2.
Comparison of thickness accuracy for the 3 mm thick spheres. using Yezzi’s approach: (i) without taking into account the PVC (only pure tissue voxels), (ii) taking into account only the voxels whose PVC > 50% and (iii) with our approach using the PVC.
| Resolution | NO PVC map Mean ± SD | PVC>50% Mean ± SD | With PVC map Mean ± SD |
|---|---|---|---|
| 0.5 × 0.5 × 0.5 | 2.86 ± 0.08 | 2.86 ± 0.09 | 3.01 ± 0.01 |
| 0.5 × 0.5 × 1 | 2.80 ± 0.16 | 2.81 ± 0.17 | 3.02 ± 0.02 |
| 1 × 1 × 1 | 2.72 ± 0.17 | 2.74 ± 0.16 | 3.04 ± 0.02 |
| 1 × 1 × 1.5 | 2.68 ± 0.24 | 2.70 ± 0.24 | 3.05 ± 0.08 |
3.2.2. Spiky shell
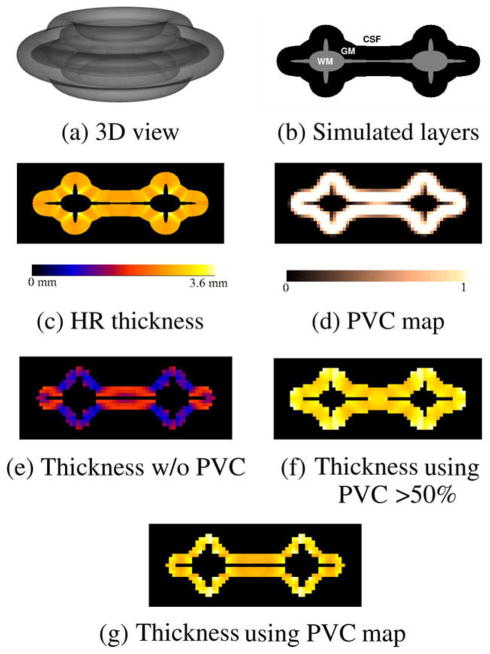
A synthetic phantom consisting of a 3D donut shape with a simulated layer of tissue was constructed. The equivalent of WM was first created in a high resolution 2D binary image (256 × 256) of a circle with four added spikes (mimicking four gyri):
| (2) |
where D is the distance to the centre of the image. The diameter in the vertical direction was set to 70% of the one in the horizontal direction. The binary image was then dilated by a disk of 30 voxels to simulate the equivalent of a GM layer (Fig. 14b). The resulting image was then rotated around its vertical axis to create a donut like shape within a 512 × 512 × 256 volume (Fig. 14a).
Fig. 14.
Thickness computation for the spiky phantom. (a) Semitransparent 3D view. (b) 2D cutplane of simulated WM, GM and CSF layers. (c) Pseudo ground truth: computed thickness at high resolution (HR). (d) PVC map generated by subsampling the original phantom by a factor of 8. Computed low resolution thickness maps (e) without using the PVC (only pure tissue voxels), (f) thickness using the PVC > 50%, (g) thickness using PVC map.
To create a pseudo ground truth, the thickness of the GM layer of the high resolution volume was computed using the Laplacian method (Fig. 14c) and then downsampled by a factor of 8 resulting in a 64 × 64 × 32 volume. The WM, GM and CSF layers were also subsampled, resulting in the PVC maps used for the thickness computation at low resolution. Fig. 14 shows the high resolution phantom, the GMPVC map generated and the estimated thickness.
Thickness computation at low resolution with and without using the PVC were evaluated. The results, presented in Table 3, showed that the thickness estimation with PVC map used for initialization was more stable and accurate in all areas of the phantom. This effect can be appreciated in the central region (thin WM), where most of the voxels are being shared by GM voxels in opposite directions. When the PVC map was thresholded at 50% of GM, the computed thickness was higher.
Table 3.
Comparison of thickness for the synthetic original spherical spiky shell. High resolution phantom (0.1 mm3) and low resolution phantom (0.8 mm3), initializing without and with PVC maps.
| Resolution | Mean(mm) ± SD | Max | Min | |
|---|---|---|---|---|
| Original phantom | 0.1 × 0.1 × 0.1 | 3.14 ± 0.19 | 3.74 | 2.86 |
| Pure tissue | 0.8 × 0.8 × 0.8 | 2.08 ± 0.28 | 2.60 | 1.45 |
| PVC > 50% | 0.8 × 0.8 × 0.8 | 4.07 ± 0.23 | 4.49 | 3.62 |
| With PVC | 0.8 × 0.8 × 0.8 | 3.24 ± 0.19 | 3.90 | 2.98 |
3.3. Experiments and results using real MR data
3.3.1. Patients
Data used in the preparation of this article were obtained from the Alzheimer’s Disease Neuroimaging Initiative (ADNI) database (http://www.loni.ucla.edu/ADNI). The ADNI was launched in 2003 by the National Institute on Aging (NIA), the National Institute of Biomedical Imaging and Bioengineering (NIBIB), the Food and Drug Administration (FDA), private pharmaceutical companies and non-profit organisations, as a $60 million, 5-year public–private partnership. The primary goal of ADNI has been to test whether serial magnetic resonance imaging (MRI), positron emission tomography (PET), other biological markers, and clinical and neuropsychological assessment can be combined to measure the progression of mild cognitive impairment (MCI) and early Alzheimer’s disease (AD). Determination of sensitive and specific markers of very early AD progression is intended to aid researchers and clinicians to develop new treatments and monitor their effectiveness, as well as lessen the time and cost of clinical trials. The Principle Investigator of this initiative is Michael W. Weiner, M.D., VA Medical Center and University of California – San Francisco. ADNI is the result of efforts of many co-investigators from a broad range of academic institutions and private corporations, and subjects have been recruited from over 50 sites across the US and Canada. The initial goal of ADNI was to recruit 800 adults, ages 55–90, to participate in the research – approximately 200 cognitively normal older individuals to be followed for 3 years, 400 people with MCI to be followed for 3 years, and 200 people with early AD to be followed for 2 years. For up-to-date information see http://www.adniinfo.org.
3.3.2. Reproducibility of the thickness measurement
To evaluate the reproducibility of the method, we selected 17 subjects (eight NC, eight MCI and one AD) from the ADNI database, who underwent a baseline and a repeat scans during the same session. Only patients who had the highest quality ratings for both images were kept. All patients were imaged on a 1.5 T scanner with in-plane resolution of 0.94 × 0.94 mm, 1.25 × 1.25 mm and 1.30 × 1.30 mm, and slice thickness of 1.2 mm (Detailed information about MR acquisition procedures is available at the ADNI website www.adni-info.org). All images were corrected for gradient non-linearity distortion, intensity non-uniformity, and were scaled for gradient drift using the phantom data.
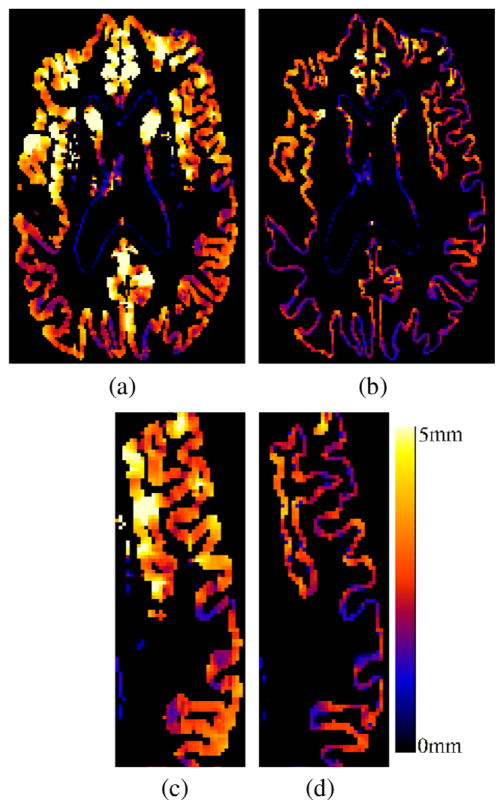
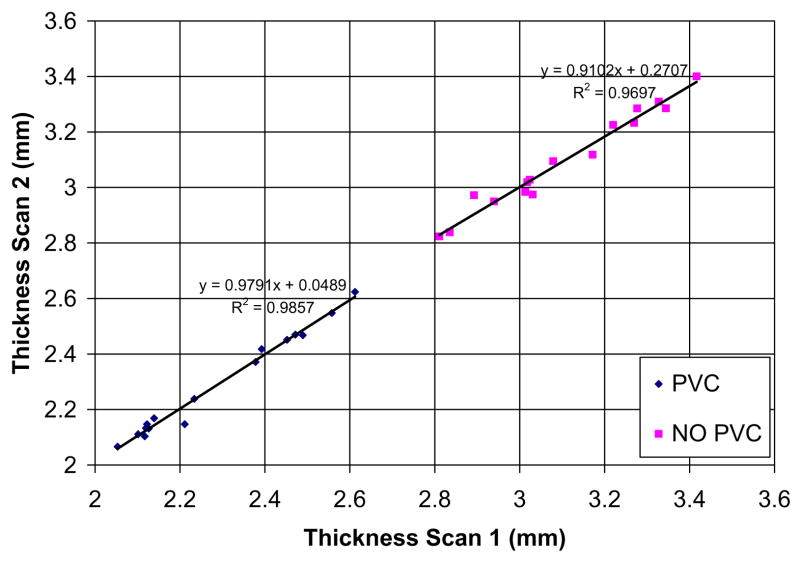
We computed the thickness using the proposed approach and compared the results with the Eulerian approach as proposed by Yezzi (without taking into account partial volume effects). Fig. 15 shows an example of cortical thickness maps computed with the two methods. Fig. 16 shows the differences between the two measures as an average of the cortical thickness in the full brain. If the PV is not taken into account, a mean ± SD(std. dev.) cortical thickness of 3.104 mm ± (0.18) was computed over the whole brain for all the subjects, whereas a value of 2.18 mm ± (0.18) was obtained with the proposed approach.
Fig. 15.
Cortical thickness maps (a and c) without using PVE and (b and d) with the proposed approach. A natural delineation of the sulci is achieved by taking into account the partial volume effect.
Fig. 16.
Comparison of mean cortical thickness of the 17 subjects computed from two different scans and with the two methods: (i) No PVE as in Yezzi’s approach and (ii) proposed method using the PV.
In order to assess the precision of the two methods, the sum of square of differences was computed for each region of the AAL template (Tzourio-Mazoyer et al., 2002). The cerebellum and subcortical nuclei were excluded from the analysis. The average for all the regions was 0.13 with the Eulerian approach and only 0.08 with the proposed method. Besides the tendency of thickness overestimation, higher variability was evident for sulci detection in some regions when the PV was not taken into account as shown in Fig. 15. Indeed, because of the spatial sampling, the sulci may be well delineated from one of the acquisitions and mis-detected from the other, detrimental to the reproducibility.
3.3.3. Computational performance
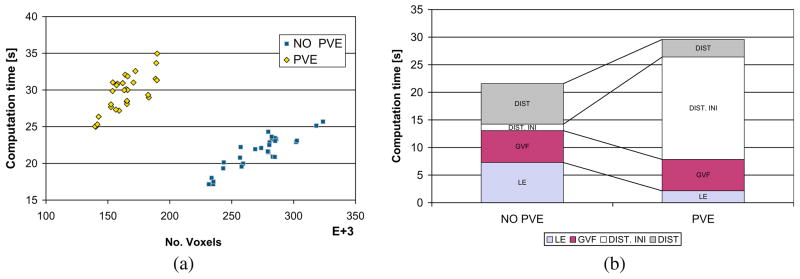
On real 3D MR data (166 × 256 × 256 voxels) the entire procedure to compute the cortical thickness took in average 30 min over the 17 individuals from ADNI. Most of the time was spent on the initial pure tissue classification (9 min in average + 6 min registration) and in the partial volume labelling (10 min in average). This step is computationally expensive because of the multiple neighbourhood iterations in the ICM for the MAP classification. Once the WM, GM, CSF and GMPVC are available, the computation time for cortical thickness estimation slightly differs between the Eulerian and the proposed combined Lagrangian–Eulerian approach. Fig. 17a shows the differences in number of voxels against computation time for both approaches. The Eulerian approach is slightly faster, but the number of voxels of the GM grid increased because the partial volumed voxels were included in the computation. In the proposed approach, the size of the GM grid was reduced by 40% (272,535–163,954 in average), resulting in a smaller domain where the PDEs are solved. Thus, Laplace’s equation and the distance equations with the current implementation are computed in less time. In average 7.2 s vs. 2.1 s for the Laplace equation and 21.7 s vs. 8.5 s for the distances. This difference compensates for the relatively expensive computation of the boundaries with the Lagrangian initialization when the PVE is taken into account (18.5 s in average). Fig. 17b depicts the computation time for the different steps constituting the cortical estimation part. (Solution to Laplace’s equation, Computation of Gradient Vector Field, Distances Initialization at the boundaries and Solution to Distance equations.)
Fig. 17.
Comparison in computation time, for the cortical thickness estimation part, between the two approaches on real MR data: Eulerian (NO PVE) and Combined Lagrangian–Eulerian (PVE). (a) GM grid size vs. total time. (b) Disaggregated times for each one of the steps. LE: SOR computation of Laplace’s Equation, GVF: Computation of Gradient Vector Field, DIST INI: Initalization of PDEs at the boundaries (Lagrangian in PVE case), DIST: computation time for distances functions L0 and L1. When the PV is being used, most of the computation time is spent in the Lagrangian initialization, however this time is compensated by the reduced number of voxels being included in the grid for the Eulerian part.
3.3.4. Cortical thickness differences between healthy controls (NC), MCI and AD
In this study, we investigated the ability of our method to detect regional cortical thickness differences between NC, MCI and AD. We selected 22 AD patients (mean age at baseline 75.58 ± 5.69, mean MMSE 23.41 ± 1.79), 53 MCI (mean age at baseline 75.51 ± 7.70, mean MMSE 27.02 ± 2.00), 43 NC (mean age at baseline 74.46 ± 5.06, mean MMSE 28.85 ± 1.22). All images were identified in the ADNI database as best in terms of the quality ratings, and underwent the same preprocessing as described in the previous section.
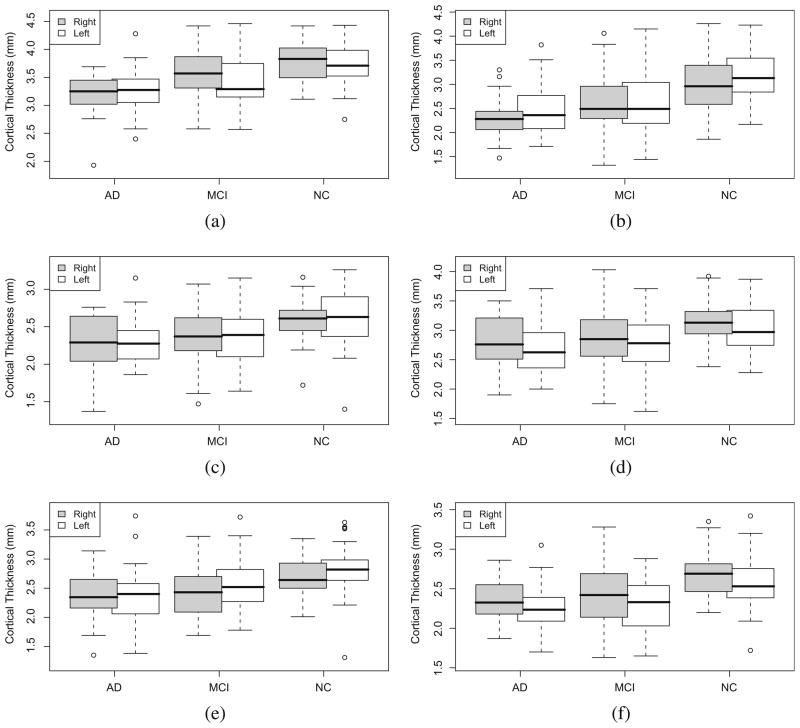
Comparisons between the three groups were carried out using the mean thickness by region. Two sample t-tests were performed between NC/MCI, MCI/AD and NC/AD to identify regions where a significant atrophy exists, with a p < 0.05, corrected for multiple comparisons using false discovery rate (FDR). The results show significant differences between the three groups (Table 4, pFigs. 18 and 19). As expected, the thickness was lowest for the AD group, the highest was for the NC group, whereas the MCI patients show intermediate thickness values. The largest variances in the measure were found within the MCI, which is consistent with the heterogeneity of this group. The most important differences were found when comparing NC against MCI, compared to the differences between MCI and AD. Despite the atrophy measured in some affected regions when comparing MCI and AD, they are not significant, as revealed by the -values.
Table 4.
Differences in cortical thickness between the NC–MCI, MCI–AD and NC–AD groups computed with the proposed method.
| Structure | NC vs. MCI |
MCI vs. AD |
NC vs. AD |
||||||
|---|---|---|---|---|---|---|---|---|---|
| Difference (mm) | p-Value | %Atrophy | Difference (mm) | p-Value | %Atrophy | Difference (mm) | p-Value | %Atrophy | |
| Hipp L | 0.566 | <0.001 | 17.67* | 0.200 | 0.198 | 7.59 | 0.766 | <0.001 | 23.92* |
| Hipp R | 0.432 | <0.001 | 14.25* | 0.308 | 0.019 | 11.83 | 0.740 | <0.001 | 24.40* |
| Ang L | 0.292 | <0.001 | 10.36* | 0.127 | 0.318 | 5.03 | 0.420 | <0.001 | 14.87* |
| Ang R | 0.244 | 0.002 | 9.19 | 0.106 | 0.325 | 4.40 | 0.351 | <0.001 | 13.18* |
| STG L | 0.247 | <0.001 | 9.68* | 0.056 | 0.490 | 2.41 | 0.302 | <0.001 | 11.85* |
| STG R | 0.254 | <0.001 | 9.49* | 0.062 | 0.424 | 2.56 | 0.315 | <0.001 | 11.81* |
| ITG L | 0.323 | 0.002 | 8.57 | 0.174 | 0.174 | 5.05 | 0.497 | <0.001 | 13.18 |
| ITG R | 0.305 | <0.001 | 8.16 | 0.180 | 0.192 | 5.25 | 0.486 | <0.001 | 12.99 |
| PHG L | 0.298 | <0.001 | 7.98 | 0.172 | 0.101 | 5.02 | 0.470 | <0.001 | 12.59* |
| PHG R | 0.236 | 0.002 | 6.25 | 0.344 | 0.001 | 9.72 | 0.580 | <0.001 | 15.37* |
| MTG L | 0.283 | <0.001 | 9.27* | 0.080 | 0.452 | 2.89 | 0.364 | <0.001 | 11.89* |
| MTG R | 0.237 | 0.005 | 7.57 | 0.128 | 0.283 | 4.44 | 0.365 | <0.001 | 11.68* |
Hipp, Hippocampus; PHG, Parahippocampal gyrus; ITG, Inferior temporal gyrus; MTG, Middle temporal gyrus; STG, Superior temporal gyrus; Ang, Angular. The star sign (*), indicates significantly atrophied regions, using a FDR-corrected p < 0.05.
Fig. 18.
Difference in thickness among the three groups for different regions. (a) Parahippocampal gyrus (PHG),(b) hippocampus (Hipp), (c) supramarginal gyrus (SMG), (d) middle temporal gyrus (MTL), (e) angular gyrus, and (f) superior temporal gyrus (STG).
Fig. 19.
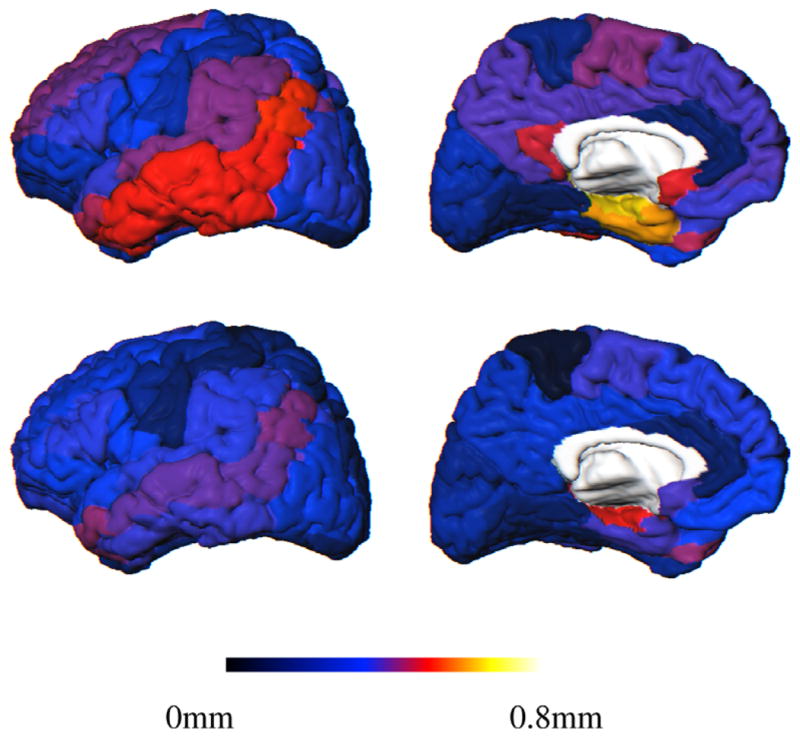
AAL template showing the regional mean cortical thickness difference between the groups over the surface. Top: NC and AD; Bottom: NC and MCI. Left: lateral and Right: medial views.
The most significant differences (p-values) were found in some regions of the temporal lobe, the parietal lobe and the frontal lobe in both the NC/MCI and NC/AD comparisons. The smallest atrophy was found in the occipital lobe.
Although the whole temporal lobe was affected, the strongest differences were revealed in the hippocampus and parahippocampal gyrus. As can be appreciated in Fig. 19, there was a progressive thinning of the inferior and middle temporal gyri, then superior temporal gyrus.
In the parietal lobe, the most significant differences appeared in the angular gyrus (NC–MCI: 0.29 mm; NC–AD: 0.42 mm), the posterior cingulate region, supramarginal gyrus and parietal inferior gyrus. The atrophy was in general bilateral except in the precuneus region, where the right (NC–AD: 0.38 mm) appeared more affected than the left (NC–AD: 0.23 mm).
In the frontal lobe, the superior gyrus appeared slightly more affected than the middle and inferior gyri. Although a small atrophy was found in the orbitofrontal region, the differences were not significant (p > 0.1).
Table 4 shows the differences between the three groups for some selected regions. The star sign (*), indicates significantly atrophied regions, using a FDR-corrected p < 0.05. Fig. 18 illustrates the differences for four regions using box plots and Fig. 19 depicts the regional differences over the generic AAL template.
Cortical thickness was also computed for the same individuals using Eulerian approach as in Yezzi and Prince (2003) and without taking the PVC into account. When comparing with the Eulerian approach, the number of regions with significant atrophy decreased (using a FDR-corrected p < 0.05). For example, for the comparisons NC/AD, atrophy in superior temporal and middle temporal gyri were not detected as significant, whereas they were detected with the proposed method. Similarly for the comparison between NC/MCI, which showed significant changes in the hippocampus and temporal lobe, whereas only the hippocampus left was detected as significant with the Eulerian approach.
3.3.5. Power analysis comparison with the Eulerian approach
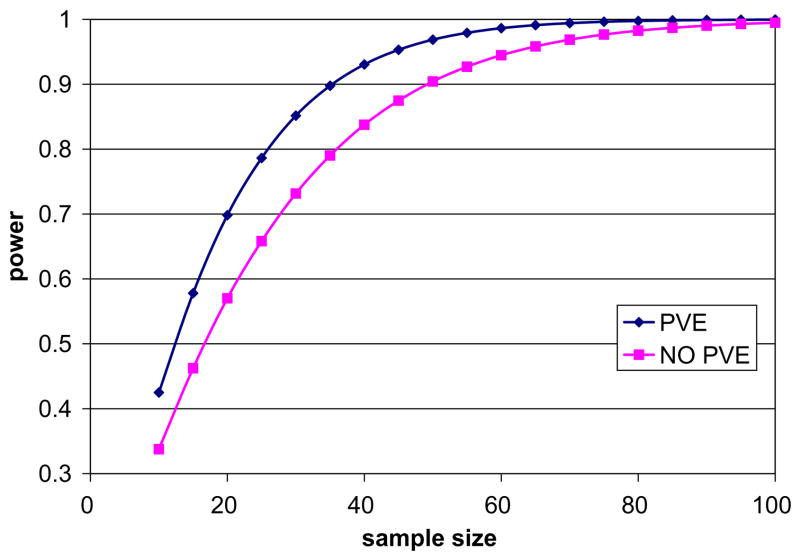
When the PVC was not taken into account, the differences detected between the groups decreased and were on average less significant. It should be noted that the atrophy in the brain differs depending on the location but when the whole brain thickness was considered, the mean difference between healthy controls and AD was 0.27 mm (p < 0.001) without the PVC, compared to 0.31 mm (p < 0.001) with the proposed method. Similarly, the difference between NC and MCI was 0.22 mm (p < 0.001) without the PVC and 0.22 mm (p < 0.001) with the proposed approach. Although the differences are still statistically significant in both cases, with Yezzi’s approach atrophy was estimated to be less pronounced across the brain in almost all the AAL regions. In order to compare the ability of both methods to differentiate cortical thickness in healthy controls vs. AD, power calculations were performed per AAL region on both sets of results using a general power analysis program called G*Power 3 (Faul et al., 2007).2 Sub cortical gray nuclei regions were excluded from the analysis. In both cases the significance level (α as type I error probability) was set to 0.05 and the power, defined as 1 − β was set to 0.95. For each method, we answer the question of how many individuals n are needed to find significant differences between AD and NC. Table 5 summarizes the results for some of the AAL regions typically atrophied in Alzheimer’s disease. Overall, the number of individuals needed to detect significant changes between AD and NC is reduced by 25% when our method is used. Likewise, the effect size (δ) was larger, which suggests that more subtle changes can be detected. The opposite appeared only in the left hippocampus (28 vs. 30 individuals); nevertheless, the hippocampus is the largest structure to be measured, with an average thickness above 5 mm, where the partial volume effect is not as prominent as in other thinner regions. Fig. 20 depicts the power as a function of the sample size for the full brain.
Table 5.
Power analysis for cortical thickness estimation with two approaches to differentiate betweeen AD and NC groups. α = 0.05, power = 0.95. δ is the effect size and n is the number of samples needed to reach that power.
| Structure | NO PVE |
PVE |
||
|---|---|---|---|---|
| n | δ | n | δ | |
| Full brain | 62 | 0.847 | 46 | 1.006 |
| Ang L | 46 | 1.004 | 32 | 1.228 |
| Ang R | 52 | 0.939 | 30 | 1.251 |
| STG L | 52 | 0.929 | 34 | 1.169 |
| STG R | 54 | 0.9153 | 30 | 1.247 |
| SFG L | 19 | 0.804 | 11 | 1.117 |
| SFG R | 36 | 0.560 | 19 | 0.803 |
| PHG L | 54 | 0.914 | 24 | 1.4027 |
| PHG R | 24 | 1.406 | 18 | 1.6942 |
| Hipp L | 28 | 1.327 | 30 | 1.276 |
| Hipp R | 30 | 1.263 | 26 | 1.368 |
| MTG L | 46 | 0.998 | 32 | 1.215 |
| MTG R | 56 | 0.953 | 28 | 1.276 |
Hipp, hippocampus; PHG, Parahippocampal gyrus; MTG, Middle temporal gyrus; STG, Superior temporal gyrus; Ang, Angular gyrus.
Fig. 20.
Power analysis for the whole brain: Comparison of power (1 − β) against the number of subjects required using both methods. One can see that using the PVE, a fewer number of subjects is needed when taking partial volume into account to reach high power (>0.8) and detect significant changes between NC and AD.
4. Discussion and conclusion
We have described a novel voxel-based method for accurate and reproducible cortical thickness estimation, which uses partial volume classification to achieve subvoxel accuracy. The main contribution of our method is the preservation of the efficiency of the Eulerian approach while improving the accuracy through a better initialization. Unlike other approaches, all the calculations are performed on the discrete grid. The method is fully automatic and simple, using a ray casting technique in the direction of the tangent field, such that the estimated boundary defines an equilibrium between the shared fractional content. For the most challenging cases, where a PV voxel shares its boundary with two or more pure voxels in opposite direction, the tangent field cannot be used and the fractional content is equally distributed amongst the opposite voxels.
One advantage of our approach, compared to published mesh-based techniques, is its speed. In addition, we performed extensive experiments on phantoms that showed high accuracy for a wide range of configurations. The full algorithm, including atlas non-rigid registration, segmentation, PV estimation, thickness estimation, smoothing and regional statistics extraction runs under 30 min on a standard PC, compared to the 20 h reported by mesh-based methods. Compared to other voxel-based techniques, the computational cost was marginally increased because of the MAP classification of partial volume voxels. However, once the three tissues were classified and the GMPVC was computed, the time for thickness computation was similar. This is due to the reduced number of voxels to be computed with the Eulerian approach and the efficiency of the Lagrangian initialization, performed with a ray casting method and a dichotomy search at the GM boundary. If the number of voxels were the same, our method would be slightly more expensive, but still as efficient and accurate as required for clinical studies.
Intensity-based segmentation methods may overestimate cortical thickness in challenging cases such as buried sulci. This issue has been previously treated as a post-processing step using thickness constraints to cut the sulci and preserve the topology. Unlike existing methods, our approach implicitly delineates most sulci because the initial binary segmentation is reclassified into pure and mixed voxels. This improves the detection in highly convoluted regions where partial volume effect is more pronounced.
There is no gold standard of cortical thickness estimation, or even accepted ways to measure the thickness on highly convoluted surfaces. Our approach in this paper was to validate each step separately on both phantoms and real data, and then test the reproducibility on the overall technique. The PV estimation was validated against the BrainWeb dataset and the thickness estimation was validated on simulated phantoms, showing excellent accuracy on both isotropic and anisotropic data. The reproducibility of the technique was then evaluated on real data, showing a good agreement between the baseline and repeat scans. A study on clinical data showed regional differences between healthy elderly individuals, individuals with mild cognitive impairment and Alzheimer’s disease patients. The most significant atrophy was measured in the temporal lobe when comparing NC to MCI and NC to AD, which is consistent with the published literature (Lerch and Evans (2005)).
When comparing with other voxel-based approach without taking into account the PV, our technique produced better results as it was more able to detect subtle differences in cortical thickness. When the PV was ignored, precision was compromised as there was a tendency to overestimate the thickness in some areas on phantom studies. In population studies the precision is important as it is related to the ability in differentiating between groups. We proposed a method with more statistical power as compared with the classical Eulerian approach. Evidence suggests that with groups reduced by 25% the proposed method will be able to yield a statistically significant result. When considering the structures first affected in Alzheimer’s disease such as the temporal lobe, the number of the individuals to obtain statistically significant differences can be reduced by up to 39% in average.
In the future, we plan to use our technique on clinical data to study cortical atrophy in other neurodegenerative diseases. We intend also to develop techniques for voxel-based inter-subject comparisons, a challenging issue given the large anatomical variability between patients.
Acknowledgments
Data collection and sharing for this project was funded by the Alzheimer’s Disease Neuroimaging Initiative (ADNI; Principal Investigator: Michael Weiner; NIH Grant U01 AG024904). ADNI is funded by the National Institute on Aging, the National Institute of Biomedical Imaging and Bioengineering (NIBIB), and through generous contributions from the following: Pfizer Inc., Wyeth Research, Bristol-Myers Squibb, Eli Lilly and Company, GlaxoSmithKline, Merck & Co. Inc., AstraZeneca AB, Novartis Pharmaceuticals Corporation, Alzheimer’s Association, Eisai Global Clinical Development, Elan Corporation plc, Forest Laboratories, and the Institute for the Study of Aging, with participation from the US Food and Drug Administration. Industry partnerships are coordinated through the Foundation for the National Institutes of Health. The grantee organization is the Northern California Institute for Research and Education, and the study is coordinated by the Alzheimer’s Disease Cooperative Study at the University of California, San Diego. ADNI data are disseminated by the Laboratory of Neuro Imaging at the University of California, Los Angeles.
Appendix A. Cortical thickness and the boundary conditions
In the original method (Jones et al., 2000) the Laplace’s equation is solved in the GM volume (with the WM and CSF adjacent to the boundaries of the GM set to fixed potentials) such that:
| (A.1) |
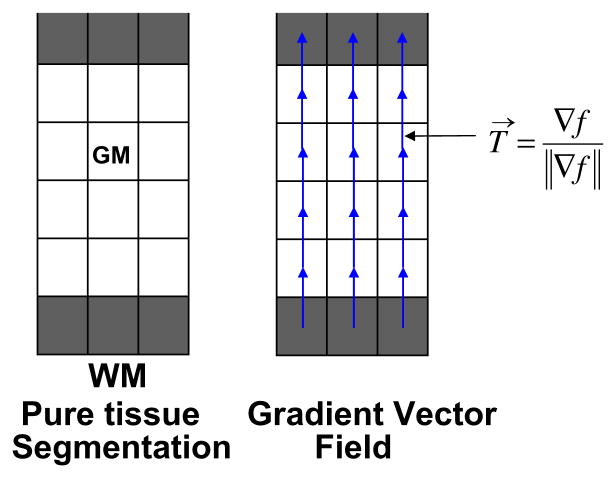
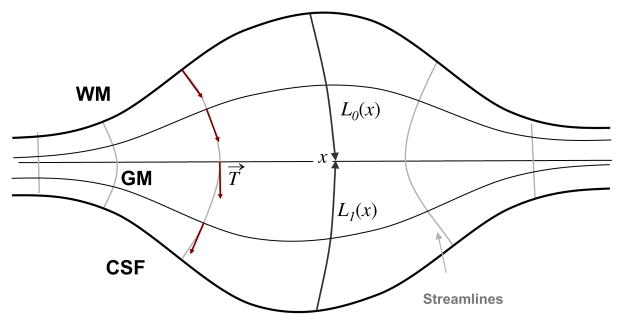
The normalised gradient of the Laplace solution provides several paths, or streamlines, between the WM and CSF, which do not intersect, are locally perpendicular to the equipotential sublayers, and guarantee a unique correspondence between the two boundaries following a tangent vector field T→ (see Fig. A.2), computed as
Fig. A.2.
Representation of initial pure tissue segmentations (WM, GM and CSF) and computation of the normalised gradient vector field.
| (A.2) |
Thus, the thickness W(x) at a given point x is computed by the sum of two functions L0(x) and L1(x) measuring, respectively, the arc length of the streamline from the WM to x and from the CSF to x (Fig. A.1).
Fig. A.1.
Distance equations L0 and L1 for computation of thickness W at a given point x. Thus, W(x) = L0(x) + L1(x).
An explicit integration of T→(−T→) between x and the CSF (WM, respectively) following the streamlines can be used to compute L1(x) (L0(x), respectively). This approach, called Lagrangian, is computationally expensive since each trajectory is explicitly traced. Yezzi and Prince (2003) proposed an Eulerian approach whereby a pair of first order partial differential equations are solved to compute the length of the trajectories without explicitly tracking the streamlines:
| (A.3) |
with boundary conditions L0(x) = 0, L1(x) = 0, ∀ x ∈ [WM,CSF]. Rocha et al. (2007) showed that the main advantage of the Eulerian approach is the computational speed. However, its major drawback is the loss of accuracy, which is emphasised when the anatomical structures, such as the GM, are small compared to the spatial resolution (see Fig. A.2).
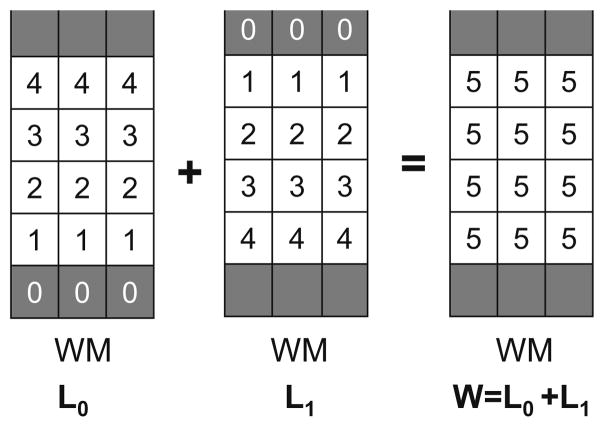
The most important factor affecting the precision of the Eulerian approach for computing the thickness in the GM layer is the choice of initial boundary conditions for L0 and L1. In Yezzi and Prince (2003) they are fixed to 0, implicitly assuming that the boundaries coincide with the centre of the grid points, producing an overestimation of the thickness when L0 and L1 are summed. Fig. A.3 illustrates this bias effect on a 1 mm spacing grid.
Fig. A.3.
Since the distances are measured from the centre of the voxels, the initialization of the boundaries at 0 as in Yezzi and Prince (2003) leads to an overestimation of the thickness W= L0 + L1.
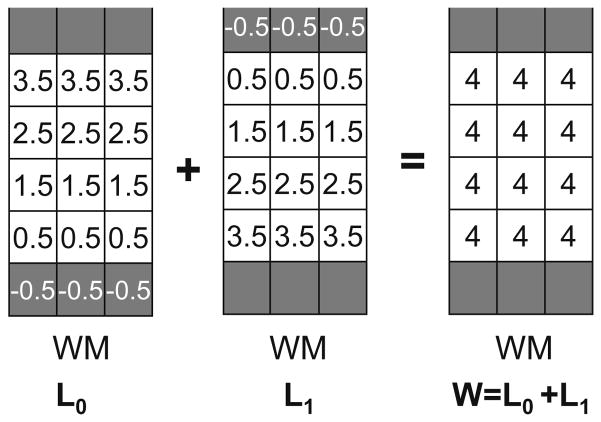
Initialization of the boundaries to half of the negative mean voxel spacing (i.e. −0.5 for 1 mm spacing isotropic images as shown in Fig. A.4), as proposed by Diep et al. (2007), produces the correct thickness but only for isotropic images, when the boundaries coincide with voxels borders (no partial volume effect) and they are aligned to the grid. Other possibilities imply upsampling and interpolation, but with high computational costs.
Fig. A.4.
Initialization according to Diep et al. (2007).
Appendix B. Numerical implementation: finite differences for anisotropic images
To avoid resampling when the images are anisotropic, we solve iteratively the Laplace finite difference approximation as in Diep et al. (2007). Thus, given a 3D grid with voxel spacing hx, hy and hz, in the x, y and z directions, respectively,
| (B.1) |
where ft+1(i, j,k) is the potential of the voxel (i, j,k) during the (t + 1)th iteration.
Given the unit vector field T→, the finite difference approximations used to solve (A.1) are also generalised for anisotropic images. To reduce the effects of voxelisation when computing the finite differences, first, a regularised tangent field perpendicular to the structure is obtained by
| (B.2) |
where Gσ is a Gaussian function (σ = 1), convolved with each one of the components of T→ from Eq. (A.2). Using Tx[i, j,k], Ty[i, j,k] and Tz[i, j,k] as the components of at the grid point (i, j,k)
| (B.3) |
| (B.4) |
wherewhere
and
and similarly for the voxels j, k, with hy and hz. Eqs. B.1, B.3, B.4 are solved iteratively using the successive over-relaxation (SOR) method (Press et al., 1988), which is a numerical method used to speed up convergence of the Gauss–Seidel method for solving a linear system of equations. With a good relaxation factor, SOR can require half as many iterations as the Gauss–Seidel method. Experimentally we chose a relaxation factor of 1.28 for Eq. (B.1) and 1.2 for Eqs. (B.3) and (B.4). This produces a cortical thickness map (Fig. 2f) where all the voxels in the GM grid are tagged with the thickness measured along the streamline crossing through this point.
Footnotes
References
- Besag J. On the statistical analysis of dirty pictures. Journal of the Royal Statistical Society. 1986;48:259–302. [Google Scholar]
- Collins D, Zijdenbos A, Kollokian V, Sled J, Kabani N, Holmes C, Evans A. Design and construction of a realistic digital brain phantom. IEEE Transactions on Medical Imaging. 1998;17 (3):463–468. doi: 10.1109/42.712135. [DOI] [PubMed] [Google Scholar]
- Dale A, Fischl B, Sereno M. Cortical surface-based analysis I: segmentation and surface reconstruction. NeuroImage. 1999;9 (2):179–194. doi: 10.1006/nimg.1998.0395. [DOI] [PubMed] [Google Scholar]
- Diep T-M, Bourgeat P, Ourselin S. Efficient use of cerebral cortical thickness to correct brain MR segmentation. IEEE International Symposium on Biomedical Imaging (ISBI’07). IEEE; Washington, DC, USA. 2007. pp. 592–595. [Google Scholar]
- Faul F, Erdfelder E, Lang AG, Buchner A. G* power 3: a flexible statistical power analysis program for the social, behavioral, and biomedical sciences. Behavior Research Methods. 2007;39 (2):175–191. doi: 10.3758/bf03193146. [DOI] [PubMed] [Google Scholar]
- Fischl B, Dale A. Measuring the thickness of the human cerebral cortex from magnetic resonance images. Proceedings of the National Academy of Sciences of the United States of America. 2000;97 (20):11050–11055. doi: 10.1073/pnas.200033797. [DOI] [PMC free article] [PubMed] [Google Scholar]
- Haidar H, Soul J. Measurement of cortical thickness in 3D brain MRI data: validation of the Laplacian method. Journal of Neuroimaging. 2006;16 (2):146–153. doi: 10.1111/j.1552-6569.2006.00036.x. [DOI] [PubMed] [Google Scholar]
- Hutton C, De Vita E, Ashburner J, Deichmann R, Turner R. Voxel-based cortical thickness measurements in MRI. Neuroimage. 2008;40 (4):1701–1710. doi: 10.1016/j.neuroimage.2008.01.027. [DOI] [PMC free article] [PubMed] [Google Scholar]
- Hutton C, De Vita E, Turner R. Sulcal segmentation for cortical thickness measurements. Medical Image Computing and Computer-assisted Intervention (MICCAI’02), LNCS; Berlin/Heidelberg, Tokyo, Japan: Springer; 2002. pp. 443–450. [Google Scholar]
- Jones S, Buckbinder B, Aharon I. Three-dimensional mapping of cortical thickness using Laplace’s equation. Human Brain Mapping. 2000;11 (1):12–32. doi: 10.1002/1097-0193(200009)11:1<12::AID-HBM20>3.0.CO;2-K. [DOI] [PMC free article] [PubMed] [Google Scholar]
- Kim J, Singh V, Lee J, Lerch J, Ad-Dab’bagh Y, MacDonald D, Lee J, Kim S, Evans A. Automated 3D extraction and evaluation of the inner and outer cortical surfaces using a Laplacian map and partial volume effect classification. NeuroImage. 2005;27 (1):210–221. doi: 10.1016/j.neuroimage.2005.03.036. [DOI] [PubMed] [Google Scholar]
- Kwan R-S, Evans A, Pike G. Visualization in Biomedical Computing (VBC’96), Lecture Notes in Computer Science. Vol. 1131. Springer-Verlag; 1996. An extensible MRI simulator for post-processing evaluation; pp. 135–140. [Google Scholar]
- Lee J, Lee J, Kim J, Kim I, Evans A, Kim S. A novel quantitative cross-validation of different cortical surface reconstruction algorithms using MRI phantom. Neuroimage. 2006;31 (2):572–584. doi: 10.1016/j.neuroimage.2005.12.044. [DOI] [PubMed] [Google Scholar]
- Lerch J, Evans A. Cortical thickness analysis examined through power analysis and a population simulation. Neuroimage. 2005;24 (1):163–173. doi: 10.1016/j.neuroimage.2004.07.045. [DOI] [PubMed] [Google Scholar]
- Lerch J, Pruessner J, Zijdenbos A, Hampel H, Teipel S, Evans A. Focal decline of cortical thickness in Alzheimer’s disease identified by computational neuroanatomy. Cerebral Cortex. 2005;15 (7):995–1001. doi: 10.1093/cercor/bhh200. [DOI] [PubMed] [Google Scholar]
- Lohmann G, Preul C, Hund-Georgiadis M. Morphology-based cortical thickness estimation. 18th International Conference on Information Processing in Medical Imaging (IPMI’03); 2003. pp. 89–100. [DOI] [PubMed] [Google Scholar]
- MacDonald D, Kabani N, Avis D, Evans A. Automated 3-D extraction of inner and outer surfaces of cerebral cortex from MRI. NeuroImage. 2000;12 (3):340–356. doi: 10.1006/nimg.1999.0534. [DOI] [PubMed] [Google Scholar]
- Mangin JF, Frouin V, Bloch I, Régis J, López-Krahe J. From 3D magnetic resonance images to structural representations of the cortex topography using topology preserving deformations. Journal of Mathematical Imaging and Vision. 1995;5 (4):297–318. [Google Scholar]
- Ourselin S, Roche A, Subsol G, Pennec X, Ayache N. Reconstructing a 3D structure from serial histological sections. Image and Vision Computing. 2001;19 (1):25–31. [Google Scholar]
- Pham D, Xu C, Prince J. Current methods in medical image segmentation. Annual Review of Biomedical Engineering. 2000;2:315–337. doi: 10.1146/annurev.bioeng.2.1.315. [DOI] [PubMed] [Google Scholar]
- Press W, Teukolsky S, Vetterling WTPFB. Numerical Recipes in C: The Art of Scientific Computing. 2. Cambridge University Press; 1988. [Google Scholar]
- Rocha K, Yezzi A, Prince J. A hybrid Eulerian–Lagrangian approach for thickness, correspondence, and gridding of annular tissues. IEEE Transactions on Image Processing. 2007;16 (3):636–648. doi: 10.1109/tip.2007.891072. [DOI] [PubMed] [Google Scholar]
- Rueckert D, Sonoda L, Hayes C, Hill D, Leach M, Hawkes D. Nonrigid registration using free-form deformations: application to breast MR images. IEEE Transactions on Medical Imaging. 1999;18:712–721. doi: 10.1109/42.796284. [DOI] [PubMed] [Google Scholar]
- Santago P, Gage H. Quantification of MR brain images by mixture density and partial volume modeling. IEEE Transactions on Medical Imaging. 1993;12 (3):566–574. doi: 10.1109/42.241885. [DOI] [PubMed] [Google Scholar]
- Shattuck D, Sandor-Leahy S, Schaper K, Rottenberg D, Leahy R. Magnetic resonance image tissue classification using a partial volume model. Neuroimage. 2001;13 (5):856–876. doi: 10.1006/nimg.2000.0730. [DOI] [PubMed] [Google Scholar]
- Singh V, Chertkow H, Lerch J, Evans A, Dorr AE, Kabani NJ. Spatial patterns of cortical thinning in mild cognitive impairment and Alzheimer’s disease. Brain. 2006;129 (11):2885–2893. doi: 10.1093/brain/awl256. [DOI] [PubMed] [Google Scholar]
- Srivastava S, Maes F, Vandermeulen1 D, Dupont P, Van Paesschen W, Suetens P. An automated 3D algorithm for neo-cortical thickness measurement. MICCAI’03. 2003;2879:488–495. [Google Scholar]
- Studholme C, Hill D, Hawkes D. An overlap invariant entropy measure of 3D medical image alignment. Pattern Recognition. 1998;32 (1):71–86. [Google Scholar]
- Tohka J, Zijdenbos A, Evans A. Fast and robust parameter estimation for statistical partial volume models in brain MRI. NeuroImage. 2004;23 (1):84–97. doi: 10.1016/j.neuroimage.2004.05.007. [DOI] [PubMed] [Google Scholar]
- Tzourio-Mazoyer N, Landeau B, Papathanassiou D, Crivello F, Etard O, Delcroix N, Mazoyer B, Joliot M. Automated anatomical labeling of activations in SPM using a macroscopic anatomical parcellation of the MNI MRI single-subject brain. Neuroimage. 2002;15 (1):273–289. doi: 10.1006/nimg.2001.0978. [DOI] [PubMed] [Google Scholar]
- Van Leemput K, Maes F, Vandermeulan D, Suetens P. Automated model-based bias field correction of MR images of the brain. IEEE Transactions on Medical Imaging. 1999a;18 (10):885–896. doi: 10.1109/42.811268. [DOI] [PubMed] [Google Scholar]
- Van Leemput K, Maes F, Vandermeulan D, Suetens P. Automated model-based tissue classification of MR images of the brain. IEEE Transactions on Medical Imaging. 1999b;18 (10):897–908. doi: 10.1109/42.811270. [DOI] [PubMed] [Google Scholar]
- Yezzi A, Prince J. An Eulerian PDE approach for computing tissue thickness. IEEE Transactions on Medical Imaging. 2003;22 (10):1332–1339. doi: 10.1109/TMI.2003.817775. [DOI] [PubMed] [Google Scholar]
- Zeng X, Staib L, Schultz R, Duncan J. Segmentation and measurement of the cortex from 3D MR images using coupled-surfaces propagation. IEEE Transactions on Medical Imaging. 1999;18 (10):927–937. doi: 10.1109/42.811276. [DOI] [PubMed] [Google Scholar]


