

Abstract
MR Elastography (MRE) is an MRI-based technique for quantitatively assessing the mechanical properties of tissues, based on the propagation of shear waves. Multiple studies have described many potential applications of MRE, from characterizing tumors to detecting diffuse disease processes. Studies have shown that MRE can be successfully implemented to assess abdominal organs. The first clinical application MRE to be well documented is the detection and characterization of hepatic fibrosis, which systematically increases the stiffness of liver tissue. In this diagnostic role, offers a safer, and less expensive, and potentially more accurate alternative to invasive liver biopsy. Emerging results suggest that measurements of liver and spleen stiffness may provide an indirect way to assess portal hypertension. Preliminary studies have demonstrated that is possible to use MRE to evaluate the mechanical properties of other abdominal structures, such as the pancreas and kidneys. Steady technical progress in developing practical protocols for applying MRE in the abdomen and pelvis provides opportunities to explore many other potential applications of this emerging technology.
Keywords: Abdominal MR Elastography, MRI
Elasticity Imaging
Many disease processes, either focal or diffuse, cause marked changes in tissue mechanical properties. For instance, hard masses detected by manual palpation in the thyroid, breast and prostate are known to be suspicious for malignancy. Generations of physicians have experienced that a fibrotic/cirrhotic liver typically is very hard. There is significant interest in precisely characterizing the mechanical properties of normal and abnormal tissues and using that information as potential indicators for diagnosing diseases and monitoring disease progression and treatment efficacy. With recent advances in biomedical imaging, the ability to quantify in vivo stiffness by detecting wave propagation velocity through human tissue (elastography) using noninvasive techniques like ultrasound and MRI has now became possible. At present, there are two well-developed noninvasive approaches to assess the mechanical properties of abdominal tissues in vivo. One is the Transient Ultrasound Elastography (TUE) technique1, 2, which can provide localized quantitative shear stiffness based on 1-D measurements. The other is the MR Elastography (MRE), which is an MR-based method that uses a modified phase-contrast MRI acquisition to determine the tissue stiffness distribution throughout a 2-D or 3-D region of interest 3.
Compared to ultrasound-based techniques for elasticity imaging, MR-based techniques offer many significant advantages and have been the focus of significant developments over the last few years. The measurement of motion with MR in medical applications has been motivated significantly by the desire for blood flow quantification and vascular system imaging 4. In the 1990’s, measurement of tissue mechanical properties using MR methods was demonstrated 3, 5. MR elastography uses a modified phase-contrast imaging sequence to detect propagating shear waves within the tissue of interest. The technique has been well documented and can be implemented on a conventional MRI system with minimal modifications to the hardware and software.
The hardware required for MRE is an acoustic driving system, which is used to generate shear waves in tissue, typically at frequencies between 40 and 200 Hz. Acoustic waves have been created in targeted tissues using active electromechanical voice coils 6, 7, passive rigid rod drivers 8, 9 and passive pneumatic drum drivers 10–13. There have also been a number of other application-specific drivers, such as a needle-based acoustic driver system used to study the liver tissue of small animal models in vivo 14. The main driving system used in several studies involves a cylindrical, nonmetallic passive drum driver 18.5 cm in diameter and 3 cm in height. It is activated with varying acoustic pressure conducted via a 7.6-meter long plastic tube (PVC, polyvinyl chloride) from a distant active audio device located outside the scanner room. Among the aforementioned designs, the passive pneumatic driver has several advantages. It can be easily applied against body (such as against the thoracic and abdominal walls) in any orientation, even adjacent to the imaging coils, while avoiding problems with artifacts and heat buildup typical of electromechanical drivers.
The software required for MRE includes a specialized phase-contrast MRI pulse sequence and an inversion algorithm which are used to image and process the wave images, respectively. Depending on the specific application, the MRE sequence uses a conventional MR imaging sequence (e.g., gradient-recalled echo (GRE), spin echo (SE), balanced steady-state free precession (bSSFP), or echo planar imaging (EPI)) with the inclusion of additional motion-encoding gradients (MEGs), which allow shear waves with amplitudes in the micron range to be readily imaged 3, 5, 15–20. The MEGs are imposed along a specific direction and switched in polarity at an adjustable frequency. Trigger pulses synchronize the imaging sequence with the driving system to induce shear waves in the tissue, usually at the same frequency as the MEGs. In the received MR signal, a measurable phase shift caused by the cyclic motion of the spins in the presence of these MEGs can be used to calculate the displacement at each voxel, which provides a snapshot of the mechanical waves propagating within the tissue. By adjusting the phase offset between the mechanical excitation and the oscillating MEGs, wave images can be obtained for various time points of the vibration. Four to eight phase offsets evenly spaced over 1 cycle of the motion are obtained in most experiments. This allows for the extraction of the harmonic component of the phase data at the driving frequency, giving the amplitude and the phase of the harmonic displacement at each point in space, which is the input to most MRE inversion algorithms.
MRE uses propagating mechanical shear waves rather than a static stress as a means to study tissue elasticity. This provides an important advantage for calculating elasticity in that dynamic MRE does not require the estimation of the regional static stress distribution either inside or on the boundaries of the tissue. The acquired wave images are processed using an inversion algorithm to generate quantitative images that depict tissue stiffness – called elastograms. Many different inversion algorithms have been developed to process MRE wave data based on different assumptions about the nature of the wave propagation. Preprocessing algorithms for the wave data include phase unwrapping, removal of concomitant gradient field effects, and directional filtering 21 to enhance the accuracy of the elastograms. The inversion algorithms themselves can be performed using measures of the phase gradient or spatial frequency content, direct inversions of the differential equations of motion, or iterative methods involving finite element models 22–25.
Over the years, MRE has been developed for many applications to quantitatively assess the viscoelastic properties of various soft tissues, including brain 26–28, breast 29–32, heart 33, 34, lung 35, muscle 36, liver 37, spleen 13, kidneys 38 and pancreas 39. A preliminary study has shown that abdominal MRE is feasible for the assessment of most abdominal organs 40. The purpose of this review work is to summarize the current status of MRE applications for the abdomen, including the current reported diagnostic capabilities of MRE and the demonstrated feasibility of studying select organs, disease models and patient populations.
MRE Assessment of Hepatic Fibrosis
Essential for life, the liver assists in the maintenance of metabolic homeostasis by processing dietary carbohydrates, amino acids, lipids, and vitamins; metabolizing cholesterol and toxins; producing clotting factors; and storing glycogen. Chronic liver disease is a worldwide problem, which has a variety of causes including viral, autoimmune, drug-induced, cholestatic, metabolic and hereditary 41. In response to inflammation or direct toxic insult to the liver, zonal cellular injury forms and eventually leads to progressive hepatic fibrosis, which is scar tissue that develops progressively by an excessive production of extracellular matrix proteins 42. The end stage of hepatic fibrosis is cirrhosis, which is characterized by severe complications such as variceal bleeding and ascites as a result of portal hypertension. It is also associated with a 50% 5-year mortality due to hepatic failure and the development of hepatocellular carcinoma 43. In the United States during 2004, disease-related complications were associated with nearly 40,000 deaths and greater than 1.4 billion dollars spent on medical services 44, 45. Furthermore, these trends are expected to increase based on an aging population, the growing epidemic of obesity, and the continued emergence of clinical manifestations among individuals with long-standing chronic hepatitis C infection 46, 47. In terms of individual patients as well as populations, there remains a great need to develop and identify methods of risk stratification and prognosis for individuals with chronic liver disease.
Fibrosis previously was thought to be an irreversible scarring process formed in response to inflammation or direct toxic insult to the liver. However, increasing evidence has demonstrated that, unlike cirrhosis, the early stages of fibrosis are treatable and reversible if appropriate anti-fibrotic treatment is given 48, 49. As anti-fibrotic therapies evolve, a reliable, noninvasive and cost-effective technique for diagnosis and follow-up assessment of hepatic fibrosis is needed to manage patients with chronic liver disease. Being able to noninvasively monitor the progression of liver fibrosis would help in understanding the natural history of liver fibrosis in patients with chronic liver disease, determining which patients require antiviral therapy, predicting the approximate time to the development of cirrhosis, and discovering new directions of scientific inquiry. Consequently, the degree and rate of fibrosis progression are important prognostic indicators for many chronic liver diseases and hepatic fibrosis should be regarded as a distinct clinical problem, amenable to specific diagnostic tests and therapies that are independent of the etiology. Therefore, there is a need for a reliable, noninvasive method to assess liver fibrosis, not only to detect and stage the disease itself, but also to monitor treatment efficacy and optimize dosing.
Needle liver biopsy, analyzed with connective tissue stains, has long been considered the “gold standard” to detect and quantify hepatic fibrosis. However, it is an invasive procedure with some inherent risk (mortality rate 0.1~0.01%) with many potential complications (leading to poor acceptance by patients) and the likelihood of sampling errors (due to only 1/50,000th of the liver mass being sampled). The biopsy histological examination largely depends on sample quality (the length and size of the tissue specimen) and the subjective evaluation of morphological changes including grading of necro-inflammatory activity and staging extent of fibrotic organ transition. Existing histologic scoring systems such as the Ishak 50 and Metavir 51 classifications provide a semiquantitative assessment of fibrosis extent which, in theory, has the potential to allow for serial assessments to document progression. However, there has been little documentation of strong reproducibility for existing methods despite their widespread use in clinical practice and controlled trials. A number of studies have demonstrated excessive rates of sampling error (25%–40%) resulting in poor reproducibility of the needle liver biopsy regardless of underlying liver disease etiology 52. In addition, the extent of variation in observer interpretation by expert histopathologists may be as high as 20% 53. Therefore, the diagnostic value of the biopsy as “gold standard” in the detection of fibrosis/fibrogenesis must be questioned. Therefore, there remains an opportunity to improve the assessment of individuals with progressive fibrosis who might benefit from early intervention.
Animal studies
It is difficult to precisely describe the development of fibrosis and its impact on tissue mechanical properties in humans due to unreliable liver biopsy data and impractical or impossible longitudinal studies. Therefore, animal models were used to provide progressively increased degrees of hepatic fibrosis which could be accurately assessed with both MRE and histological analysis. Two different animal models (a CCl4-induced fibrosis mouse model and a knockout mouse model of autosomal recessive polycystic kidney disease (ARPKD)) have been investigated to evaluate the relationship between liver stiffness and the extent of hepatic fibrosis 7, 14. It was validated that the shear stiffness of the liver tissue increases systematically with the extent of hepatic fibrosis in both animal models. Since there may be an increase in the lipid content of fibrotic livers, which is very common in patients with chronic liver diseases, an additional goal of the animal study was to determine whether fat infiltration could potentially interfere with the MRE assessment of liver fibrosis. In order to evaluate this factor, Yin et al. quantitatively assessed fat infiltration using a three-point Dixon method in the ARPKD mouse model, which can develop obesity due to diet, stress, or malfunction of lipid metabolism because of liver disease. It demonstrated that there is no significant correlation between the liver stiffness measurements and the liver fat-to-water ratio at different stages of hepatic fibrosis (Figure 1) 14.
Figure 1.

In an ARPKD mouse model resulting in liver fibrosis, a significant linear correlation was observed between the liver stiffness and the histological analysis of fibrosis extent (p-value < 0.0001). No significant correlation was found between liver stiffness and the fat-to-water ratio in any age group for either the normal or diseased mice. Adapted from reference 14.
Nonalcoholic fatty liver disease (NAFLD) refers to a wide spectrum of liver disease ranging from simple steatosis, to nonalcoholic steatohepatitis (NASH), to irreversible cirrhosis. All of the stages of NAFLD result in the accumulation of fat in the liver cells. In NASH, the fat accumulation is associated with varying degrees of inflammation and hepatic fibrosis. Recently, Salameh et al. demonstrated that MRE-assessed liver elasticity increased before fibrosis development (linked to myofibroblast activation) in a well-established NAFLD rat model 54. If these results are confirmed in NAFLD/NASH patients, MRE may be a potential diagnostic method to discriminate between simple steatosis and steatohepatitis. Therefore, MRE might have a new role in early detection and treatment assessment in NASH patients.
Human studies
The practical in vivo hepatic MRE technique for clinical investigations in humans is the culmination of technology development and optimization involving driver design, pulse sequence design, imaging parameters and inversion algorithms. Because of the limited accessibility of the liver, many researchers have investigated the primary mechanism of shear wave production in the abdominal organs using vibrations from external sources. Instead of transversely orientated drivers, which have poor depth penetration and orientation flexibility, longitudinal surface drivers were deemed to be more optimal by generating shear waves via mode conversion. Several application-specific longitudinal drivers that can deliver acoustic waves to liver tissue have been investigated 6, 9, 10. Currently, there are three types of liver MRE drivers. The electromechanical drivers 6 deliver longitudinal vibrations through the posterior body wall. This driver design has the limitation that the driver is fixed within the imaging coil and may have disadvantages related to heat deposition, artifacts and inflexible orientation. The subcostally located, extended-piston driver design 9 applies longitudinal motion to the anterior body surface. The nonmetallic materials employed in this design avoid problems with artifacts and heat buildup when it is driven continuously. However, this type of design lacks flexibility in its orientation and how it can contact the body habitus. Without the protection of the rib cage, the subcostal liver tissue may suffer from an unexpected preload from the driver that may lead to overestimation of the stiffness in that region.
The development of a pressure-activated driver system 10 has provided a mechanism for performing liver MRE without the aforementioned limitations. Placed against the lower right rib cage, the pressure-activated driver can effectively and efficiently generate shear waves throughout the entire liver tissue as well as within the spleen even though it is located on the opposite side of the abdominal cavity from where the driver is placed. This driver system even works well in obese patients (30 < BMI < 42) and those with other complications such as ascites 11. A study comparing MRE and TUE in a series of 141 patients with chronic liver disease showed that while TUE has become a useful clinical tool, the technical success rate for MRE was higher (94%) than that of TUE (84%). This was due to technical limitations of the TUE technique which make it difficult to perform on patients with ascites (since fluid perturbs the wave propagation being measured) and obese patients (BMI > ~28) since TUE measures the stiffness at a fixed location approximately 6 cm below the skin surface, which may not reach the liver in obese patients. MRE also proved to have better diagnostic accuracy in that study 55. The reproducibility of MRE has also been assessed in 5 healthy volunteers 6 and 56 patients with chronic liver diseases 55, which resulted in 9% within-subject coefficient of elasticity variance and 0.97 (95% CI: 0.92–0.99) interclass correlation coefficient. This high reproducibility for MRE is essential for the design of future longitudinal studies.
The MRE visualization of the full 3-D vector displacement field within the liver produced by longitudinal drivers has also proven to offer insights and improvements in both experimental design and 2-D imaging plane selection for in vivo MRE applications 56, 57. These studies showed that in a large portion of the liver, the propagation direction of shear waves is approximately parallel with the transverse imaging plane when using a pressure-activated drum driver on the anterior chest wall. This allows accurate elastograms to be generated from 2-D wave image data (which can be acquired in a breath-hold), rather than requiring 3-D wave imaging, which requires longer acquisition times and more complex measures to address respiratory motion. With the acoustic driver system, the 2-D wave approximation is generally valid in the axial imaging planes distanced 2–10 cm away from the superior margin of the liver, assuming the liver has average vertical height of 15 cm. Compared with 3-D hepatic MRE analysis, 2-D wave analysis based on 2-D MRE data provides accurate results in a significant part of the liver volume with a substantially reduced calculation time (Figure 2) 58.
Figure 2.
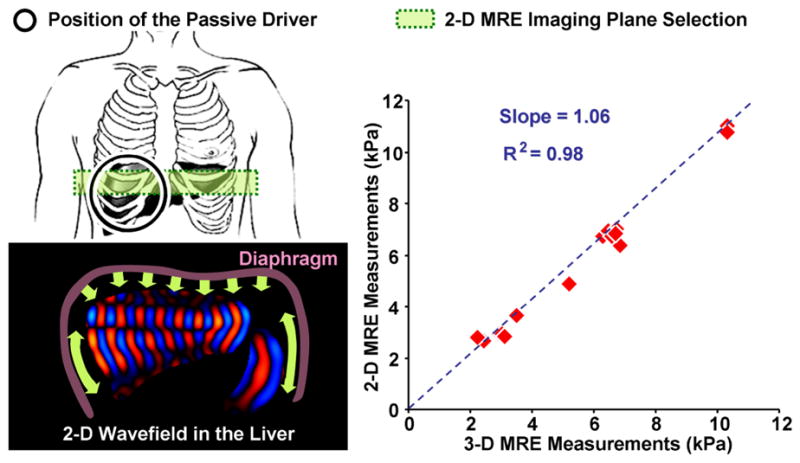
Left: Schematic illustrations of the hepatic MRE setup (with passive driver position indicated) and shear wave generation mechanism; Right: A significant correlation was found between 2-D liver MRE measurements and 3-D liver MRE measurements with full wave information (p < 0.001). Adapted from reference 58.
Motivated by the results of the pilot volunteer and patient studies 6, 9, 10, multiple investigators have studied the diagnostic ability of liver MRE for detecting hepatic fibrosis in patients with chronic liver disease from various etiologies 11, 55, 59–61. The consistent findings have established that liver MRE has excellent diagnostic accuracy for assessing hepatic fibrosis. MRE has been shown to be effective for distinguishing normal from fibrotic livers with a very high negative predictive value of 97%. ROC analysis has shown that, with a shear stiffness cut-off value of 2.93 kPa, the predicted sensitivity and specificity for detecting all grades of liver fibrosis is 98% and 99%, respectively 11. ROC analysis has also provided evidence that MR elastography can discriminate between patients with moderate and severe fibrosis (grades 2–4) and those with mild fibrosis, as shown in Table 1 and Figure 3 11, 55, 59. Hepatic stiffness assessed by MRE has been shown to not be systematically influenced by the presence of steatosis 11, which agrees with studies involving TUE in which the correlation between liver stiffness and fibrosis stage were not affected by steatosis as well 62, 63.
Table 1.
Diagnostic capability analysis of MRE-assessed hepatic fibrosis in patients with chronic liver disease from various studies.
| Reference | N | Cut-off | Sensitivity | Specificity | AUR (Area under the ROC curve) | Liver Stiffness, kPa |
|---|---|---|---|---|---|---|
| Huwart et al 55 | 133 | F0 : F1–4 | 85 | 91 | 0.96 | 2.4 |
| F0–1 : F2–4 | 100 | 91 | 0.99 | 2.5 | ||
| F0–2 : F3–4 | 91 | 97 | 0.99 | 3.1 | ||
| F0–3 : F4 | 100 | 96 | 1.00 | 4.1 | ||
| Huwart et al 59 | 88 | F0 : F1–4 | 83 | 100 | 0.95 | 2.4 |
| F0–1 : F2–4 | 98 | 100 | 0.99 | 2.5 | ||
| F0–2 : F3–4 | 95 | 100 | 0.99 | 3.1 | ||
| F0–3 : F4 | 100 | 100 | 1.00 | 4.3 | ||
| Yin et al 11 | 85 | N : F0–4 | 98 | 99 | 0.99 | 2.9 |
| F0–1 : F2–4 | 86 | 85 | 0.92 | 4.9 | ||
| F0–2 : F3–4 | 78 | 96 | 0.92 | 6.7 | ||
| F0–3 : F4 | 89 | 90 | 0.92 | 6.7 | ||
Figure 3.

Example wave images and shear stiffness maps (elastograms) in liver patients with four different biopsy-proven hepatic fibrosis stages.
Motivated by the successful implementation of MRE for the study of diffuse changes in hepatic stiffness due to fibrosis, a pilot study has been conducted to evaluate the potential role of MRE in characterizing hepatic tumors. In this preliminary work 64, patients with 44 hepatic masses were evaluated with MRE and the results were correlated with pathological diagnosis or other accepted diagnostic criteria. The stiffness of benign masses (9 hemangiomas, 3 focal nodular hyperplasia, and 1 hepatic adenoma) averaged 2.7 kPa, slightly higher than the mean stiffness of normal liver parenchyma (2.3 kPa). The mean stiffness of the malignant tumors was 10.1 kPa. In this series, a cut-off value of 5 kPa completely separated all benign liver masses from malignant lesions. Figure 4 shows the results from an expanded cohort of patients from that trial including 91 hepatic tumors. The results indicate that MRE shows substantial promise for aiding the characterization of liver tumors which provides motivation for exploring the potential for evaluating other mass lesions in the abdomen as well.
Figure 4.

Left: The top row shows the results of an MRE exam of a 39-year-old man with a hepatic adenoma. The shear stiffness was measured to be 3.1 kPa in the benign tumor and 2.4 kPa in the surrounding normal liver tissue. The bottom row shows an exam of a 44-year-old man with a cholangiocarcinoma. The stiffness was measured to be 19 kPa in the malignant tumor and 5.4 kPa in the surrounding fibrotic liver tissue. Right: The graph shows a box plot of the shear stiffness of normal liver tissue and various types of hepatic tumors. A cutoff value of 5 kPa separates the malignant tumors from benign tumors and normal liver tissue. Adapted from reference 64.
MR Elastography of Other Abdominal Organs – Preliminary Results
Spleen
Measurements of the stiffness of the spleen, incidentally imaged in exploratory hepatic MRE studies in patients with chronic liver disease, led to an intriguing and potentially important observation about the correlation between spleen and liver mechanics. The preliminary study of 12 normal volunteers and 38 liver patients with biopsy-proven chronic liver diseases demonstrated higher spleen stiffness in patients with chronic liver disease and a very strong correlation between hepatic and splenic stiffness in these patients (R2 = 75, p-value < 0.001) 13. This may suggest that the bulk stiffness of the spleen is strongly affected by the portal venous pressure through a poroelasticity effect. To study this effect, a preliminary study is underway involving a well-developed canine model of portal hypertension. MRE has been performed on two adult mongrel dogs immediately after and 4 weeks after initiating cholestatic liver disease by common bile duct ligation. Prior work has established that this model reliably results in portal hypertension within 4 weeks. Subcutaneous vascular access ports were placed with catheter tips in the portal vein and the right hepatic vein allowing measurement of hepatic venous pressure gradient (HVPG). As shown in Figure 5, the HVPG increased from a mean value of 4.5 mmHg in these dogs to a mean value of 13.5 mmHg. The threshold for development of varices in humans is thought to an HVPG of 10–12 mmHg. The MRE-assessed splenic stiffness in these dogs rose from a mean value of 1.8 kPa to an average of 3.4 kPa. Although this study is still ongoing, these results provide preliminary evidence to support the hypothesis that in the absence of confounding effects, the MRE-assessed stiffness of the spleen reflects the magnitude of the HVPG. This also provides motivation for the development of improved MRE techniques for the assessment of the spleen as well as the development and validation of poroelastic models that may allow the HVPG to be estimated noninvasively from MRE-based measurements of splenic stiffness. This would be a very significant development because knowledge of the HVPG is considered to be very important in the management of chronic liver disease and is very difficult to determine noninvasively.
Figure 5.

Cholestatic liver disease and portal hypertension was established in 20-kg adult mongrel dogs by common bile duct ligation (CBDL). At surgery, two subcutaneous vascular access ports (VAPs) were placed with their catheter tips in the portal vein and right hepatic vein. MRE and measurement of hepatic venous pressure gradient (HVPG) were obtained before and 4 weeks after surgery. In the maximum intensity projection (MIP) elastograms shown on the right, the dotted lines illustrate locations of the canine spleen tissues. The mean spleen stiffness increased substantially (from 1.8 kPa to 3.4 kPa) with the severely elevated mean HVPG (from 4.5 mmHg to 13.5 mmHg).
Kidneys and Pancreas
Exploratory MRE of the upper abdomen in healthy volunteers has demonstrated that shear waves can be readily generated and imaged in other organs, such as the kidneys, pancreas, gastric wall, and bowel. Unlike the liver and spleen, the patterns of wave propagation in these structures are extremely complex and include significant components propagating at oblique angles relative to an axial plane of section. Given these characteristics, it is necessary to image the pattern of wave propagation in 3 dimensions and to obtain data from all 3 polarizations of motion, which requires longer imaging times. This kind of 3-D/3-axis MRE acquisition is problematic if the imaging is to be conducted during suspended respiration. One approach to this is to use respiratory gating 65, though total acquisition times can still be quite long. As an alternative, EPI-based techniques can be used to significantly reduce acquisition times. One prototype EPI MRE sequence was investigated that was capable of acquiring 12 wave images (4 phase offsets at each of 3 motion-encoding directions) with an acquisition time of 8 seconds per slice. In limited volunteer studies to date, this technique successfully generated 3-D wave data sets with typical voxel dimensions of 4 mm 66. With a 3-D extension of the inversion software, including 3-D spatial filtering 67, the preliminary results indicate that it is quite feasible to image tissue stiffness throughout a larger 3-D region of interest in the abdomen and has yielded provocative preliminary results in the pancreas and kidneys that motivate further development in these areas (Figure 6).
Figure 6.

One slice from a 3-D/3-axis abdominal MRE exam of a healthy volunteer showing excellent depictions of the liver, spleen, pancreas, and kidneys.
Influence of Perfusion on Abdominal Tissue Stiffness
Preliminary results from the study relating splenic stiffness to HVPG suggests that the stiffness of abdominal organs may have two components: a static component reflecting intrinsic structural properties and a dynamic component reflecting extrinsic perfusion changes. To investigate the influence of perfusion on the shear stiffness of abdominal organs, studies of two specific conditions of the liver and kidneys are being pursued.
Postprandial Liver Stiffness Augmentation
Food intake is known to cause an increase in mesenteric blood flow, which may lead to a postprandial increase in hepatic stiffness that is different in patients with hepatic fibrosis than in normal volunteers 68. It has been observed that MRE-assessed liver stiffness increases significantly (average increment of 18% with ranges from 5% up to 48%) following a test meal in patients with advanced hepatic fibrosis, whereas fasting and postprandial liver stiffness are similar in the normal state 68 Figure 7. This finding suggests that there is a dynamic component to the liver stiffness that is dependent on the portal pressure. Therefore, it is very important to have hepatic MRE examinations performed consistently in a fasting state. The postprandial augmentation in hepatic stiffness after a test meal known to increase mesenteric blood flow is likely due to the transiently increased portal pressure in patients with hepatic fibrosis. It is thought that mechanical distortion of the intrahepatic vasculature caused by fibrosis impairs the autoregulatory mechanism for the portal venous pressure, which may cause acceleration of the development of portal systemic varies and stretching of hepatic parenchyma and stellate cells that are instrumental in the progression of hepatic fibrosis. This promising observation provides motivation for further studies to determine the potential value of assessing postprandial hepatic stiffness augmentation for predicting progression of fibrotic disease and the development of portal varices. It may also provide new insights into the natural history and pathophysiology of chronic liver disease.
Figure 7.

Left: Examples of hepatic MRE exams performed pre- and postprandially in a normal volunteer and in a patient with cirrhotic liver. The liver stiffness in the patient with the cirrhotic liver was increased markedly in the postprandial exam. Right: A summary of the percent change in liver stiffness for healthy volunteers and patients with various stages of fibrosis. Results in 18 normal subjects demonstrated no significant change in postprandial hepatic stiffness compared with the fasting state. However, results obtained in 19 patients with hepatic fibrosis demonstrated a statistically significant increase in postprandial liver stiffness (p<0.01).
Stenotic Kidney MRE
The kidney is a richly perfused organ receiving 25% of the cardiac output. Renal occlusions, such as renal arterial stenosis (RAS), threaten the viability of the kidney by diminishing blood flow leading to irreversible tissue fibrosis and ultimately kidney failure. Preliminary research has been performed to study the impact of RAS on kidney stiffness in a porcine model of acute renal aterial stenosis 69. MRE measurements showed that the stiffness of the kidney progressively decreased as the renal artery stenosis was increased. Surprisingly, the stiffness of the contralateral kidney was observed to increase progressively. This indicates that hemodynamics can significantly affect the mechanical properties of renal parenchyma. Fibrosis is associated with elevated tissue stiffness. However, previous studies have indicated the rich perfusion of the kidney may affect its distension and, in turn, stiffness 69, 70.
In order to determine the interdependent relationship between perfusion, fibrosis and stiffness, an acute RAS model was established in adult pigs by isolating the renal artery to insert a vascular occluder and an embedded Doppler flow probe. The renal blood flow (RBF) was gradually reduced from the baseline level to total occlusion of 100% in with MRE acquisitions performed at each step. The cortex of the acutely stenotic kidney decreased in stiffness as the degree of stenosis was increased to 40% and above (p<0.05), as shown in the Figure 8. The systemic blood pressure also rose during the each decrement in the RBF (from 75±3 to 96±3 mmHg). These renal MRE preliminary results encourage further evaluation of renal hemodynamics on tissue stiffness, which may be due in part to perfusion pressure applied to the organ. These factors may play a complicating role in detecting the presence of fibrosis due to RAS, and may lead to employing new techniques to assess tissue stiffness. The use of MRE to assess changes in tissue mechanics associated with the dynamic perfusion of tissue may also provide new insights into the natural history and pathophysiology of renal diseases.
Figure 8.

An acute RAS model was established in a 45-kg adult pig by isolating the renal artery to insert a vascular occluder and an embedded Doppler flow probe. The RBF was reduced from the baseline level to 40% and then to total occlusion of 100%. The MRE-assessed renal tissue stiffness measurements demonstrated that the renal tissue stiffness decreases during gradual reductions in RBF in pigs.
Conclusion
MRE has emerged as an increasingly powerful method for noninvasively assessing the mechanical properties of soft tissues. This information can provide valuable information to clinicians and researches interested in distinguishing normal and diseased tissue, improving the diagnosis of various diseases, and monitoring the progression of disease. Numerous investigations have shown that it is readily possible to perform MRE in abdominal organs for detecting specific diseases, such as hepatic fibrosis and portal hypertension, which increase the stiffness of the liver and spleen. Other preliminary studies have demonstrated that is possible to evaluate the mechanical properties of other abdominal structures, such as the pancreas and kidneys. These results will further motivate future studies incorporating MRE to study the normal and pathological mechanics and physiology of abdominal organs.
References
- 1.Lerner RM, Huang SR, Parker KJ. “Sonoelasticity” images derived from ultrasound signals in mechanically vibrated tissues. Ultrasound Med Biol. 1990;16(3):231–239. doi: 10.1016/0301-5629(90)90002-t. [DOI] [PubMed] [Google Scholar]
- 2.Sandrin L, Tanter M, Gennisson JL, Catheline S, Fink M. Shear elasticity probe for soft tissues with 1-D transient elastography. IEEE Trans Ultrason Ferroelectr Freq Control. 2002 Apr;49(4):436–446. doi: 10.1109/58.996561. [DOI] [PubMed] [Google Scholar]
- 3.Muthupillai R, Lomas DJ, Rossman PJ, Greenleaf JF, Manduca A, Ehman RL. Magnetic resonance elastography by direct visualization of propagating acoustic strain waves. Science. 1995 Sep 29;269(5232):1854–1857. doi: 10.1126/science.7569924. [DOI] [PubMed] [Google Scholar]
- 4.Bernstein MA, Ikezaki Y. Comparison of phase-difference and complex-difference processing in phase-contrast MR angiography. J Magn Reson Imaging. 1991;1:725–729. doi: 10.1002/jmri.1880010620. [DOI] [PubMed] [Google Scholar]
- 5.Muthupillai R, Rossman PJ, Lomas DJ, Greenleaf JF, Riederer SJ, Ehman RL. Magnetic resonance imaging of transverse acoustic strain waves. Magn Reson Med. 1996 Aug;36(2):266–274. doi: 10.1002/mrm.1910360214. [DOI] [PubMed] [Google Scholar]
- 6.Huwart L, Peeters F, Sinkus R, et al. Liver fibrosis: non-invasive assessment with MR elastography. NMR Biomed. 2006 Apr;19(2):173–179. doi: 10.1002/nbm.1030. [DOI] [PubMed] [Google Scholar]
- 7.Salameh N, Peeters F, Sinkus R, et al. Hepatic viscoelastic parameters measured with MR elastography: correlations with quantitative analysis of liver fibrosis in the rat. J Magn Reson Imaging. 2007 Oct;26(4):956–962. doi: 10.1002/jmri.21099. [DOI] [PubMed] [Google Scholar]
- 8.Asbach P, Klatt D, Hamhaber U, et al. Assessment of liver viscoelasticity using multifrequency MR elastography. Magn Reson Med. 2008 Aug;60(2):373–379. doi: 10.1002/mrm.21636. [DOI] [PubMed] [Google Scholar]
- 9.Klatt D, Asbach P, Rump J, et al. In vivo determination of hepatic stiffness using steady-state free precession magnetic resonance elastography. Invest Radiol. 2006 Dec;41(12):841–848. doi: 10.1097/01.rli.0000244341.16372.08. [DOI] [PubMed] [Google Scholar]
- 10.Rouviere O, Yin M, Dresner MA, et al. MR elastography of the liver: preliminary results. Radiology. 2006 Aug;240(2):440–448. doi: 10.1148/radiol.2402050606. [DOI] [PubMed] [Google Scholar]
- 11.Yin M, Talwalkar JA, Glaser KJ, et al. Assessment of hepatic fibrosis with magnetic resonance elastography. Clinical Gastroenterology and Hepatology. 2007 Oct;5(10):1207–1213. doi: 10.1016/j.cgh.2007.06.012. [DOI] [PMC free article] [PubMed] [Google Scholar]
- 12.Venkatesh SK, Yin M, Glockner JF, et al. MR elastography of liver tumors: preliminary results. AJR Am J Roentgenol. 2008 Jun;190(6):1534–1540. doi: 10.2214/AJR.07.3123. [DOI] [PMC free article] [PubMed] [Google Scholar]
- 13.Talwalkar JA, Yin M, Venkatesh S, et al. Feasibility of in vivo MR elastographic splenic stiffness measurements in the assessment of portal hypertension. AJR Am J Roentgenol. 2009 Jul;193(1):122–127. doi: 10.2214/AJR.07.3504. [DOI] [PMC free article] [PubMed] [Google Scholar]
- 14.Yin M, Woollard J, Wang X, et al. Quantitative assessment of hepatic fibrosis in an animal model with magnetic resonance elastography. Magn Reson Med. 2007 Aug;58(2):346–353. doi: 10.1002/mrm.21286. [DOI] [PubMed] [Google Scholar]
- 15.Rump J, Klatt D, Braun J, Warmuth C, Sack I. Fractional encoding of harmonic motions in MR elastography. Magn Reson Med. 2007 Feb;57(2):388–395. doi: 10.1002/mrm.21152. [DOI] [PubMed] [Google Scholar]
- 16.Glaser KJ, Felmlee JP, Ehman RL. Rapid MR elastography using selective excitations. Magn Reson Med. 2006 Jun;55(6):1381–1389. doi: 10.1002/mrm.20913. [DOI] [PubMed] [Google Scholar]
- 17.Sinkus R, Tanter M, Catheline S, et al. Imaging anisotropic and viscous properties of breast tissue by magnetic resonance-elastography. Magn Reson Med. 2005 Feb;53(2):372–387. doi: 10.1002/mrm.20355. [DOI] [PubMed] [Google Scholar]
- 18.Maderwald S, Uffmann K, Galban CJ, de Greiff A, Ladd ME. Accelerating MR elastography: a multiecho phase-contrast gradient-echo sequence. J Magn Reson Imaging. 2006 May;23(5):774–780. doi: 10.1002/jmri.20570. [DOI] [PubMed] [Google Scholar]
- 19.Bieri O, Maderwald S, Ladd ME, Scheffler K. Balanced alternating steady-state elastography. Magn Reson Med. 2006 Feb;55(2):233–241. doi: 10.1002/mrm.20812. [DOI] [PubMed] [Google Scholar]
- 20.Huwart L, Salameh N, ter Beek L, et al. MR elastography of liver fibrosis: preliminary results comparing spin-echo and echo-planar imaging. Eur Radiol. 2008 Nov;18(11):2535–2541. doi: 10.1007/s00330-008-1051-5. [DOI] [PubMed] [Google Scholar]
- 21.Manduca A, Lake DS, Kruse SA, Ehman RL. Spatio-temporal directional filtering for improved inversion of MR elastography images. Medical Image Analysis. 2003;7:465–473. doi: 10.1016/s1361-8415(03)00038-0. [DOI] [PubMed] [Google Scholar]
- 22.Manduca A, Muthupillai R, Rossman PJ, Greenleaf JF, Ehman RL. Visualization of tissue elasticity by magnetic resonance elastography. In: Hones K, Kinikis R, editors. Visualization in Biomedical Computing. Springer; 1996. pp. 63–68. [Google Scholar]
- 23.Manduca A, Oliphant TE, Dresner MA, et al. Magnetic resonance elastography: non-invasive mapping of tissue elasticity. Medical Image Analysis. 2001;5(4):237–254. doi: 10.1016/s1361-8415(00)00039-6. [DOI] [PubMed] [Google Scholar]
- 24.Chen Q, Ringleb SI, Manduca A, Ehman RL, An KN. A finite element model for analyzing shear wave propagation observed in magnetic resonance elastography. J Biomech. 2005 Nov;38(11):2198–2203. doi: 10.1016/j.jbiomech.2004.09.029. [DOI] [PubMed] [Google Scholar]
- 25.Chen Q, Ringleb SI, Manduca A, Ehman RL, An KN. Differential effects of pre-tension on shear wave propagation in elastic media with different boundary conditions as measured by magnetic resonance elastography and finite element modeling. J Biomech. 2006;39(8):1428–1434. doi: 10.1016/j.jbiomech.2005.04.009. [DOI] [PubMed] [Google Scholar]
- 26.Kruse SA, Rose GH, Glaser KJ, et al. Magnetic resonance elastography of the brain. Neuroimage. 2008 Jan 1;39(1):231–237. doi: 10.1016/j.neuroimage.2007.08.030. [DOI] [PMC free article] [PubMed] [Google Scholar]
- 27.Green MA, Bilston LE, Sinkus R. In vivo brain viscoelastic properties measured by magnetic resonance elastography. NMR Biomed. 2008 Aug;21(7):755–764. doi: 10.1002/nbm.1254. [DOI] [PubMed] [Google Scholar]
- 28.Sack I, Beierbach B, Hamhaber U, Klatt D, Braun J. Non-invasive measurement of brain viscoelasticity using magnetic resonance elastography. NMR Biomed. 2008 Mar;21(3):265–271. doi: 10.1002/nbm.1189. [DOI] [PubMed] [Google Scholar]
- 29.McKnight AL, Kugel JL, Rossman PJ, Manduca A, Hartmann LC, Ehman RL. MR elastography of breast cancer: preliminary results. AJR Am J Roentgenol. 2002 Jun;178(6):1411–1417. doi: 10.2214/ajr.178.6.1781411. [DOI] [PubMed] [Google Scholar]
- 30.Van Houten EE, Doyley MM, Kennedy FE, Weaver JB, Paulsen KD. Initial in vivo experience with steady-state subzone-based MR elastography of the human breast. J Magn Reson Imaging. 2003 Jan;17(1):72–85. doi: 10.1002/jmri.10232. [DOI] [PubMed] [Google Scholar]
- 31.Sinkus R, Siegmann K, Xydeas T, Tanter M, Claussen C, Fink M. MR elastography of breast lesions: understanding the solid/liquid duality can improve the specificity of contrast-enhanced MR mammography. Magn Reson Med. 2007 Dec;58(6):1135–1144. doi: 10.1002/mrm.21404. [DOI] [PubMed] [Google Scholar]
- 32.Plewes DB, Bishop J, Samani A, Sciarretta J. Visualization and quantification of breast cancer biomechanical properties with magnetic resonance elastography. Phys Med Biol. 2000 Jun;45(6):1591–1610. doi: 10.1088/0031-9155/45/6/314. [DOI] [PubMed] [Google Scholar]
- 33.Kolipaka A, McGee KP, Araoz PA, et al. MR elastography as a method for the assessment of myocardial stiffness: Comparison with an established pressure-volume model in a left ventricular model of the heart. Magn Reson Med. 2009 Apr 7;62(1):135–140. doi: 10.1002/mrm.21991. [DOI] [PMC free article] [PubMed] [Google Scholar]
- 34.Sack I, Rump J, Elgeti T, Samani A, Braun J. MR elastography of the human heart: noninvasive assessment of myocardial elasticity changes by shear wave amplitude variations. Magn Reson Med. 2009 Mar;61(3):668–677. doi: 10.1002/mrm.21878. [DOI] [PubMed] [Google Scholar]
- 35.McGee KP, Hubmayr RD, Ehman RL. MR elastography of the lung with hyperpolarized 3He. Magn Reson Med. 2008 Jan;59(1):14–18. doi: 10.1002/mrm.21465. [DOI] [PubMed] [Google Scholar]
- 36.Ringleb SI, Chen Q, Lake DS, Manduca A, Ehman RL, An KN. Quantitative shear wave magnetic resonance elastography: comparison to a dynamic shear material test. Magn Reson Med. 2005 May;53(5):1197–1201. doi: 10.1002/mrm.20449. [DOI] [PubMed] [Google Scholar]
- 37.Talwalkar JA, Yin M, Fidler JL, Sanderson SO, Kamath PS, Ehman RL. Magnetic resonance imaging of hepatic fibrosis: emerging clinical applications. Hepatology. 2008 Jan;47(1):332–342. doi: 10.1002/hep.21972. [DOI] [PubMed] [Google Scholar]
- 38.Shah NS, Kruse SA, Lager DJ, et al. Evaluation of renal parenchymal disease in a rat model with magnetic resonance elastography. Magn Reson Med. 2004 Jul;52(1):56–64. doi: 10.1002/mrm.20101. [DOI] [PubMed] [Google Scholar]
- 39.Yin M, Venkatesh SK, Grimm RC, Rossman PJ, Manduca A, Ehman RL. Assessment of the pancreas with MR elastography. Paper presented at: Proceedings of the International Society for Magnetic Resonance in Medicine; May 3–9, 2008; Toronto, Canada. p. 2627. [Google Scholar]
- 40.Yin M, Rossman PJ, Manduca A, Ehman RL. MR Elastography of Abdominal Organs. Paper presented at: Proceedings of ISMRM Flow and Motion Study Group Workshop; July 16, 2006; New York. [Google Scholar]
- 41.Schuppan D, Popov Y. Hepatic fibrosis: from bench to bedside. J Gastroenterol Hepatol. 2002 Dec;17( Suppl 3):S300–305. doi: 10.1046/j.1440-1746.17.s3.18.x. [DOI] [PubMed] [Google Scholar]
- 42.Tsukada S, Parsons CJ, Rippe RA. Mechanisms of liver fibrosis. Clin Chim Acta. 2006 Feb;364(1–2):33–60. doi: 10.1016/j.cca.2005.06.014. [DOI] [PubMed] [Google Scholar]
- 43.Friedman SL. Liver fibrosis -- from bench to bedside. J Hepatol. 2003;38( Suppl 1):S38–53. doi: 10.1016/s0168-8278(02)00429-4. [DOI] [PubMed] [Google Scholar]
- 44.Kim WR, Brown RS, Jr, Terrault NA, El-Serag H. Burden of liver disease in the United States: summary of a workshop. Hepatology. 2002 Jul;36(1):227–242. doi: 10.1053/jhep.2002.34734. [DOI] [PubMed] [Google Scholar]
- 45.Shaheen NJ, Hansen RA, Morgan DR, et al. The burden of gastrointestinal and liver diseases, 2006. Am J Gastroenterol. 2006 Sep;101(9):2128–2138. doi: 10.1111/j.1572-0241.2006.00723.x. [DOI] [PubMed] [Google Scholar]
- 46.Davis GL, Albright JE, Cook SF, Rosenberg DM. Projecting future complications of chronic hepatitis C in the United States. Liver Transplantation. 2003;9(4):331–338. doi: 10.1053/jlts.2003.50073. [DOI] [PubMed] [Google Scholar]
- 47.Charlton M. Nonalcoholic fatty liver disease: a review of curent understanding and future impact. Clin Gastroenterol Hepatol. 2004;2:1048–1058. doi: 10.1016/s1542-3565(04)00440-9. [DOI] [PubMed] [Google Scholar]
- 48.Fowell AJ, Iredale JP. Emerging therapies for liver fibrosis. Dig Dis. 2006;24(1–2):174–183. doi: 10.1159/000090320. [DOI] [PubMed] [Google Scholar]
- 49.Friedman SL, Bansal MB. Reversal of hepatic fibrosis -- fact or fantasy? Hepatology. 2006 Feb;43(2 Suppl 1):S82–88. doi: 10.1002/hep.20974. [DOI] [PubMed] [Google Scholar]
- 50.Knodell RG, Ishak KG, Black WC, et al. Formulation and application of a numerical scoring system for assessing histological activity in asymptomatic chronic active hepatitis. Hepatology. 1981 Sep-Oct;1(5):431–435. doi: 10.1002/hep.1840010511. [DOI] [PubMed] [Google Scholar]
- 51.Demiray H. Viscoelastic model for aterial wall materials. Int J Eng Sci. 1994;32(10):1567–1578. [Google Scholar]
- 52.Ratziu V, Charlotte F, Heurtier A, et al. Sampling variability of liver biopsy in nonalcoholic fatty liver disease. Gastroenterology. 2005 Jun;128(7):1898–1906. doi: 10.1053/j.gastro.2005.03.084. [DOI] [PubMed] [Google Scholar]
- 53.Bravo AA, Sheth SG, Chopra S. Liver biopsy. N Engl J Med. 2001;344:495–500. doi: 10.1056/NEJM200102153440706. [DOI] [PubMed] [Google Scholar]
- 54.Salameh N, Larrat B, Abarca-Quinones J, et al. Early Detection of Steatohepatitis in Fatty Rat Liver by Using MR Elastography. Radiology. 2009 Jul 8; doi: 10.1148/radiol.2523081817. [DOI] [PubMed] [Google Scholar]
- 55.Huwart L, Sempoux C, Vicaut E, et al. Magnetic resonance elastography for the noninvasive staging of liver fibrosis. Gastroenterology. 2008 Jul;135(1):32–40. doi: 10.1053/j.gastro.2008.03.076. [DOI] [PubMed] [Google Scholar]
- 56.Yin M, Rouviere O, Glaser KJ, Ehman RL. Diffraction-biased shear wave fields generated with longitudinal magnetic resonance elastography drivers. Magn Reson Imaging. 2008 Jul;26(6):770–780. doi: 10.1016/j.mri.2008.01.019. [DOI] [PMC free article] [PubMed] [Google Scholar]
- 57.Papazoglou S, Hamhaber U, Braun J, Sack I. Algebraic Helmholtz inversion in planar magnetic resonance elastography. Phys Med Biol. 2008 Jun 21;53(12):3147–3158. doi: 10.1088/0031-9155/53/12/005. [DOI] [PubMed] [Google Scholar]
- 58.Yin M, Glaser JK, Talwalkar JA, Manduca A, Ehman RL. Validity of a 2-D Wave Field Model in MR Elastography of the Liver. Paper presented at: Proceedings of the International Society for Magnetic Resonance in Medicine; April 18–24, 2009; Honolulu, Hawaii, USA. p. 709. [Google Scholar]
- 59.Huwart L, Sempoux C, Salameh N, et al. Liver fibrosis: Noninvasive assessment with MR elastography versus aspartate aminotransferase-to-platelet ratio index. Radiology. 2007 Nov;245(2):458–466. doi: 10.1148/radiol.2452061673. [DOI] [PubMed] [Google Scholar]
- 60.Klatt D, Asbach P, Rump J, et al. In vivo determination of hepatic stiffness using steady-state free precision magnetic resonance elastography. Investigative Radiology. 2006;41(12):841–848. doi: 10.1097/01.rli.0000244341.16372.08. [DOI] [PubMed] [Google Scholar]
- 61.Klatt D, Hamhaber U, Asbach P, Braun J, Sack I. Noninvasive assessment of the rheological behavior of human organs using multifrequency MR elastography: a study of brain and liver viscoelasticity. Phys Med Biol. 2007;52:7281–7294. doi: 10.1088/0031-9155/52/24/006. [DOI] [PubMed] [Google Scholar]
- 62.Sandrin L, Fourquet B, Hasquenoph JM, et al. Transient elastography: a new noninvasive method for assessment of hepatic fibrosis. Ultrasound Med Biol. 2003 Dec;29(12):1705–1713. doi: 10.1016/j.ultrasmedbio.2003.07.001. [DOI] [PubMed] [Google Scholar]
- 63.Ziol M, Handra-Luca A, Kettaneh A, et al. Noninvasive assessment of liver fibrosis by measurement of stiffness in patients with chronic hepatitis C. Hepatology. 2005 Jan;41(1):48–54. doi: 10.1002/hep.20506. [DOI] [PubMed] [Google Scholar]
- 64.Venkatesh SK, Yin M, Glockner JF, et al. Magnetic resonance elastography of liver tumors - preliminary results. AJR. 2008;190:1534–1540. doi: 10.2214/AJR.07.3123. [DOI] [PMC free article] [PubMed] [Google Scholar]
- 65.Ehman RL, McNamara MT, Pallack M, Hricak H, Higgins CB. Magnetic resonance imaging with respiratory gating: techniques and advantages. AJR. 1984 Dec;143(6):1175–1182. doi: 10.2214/ajr.143.6.1175. [DOI] [PubMed] [Google Scholar]
- 66.Yin M, Grimm RC, Manduca A, Ehman RL. Rapid EPI-based MR elastography of the liver. Paper presented at: Proceedings of the International Society for Magnetic Resonance in Medicine; May 6–12, 2006; Seattle, Washington. p. 2268. [Google Scholar]
- 67.Yin M, Manduca A, Romano AJ, et al. 3-D local frequency estimation inversion for abdominal MR elastography. Paper presented at: Proceedings of the International Society for Magnetic Resonance in Medicine; May 19–25, 2007; Berlin, Germany. p. 960. [Google Scholar]
- 68.Yin M, Talwalkar JA, Venkatesh SK, Ehman RL. MR Elastography of Dynamic Postprandial Hepatic Stiffness Augmentation in Chronic Liver Disease. Paper presented at: Proceedings of the International Society for Magnetic Resonance in Medicine; April 18–24, 2009; Honolulu, Hawaii, USA. p. 110. [Google Scholar]
- 69.Warner L, Yin M, Ehman RL, Lerman LO. Kidney stiffness measured in an animal model of unilateral renal arterial stenosis using 2-D MR Elastography. Paper presented at: Proceedings of the International Society for Magnetic Resonance in Medicine; April 18–24, 2009; Honolulu, Hawaii, USA. p. 407. [Google Scholar]
- 70.Yin M, Warner L, Lerman LO, Manduca A, Ehman RL. Assessment of kidney stiffness in a swine model of renal arterial stenosis with 3-D MR Elastography. Paper presented at: Proceedings of the International Society for Magnetic Resonance in Medicine; April 18–24, 2009; Honolulu, Hawaii, USA. p. 2042. [Google Scholar]