

Abstract
The development of morphological biosignatures to precisely characterize pre-neoplastic progression necessitates high resolution 3D cell imagery and robust image processing algorithms. We report on the quantitative characterization of nuclear structure alterations associated with pre-neoplastic progression in human esophageal epithelial cells using single cell optical tomography and fully automated 3D karyometry. We stained cultured cells with hematoxylin and generated 3D images of individual cells by mathematically reconstructing 500 projection images acquired using optical absorption tomographic imaging. For 3D karyometry, we developed novel, fully-automated algorithms to robustly segment the cellular, nuclear and sub-nuclear components in the acquired cell images, and computed forty one quantitative morphological descriptors from these segmented volumes. In addition, we developed algorithms to quantify the spatial distribution and texture of the nuclear DNA. We applied our methods to normal, metaplastic, and dysplastic human esophageal epithelial cell lines, analyzing one hundred cells per line. The 3D karyometric descriptors elucidated quantitative differences in morphology and enabled robust discrimination between cell lines on the basis of extracted morphological features. The morphometric hallmarks of cancer progression such as increased nuclear size, elevated nuclear content and anomalous chromatin texture and distribution correlated with this pre-neoplastic progression model, pointing to the clinical utility of our method for early cancer detection.
Key Terms: Pre-neoplastic progression, Barrett’s esophagus, esophageal cancer, single cell, computed tomography, 3D karyometry, image processing
Introduction
Nuclear architecture is a key factor in cell functioning and pathogenesis (1). The functional relevance of nuclear structure in many core cell processes necessitates detailed studies on the interplay between nuclear architecture and functions like gene expression. One of the most important applications of 3D karyometric studies is the quantitative characterization of the morphological changes associated with malignancy. Alterations in nuclear structure hold high clinical and research relevance, especially in the context of early cancer detection (2,3). While much remains to be learned about the molecular mechanisms that drive cancer related alterations in nuclear structure and the higher order spatial organization of chromatin, accurate quantification of structural parameters could be beneficial for developing robust biosignatures for early cancer detection.
Rapid advances in automation sciences and imaging technologies have facilitated the use of computer-aided karyometry, where sets of morphological descriptors (referred to as morphometric signatures) are extracted from microscopy images using digital image processing algorithms. Morphometric signatures generated from a statistically significant number of cells may then be used to predict malignancy by means of pattern recognition techniques. Extensive research has been undertaken in this field, and a multitude of karyometric signatures have been proposed to characterize nuclear structure alterations associated with carcinogenesis (4–7). Automated computer-aided karyometry allows for an objective and high throughput quantitative characterization of nuclear structure. However, the imagery currently used for computer-aided karyometry consists of 2D micrographs (8–18) or serial section reconstructions of multiple focal planes (19–22). The quality of this input data, and therefore the sensitivity and specificity of the resulting decisions, are limited by factors such as focal plane location and sample orientation, the planar nature of the sample (cells adhered to a glass slide), occurrence of overlapping cells, and non-isotropic spatial resolution.
Tomographic imaging overcomes these limitations. For precise analysis of nuclear structure, 3D image data is much more powerful than its 2D counterpart. The advantages of tomographic imaging for early lung cancer detection have begun to be realized (23). The power of 3D imagery can only be accessed by employing true 3D image processing techniques. While there is a consensus in the cancer pathology research community on the value of 3D karyometry, the image processing and analysis methods employed for this procedure are still largely based on the processing of separate 2D slices followed by a combination of the signatures extracted from planes in three orthogonal directions.
Here we report on a novel method that applies optical tomographic imaging with isotropic, sub-cellular resolution and automated 3D karyometry to compute nuclear morphometric signatures of cultured normal and pre-neoplastic cells. We perform tomographic imaging of individual eukaryotic cells and use the reconstructed 3D cell images for quantitative morphometric analysis. We apply fast, novel image processing techniques to robustly segment the volumes of interest in the reconstructed 3D images and extract quantitative morphometric descriptors (or features) from the segmented image. Our techniques exploit the power of true 3D image processing rather than a slice-based approach. We do not use any a priori information on shape or size. We automated the entire image processing sequence to facilitate high throughput analysis.
As an application of our methods, we demonstrate the existence of quantifiable morphometric variations associated with pre-neoplastic progression in human esophageal epithelium - a cytological manifestation resulting from a condition referred to as Barrett’s Esophagus (BE) (24). BE is commonly characterized by the existence of polyploid cell populations that exhibit a variety of genetic alterations (25). Since clinically the condition is allowed to progress through metaplasia and different degrees of dysplasia without surgical intervention(“watchful waiting”), it serves as an excellent model to understand relationships between genetic and cell cycle anomalies (26). However, very little is known about the morphological correlates of these genetic abnormalities. We applied the developed image processing sequence to analyze cells from normal, metaplastic, and dysplastic esophageal epithelial cell lines that are representative of the neoplastic progression in BE and evaluated the efficacy of the extracted features in differentiating between the cell lines. The approach we present is applicable to any cell type that can be optimally stained for absorption light microscopy. To the best of our knowledge, this method is the first quantitative characterization of pre-neoplastic progression using single cell computed tomography and automated 3D karyometry.
Materials and Methods
Cell culture
For our experiments, we used one normal and two pre-neoplastic cell lines derived from human esophageal biopsies. The normal variant is referred to as EPC2-hTERT (referred to as EPC2 henceforth), derived from human esophagus (27), and abnormal variants are CP-A, derived from metaplastic, distal human esophagus, and CP-D, derived from a region of high-grade dysplasia (28). Upon derivation cytogenetic analysis of the CP-A cell line showed 11.6% 4N fraction, deleted CDKN2A (p16), wild-type p53, and loss of heterozygosity (LOH) in chromosomes 9p and 5q (28). Analysis of the CP-D cell line showed 19.8% 4N fraction, deleted p16, a single base pair deletion in TP53 codon 302, and 9p and 17p LOH. The EPC2 cells were found to have no mutations in either p16 or p53 (27). The immortalized cell lines were karyotypically similar to their in-vivo counterparts.
Immortalized human esophageal epithelial cells were cultured in GIBCO defined Keratinocyte-serum free medium 1X (Invitrogen, Carlsbad, CA). The medium was supplemented with Bovine Pituitary Extract (Invitrogen) and human recombinant Epidermal Growth Factor (Invitrogen) prior to cell culture. Cells were grown as a monolayer in 25-cm2 flasks with vented caps (BD Falcon, San Jose, CA). Cells were maintained in a humidified incubator at 37°C and 5% CO2. Prior to experiments, adherent cells in a logarithmic growth phase were released with 0.05% trypsin (Trypsin EDTA 1X solution, Mediatech, Manassas, VA). To minimize the cells’ exposure to trypsin, it was neutralized using medium containing keratinocyte-serum as soon as cells detached from the bottom of the cell culture flask (after three to ten minutes depending on cell type). The cells were then immediately fixed as a first step in sample preparation for tomographic imaging.
Sample Preparation
For our slide-based cell preparation and staining, we fixed the cells with CytoLyt (Cytyc, Malborough, MA) and smeared them onto a microscope glass slide (VWR, West Chester, PA) coated with 0.01% Poly-L-Lysine (PLL) (Sigma Aldrich, St. Louis, MO). Prior to coating with PLL the slide was washed with 2% Decon Neutrad liquid detergent (Fisher Scientific, Fair Lawn, NJ), then rinsed with de-ionized water. We stained the cells for a few minutes (cell line dependent) in aqueous 6.25% w/w Gill’s hematoxylin (Electron Microscopy Sciences, Hatfield, PA) solution, followed by bluing reagent (Fisher Scientific, Fair Lawn, NJ) for 30 seconds after washing thrice with filtered tap water. After dehydration through an ethanol series (50%, 95%, and 100%) and two washes with 100% xylene, the hematoxylin staining produces a dark blue nucleus and a lighter cytoplasm. Optimal staining is the key to tomographic imaging of cells. Since proper staining is highly dependent on experimental conditions (including pH of the water used), we carried out multiple trials to optimize the concentrations of reagents and durations of protocol steps. The stained cells were finally embedded into a special carrier gel (Smart Gel, Nye Lubricants, Fairhaven, MA) and the resulting mixture was loaded into a glass syringe (Hamilton, Reno, NV) for tomographic imaging.
Image acquisition and 3D reconstruction
We performed optical tomographic imaging of individual, eukaryotic, hematoxylin-stained cells using a computed tomography (CT) instrument (VisionGate, Gig Harbor, WA). The cell CT instrument provides isotropic spatial resolution of 350 nm, circumventing viewing angle and depth of field limitations (Supplementary Material). Cells were imaged sequentially by flowing them in a carrier gel through a rotating glass capillary. Operator-based, manual cell selection was performed to ensure that only well-stained, intact cells with interphase nuclei were imaged. For each selected cell, five hundred projection images were acquired at uniform angular intervals of 0.72 degrees during a full 360° rotation of the capillary. Projection image acquisition took one minute per cell. The carrier gel enabled transport of cells through the capillary and supported them, preventing tumbling and drift, as the capillary was rotated. After projection acquisition, a spatially registered stack of well-focused images spanning the entire cell was acquired for subsequent 2D image analysis. The imaged cell was finally transported to a waste reservoir by pressurization of the gel-filled syringe, and the next cell was advanced into the field of view.
The acquired projection images were used to reconstruct the 3D image of each cell using a filtered back-projection algorithm (29). All projections were de-noised and aligned prior to reconstruction to remove pattern noise artifacts and to compensate for mechanical jitter and runout of the capillary, respectively. One hundred cells from each cell line were imaged and the tomographically reconstructed 3D cell images were used for quantitative morphometric analysis.
3D image processing and feature extraction
To achieve high throughput analysis we used Matlab software (Mathworks, Natick, MA) to automate the 3D image processing sequence. The voxel resolution of our analysis modules was equal to the imaging system resolution of 350 nm.
Segmentation
We developed robust, fully-automated image processing techniques to segment the volumes of interest (VOIs) in the 3D cell images and subsequently extract several quantitative morphometric descriptors from the segmented images. The three analyzed VOIs were the cell, the nucleus, and hyperdense agglomerations of DNA within the nucleus, including the nucleoli. In this paper, we refer to this third VOI loosely as nucleoli. We note that the term “nucleoli” in this context may include dense agglomerations of DNA, which are not nucleoli, as well. Due to the nonspecific nature of hematoxylin staining, it is not possible by hematoxylin staining alone to distinguish true nucleoli from dense DNA microstructures.
A wide spectrum of 3D segmentation techniques with varying degrees of complexity, accuracy and operator intervention have been proposed. Our choices of segmentation algorithms were based on the strong contrast between the VOIs produced by optimal hematoxylin staining and the requirements for complete automation and high throughput. The high affinity of the stain for DNA allows reliable differentiation between the nucleus and the cytoplasm. The hematoxylin also provides sufficient contrast between the cytoplasm and the background by virtue of its affinity for basophilic substances in the cytoplasm. The strong absorption contrast conferred on cells by the stain made our segmentation technique inherently robust to background noise in the image. We extracted VOIs from the 3D images using a combination of adaptive thresholding and gradient-based algorithms that generated gray-level intensity thresholds. We achieve fast, robust 3D segmentation by calculating the intensity thresholds from three orthogonal Maximum Intensity Projection (MIP) images of the 3D volume. MIP images are usually used for visualization, but we exploited their high Signal to Noise Ratio (SNR) to facilitate robust 3D segmentation. After deriving the intensity thresholds from the MIPs, we applied them to the 3D volume in conjunction with connectivity and minimum VOI volume constraints.
For each MIP image, the segmentation technique involved three major steps. We first calculated the threshold intensity corresponding to the cell membrane using the technique proposed by Rosin (30). We found this technique to be appropriate given the predominantly unimodal nature of the image histogram (most voxels are in the background). We computed the threshold intensity for the nuclear membrane using a gradient-based approach. This approach was motivated by the high contrast rendered by the hematoxylin stain. We calculated the gradient magnitude image from the x- and y- gradients and then thresholded it at the value corresponding to the strongest gradient. The nuclear membrane boundary was determined from the thresholded image and the membrane threshold intensity was taken as the average of all the pixels in the computed boundary. Lastly, we obtained the threshold intensity corresponding to nucleoli by applying the Otsu method (31) to the inverted intensity image of the segmented nucleus, since it exhibited a strongly bimodal histogram. The minimum of the three computed thresholds for each VOI (one from each of the three MIP images) was chosen to be the intensity threshold for the VOI in the volumetric cell image. The choice of minima was motivated by the physics of MIP image formation which preserves the strongest intensity value along each ray traversing the image volume. We generated segmentation masks for the cell, the nucleus and the nucleoli by applying the corresponding threshold intensities to the entire image volume. We derived the 3D mask geometry by applying a connected component labeling algorithm with 26-connectivity constraint. The computed segmentation masks were applied to the 3D cell image to delineate the VOIs.
Feature extraction
We computed a total of forty one morphological and textural features for each cell based on established formulae extended to three dimensions as appropriate (9,20,32). These features are enumerated in Table 1. We chose these features for their intuitive correlation to nuclear structure by biologists and cytopathologists. We used three types of texture features: statistical, discrete and Markovian. While the computation of statistical and discrete texture features is standardized, there are multiple approaches to derive Markovian features. We computed the Markovian texture features using the popular co-occurrence matrix method developed by Haralick (33). For each volume of interest, we computed 26 gray level co-occurrence matrices (GLCM), corresponding to the 26 directions around a voxel, and averaged the results so as to obtain one representative value per VOI for every computed Markovian feature. The GLCM dimension was 256 × 256, corresponding to the gray level range in our 3D imagery. The GLCMs were computed along 26 directions around the center of mass of the segmented nucleus. The voxel offset (‘d’) dictates the granularity of the texture being computed. While textural variations can occur for a range of voxel offsets, our objective was to capture coarse textural variations in the chromatin organization. Since the nucleolar compartment consists of the largest dense blobs within the nucleus, we chose a voxel offset (‘d’) value of eight, equal to the largest average nucleolus width among the cell lines (occurred in CP-A). The morphological and textural feature data computed for each cell line was automatically stored in spreadsheet files (Microsoft Excel).
Table 1.
Morphometric features
| Feature type | Feature specifics* |
|---|---|
| Morphological (8) | cell volume, nuclear volume, nucleus to cytoplasm volume ratio, number of nucleoli, total nucleolar volume, mean nucleolar volume, mean nucleolar margination (from nucleus center), nuclear sphericity |
| Descriptive texture (5) | integrated optical density, mean optical density, variance in optical density, skew in optical density, kurtosis in optical density |
| Discrete texture (24) | number of objects in low, medium and high DNA condensation states (3), volume fraction of each condensation state (3), optical density fraction of each condensation state (3), average extinction ratio of each condensation state (3), compactness of each condensation state (4), average distance of voxels in each condensation state from nucleus center (4), average distance of center of each condensation state from the nucleus center (4) |
| Markovian texture (4) | energy, contrast, correlation, homogeneity |
Numbers in parentheses indicate the number of features of a given type
Data analysis
We used Origin 8.0 software (OriginLab, Northampton, MA) to statistically characterize distributions of the extracted 3D nuclear morphometric feature data, and to compute histograms revealing quantitative differences between corresponding features in different cell lines. For each cell line we computed the mean and standard deviation of each feature metric to readily comprehend how the features varied among the three cell lines.
Results
Segmentation
The segmentation results superimposed on the MIP images are shown in figure 1. The cell boundary is shown in cyan, the nuclear boundary in red, and the nucleolar outlines in green. The computed thresholds are indicated on the linescan of figure 1(h). The computed boundaries closely approximate the apparent object boundaries. To qualitatively evaluate the performance of our segmentation techniques, algorithmically computed volumes were compared to results of manual segmentation for a random subset of the cell images. Manual segmentation of selected cell volumes was performed by a single operator using Volview software (Kitware, Clifton Park, NY). The automatically-computed and manually-delineated nuclear volumes were observed to be most comparable, while the largest disparity was observed between nucleolar volumes. Nucleolar volumes tended to be slightly underestimated, and cell volumes slightly overestimated by the automated segmentation method. The observed trends in segmentation performance were similar in cell images from all three lines.
Figure 1.
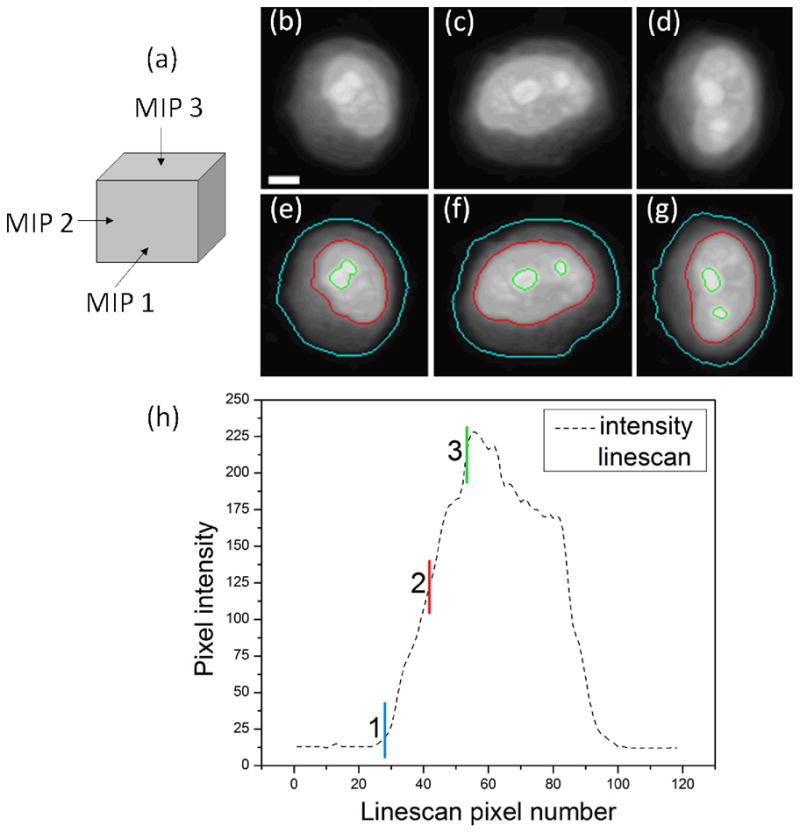
Segmentation results. (a) depicts the directions along which the MIP images were computed. (b)–(d) are the three computed MIP images and (e)–(g) are the corresponding segmentation results superimposed on the MIP images. In (e)–(g), the cell membrane is depicted in cyan, the nuclear membrane in red and the nucleolar boundaries in green. (h) illustrates the thresholds’ relationship to a selected intensity linescan. Scale bar = 3μm.
Morphological characterization of cell lines
Morphological features directly correlate with the physical structure of cells and the spatial relationships among sub-cellular components. Our nuclear texture features reflect the spatial organization of chromatin. We used three types of texture features to quantify chromatin texture. Statistical features indicate the distribution of nuclear DNA with respect to density and location. Discrete texture features characterize the uniformity of DNA distribution within the nucleus. Markovian texture features quantify the degree of spatial correlation between gray-level values and reflect the directional organization of nuclear DNA. Significant differences were observed in the morphology and nuclear DNA organization between normal, metaplastic and dysplastic cells. A representative volume rendering of one cell from each line is shown in figure 2. Quantitative analysis of the feature data from one hundred images of each cell line revealed statistical variations between the cell lines. Histograms of selected morphometric features are illustrated in figure 3. Statistics of these features are detailed in Table 2. From the computed histograms, we observe the following morphometric hallmarks of pre-neoplastic progression: increased nuclear size (Fig. 3b), increased nucleus to cytoplasm volume ratio (N/C) (Fig. 3c), and elevated nuclear content (Fig. 3d). These features increase consistently in the order: EPC2 (normal) < CP-A (metaplastic) < CP-D (dysplastic), with the largest differences, especially in nuclear content, between metaplasia and dysplasia. A similar trend is observed in the cell size (Fig. 3a). In figure 3e, EPC2 nuclei are closest to spherical amongst all three cell types. The relatively larger sphericity variance in CP-A and CP-D compared to EPC2 cells suggests increased shape heterogeneity in the abnormal cell populations. Notable differences exist in total nucleolar volumes between the cell types (Fig. 3f), with abnormal cell types exhibiting increased nucleolar content. The average distance of the nucleoli from the nuclear center of mass (nucleolar margination; Fig. 3g) increases considerably in CP-A (1.55 μm) and even more in CP-D cells (2.24 μm) compared to EPC2 (1.12 μm). The heterogeneity (relatively large standard deviation) of this feature in CP-A cells is noteworthy. It suggests, among the metaplastic cell population, the existence of a sub-population progressing toward dysplasia. The significant nucleolar margination in the CP-D cell line points toward repositioning of the nucleoli close to the nuclear periphery as cells transform from normal to high-grade dysplasia.
Figure 2.
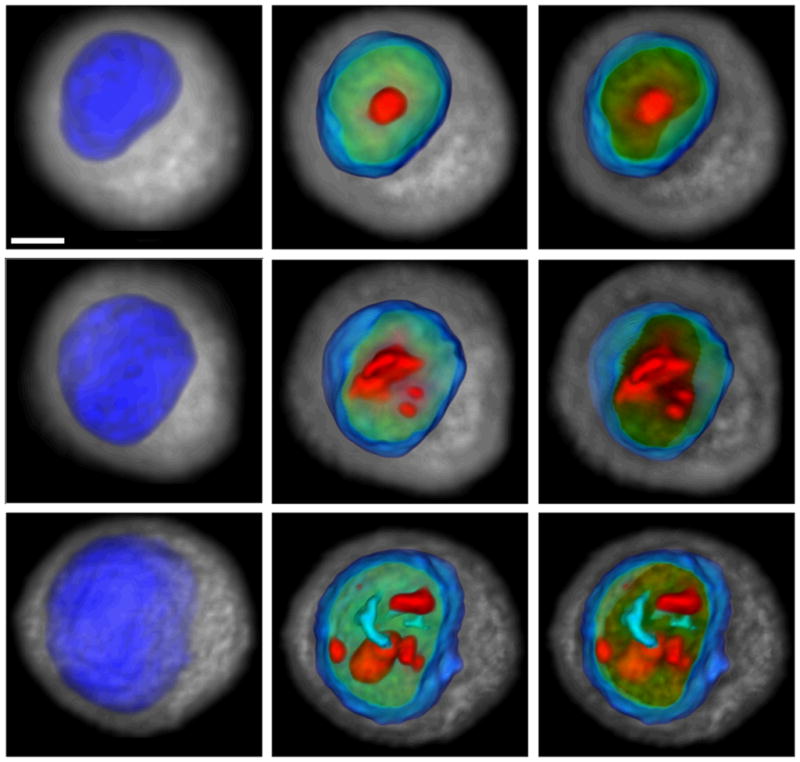
Representative volume renderings of EPC2 (top), CP-A (middle) and CP-D (bottom) esophageal epithelial cells reflect distinct morphological variations that occur through the course of pre-neoplastic progression. EPC2 cells are normal epithelial cells, CP-A cells are metaplastic, and CP-D cells are dysplastic. Left images show nuclear surface in blue and cytoplasm in gray, middle images illustrate nuclear interior, and right images depict slab through the cell volume. Increasing DNA density is color coded from green to red. Scale bar = 3μm.
Figure 3.

Feature histograms reveal quantitative differences between EPC2, CP-A, and CP-D cell lines (N = 100 cells per line). Histograms were generated from morphological features computed from 3D cell images. EPC2 cell line represents normal epithelial cells, CP-A cell line represents metaplasia, and CP-D cell line represents high-grade dysplasia. One hundred 3D cell images of each cell type were used for the analysis. Forty one features were computed using automated 3D image processing. Significant variation is observed in the computed morphological features. Abnormal cells are characterized by (a) increased cell size, (b) increased nuclear size, (c) increased nucleus to cytoplasm (N/C) volume ratio, (d) increased nuclear content, (e) greater deviation from sphericity, (f) increased nucleolar volumes, (g) increased margination of nucleoli towards the nuclear periphery, (h) higher number of high density DNA clumps in the nucleus, and (i – l) increased textural variations in the chromatin distribution.
Table 2.
Descriptive statistics of selected features
| Feature name | Units | Statistics of computed morphometrics (N=100) | |||||
|---|---|---|---|---|---|---|---|
| EPC2 | CP-A | CP-D | |||||
| μa | σb | μ | σ | μ | σ | ||
| Cell volume | μm3 | 1010 | 321 | 1173 | 249 | 1803 | 787 |
| Nuclear volume | μm3 | 163 | 51 | 209.41 | 67.84 | 432 | 188 |
| N/C volume ratio | - | 0.20 | 0.03 | 0.22 | 0.07 | 0.33 | 0.10 |
| Nuclear content | a.u. | 113 | 35 | 146 | 47 | 299 | 130 |
| Nuclear sphericity | - | 1.27 | 0.06 | 1.33 | 0.09 | 1.31 | 0.14 |
| Total nucleolar volume | μm3 | 4.22 | 3.21 | 12.36 | 7.12 | 4.79 | 2.87 |
| Average nucleolar margination | μm | 1.12 | 0.45 | 1.55 | 0.80 | 2.24 | 0.70 |
| Number of dense DNA clumps | - | 1.97 | 1.28 | 1.93 | 1.46 | 5.58 | 3.92 |
| Moderate density DNA volume fraction | - | 0.62 | 0.02 | 0.61 | 0.02 | 0.68 | 0.04 |
| High density DNA volume fraction | - | 0.19 | 0.02 | 0.20 | 0.02 | 0.15 | 0.02 |
| Chromatin density variability (Markovian contrast) | a.u. | 3400 | 493 | 3512 | 660 | 3798 | 556 |
| Chromatin texture smoothness (Markovian energy) | a.u. | 0.73 | 0.04 | 0.73 | 0.05 | 0.64 | 0.05 |
Mean
Standard deviation
The observed differences in the texture features also suggest considerable alterations in the chromatin distribution among the studied cell lines. There are an increased number of high-density DNA agglomerations (clumps) in CP-D cells in comparison to CP-A and EPC2 cells (Fig. 3h). The volume fractions of the moderate-density DNA regions are higher in CP-D as compared to EPC2 and CP-A cell lines (Fig. 3i). Conversely, volume fractions of high-density DNA are lower in CP-D than in CP-A or EPC2 cells (Fig. 3j). High-grade dysplastic cells have a larger number of smaller, high-density DNA clumps than normal and metaplastic cells. The Markovian contrast is increased in CP-D compared to the other two cell lines, indicating a larger variation in DNA density (Fig. 3k). The Markovian energy is lower in CP-D than in CP-A and EPC2 cells, indicating a more heterogeneous chromatin distribution in dysplastic cells (Fig. 3l). A common trend observed in these results is the decreased uniformity in chromatin distribution and increased DNA agglomeration into medium-density clumps as the cells transform toward cancer. The high degree of variability in metaplastic and dysplastic cell features confirms the known, marked heterogeneity in tumor cell populations.
To determine the nature of chromatin textural variations across length scales, we compared the Markovian feature distributions computed using our chosen voxel offset value of 8 with other offset values such as d= 1, 5, and 10. The statistical distributions for both Markovian features were observed to be consistent (Table 3) indicating that similar textural variations indeed exist at multiple granularities. Use of a very small offset such as d=1 may not be advisable due to noise artifacts. Use of large offsets (d>nuclear radius) is likely to yield misleading results due to inclusion of voxels outside the nuclear volume.
Table 3.
Comparison between distributions of Markovian features at different voxel offsets
| Voxel offset | Statistics of Markovian contrast(N=100, a.u.) | |||||
|---|---|---|---|---|---|---|
| EPC2 | CP-A | CP-D | ||||
| μa | σb | μ | σ | μ | σ | |
| d = 1 | 385 | 57 | 407 | 96 | 453 | 86 |
| d = 5 | 2051 | 292 | 2141 | 439 | 2332 | 372 |
| d = 8 | 3400 | 493 | 3512 | 660 | 3798 | 556 |
| d = 10 | 4346 | 646 | 4455 | 805 | 4814 | 694 |
| Voxel offset | Statistics of Markovian energy (N=100, a.u.) | |||||
|---|---|---|---|---|---|---|
| EPC2 | CP-A | CP-D | ||||
| μa | σb | μ | σ | μ | σ | |
| d = 1 | 0.82 | 0.03 | 0.82 | 0.04 | 0.74 | 0.04 |
| d = 5 | 0.78 | 0.04 | 0.78 | 0.04 | 0.69 | 0.04 |
| d = 8 | 0.73 | 0.04 | 0.73 | 0.05 | 0.64 | 0.05 |
| d = 10 | 0.73 | 0.04 | 0.73 | 0.05 | 0.64 | 0.05 |
Mean
Standard deviation
Discussion
Genetic and epigenetic abnormalities implicated in cancer initiation and progression inevitably alter the nuclear landscape, resulting in shape, size and textural irregularities in the nucleus. Improvements in powerful imaging and data analysis technologies have facilitated the development of quantitative nuclear morphometry as a sensitive tool to identify malignancy associated changes for a variety of cancer types (5,8,13,14,34). Previous studies have demonstrated the potential of automated biosignature feature extraction to classify or monitor neoplastic progression stage using a variety of methods. These include 2D analysis of absorption-stained tissue sections using hematoxylin (8) or Feulgen stains (12), 2D analysis of epi or confocal fluorescence imagery of stained nuclei (35), and 3D analysis of confocal scanning laser microscopy of stained nuclei (21,22). Some of these methods have been advanced as attractive options to improve the efficacy of early cancer detection. There exists ample motivation to pursue the clinical application of automated, quantitative cytometry, since tissue biopsies, brushings and fine needle aspirates are often readily available in current, routine clinical practice.
Our experimental results demonstrate the potential of absorption-stained optical cell tomography and 3D karyometry for quantitative characterization of structural alterations in pre-neoplastic progression. The variations in morphology between normal and abnormal cells suggest that these measurements may provide a useful complement to cytogenetic analysis. Direct comparisons can be performed among different cell lines to quantify their varying structures and chromatin textures. The isotropic spatial resolution of tomographic imaging provides an unbiased means for precise determination of linear and volumetric dimensions of sub-cellular features and compartments in 3D space without any digital interpolation of acquired data. The developed image processing methods enabled quantitative characterization of cellular and nuclear volumes and nuclear DNA distribution patterns, and their alterations in esophageal epithelial cells in different stages of pre-neoplastic progression. We envision that our approach will provide robust tools to identify, characterize and study biosignatures sensitive to early nuclear structure and chromatin distribution changes associated with abnormal cell functioning and carcinogenesis.
The main objective of this work was to develop a fully automated computational method for high throughput karyometric analysis of imagery acquired using single cell computed tomography. While our results point to the utility of our approach, the current framework can be easily extended to seamlessly incorporate additional data-processing capabilities including segmentation techniques to delineate other targets of interest from the cell images, extraction of additional morphometric descriptors, and statistical mining of the multi-dimensional feature space. The flexibility of our approach extends across cell types and enables evaluation of any scientific hypothesis that would benefit from accurate, true 3D microanalysis.
The proposed methodology serves as a foundation for further research and is open to several extensions that would circumvent current limitations. From a biological perspective, the effect of cell cycle on morphology is an important criterion which was not considered in this study but is presently under investigation. The mechanism of the stain is a second important point to be borne in mind when interpreting morphological trends. Image contrast is imparted by the binding action of hematoxylin to acidic functional groups in the cell. The choice of hematoxylin for nuclear staining was motivated by its ubiquitous use to highlight nuclear structure variations in diagnostic cytology. Quantitative absorption stains such as Feulgen would however be more appropriate to quantify features such as nuclear DNA content. Sufficient care should be exercised during sample preparation to ensure that cells are not damaged and are optimally stained. Although staining variations can be compensated by data normalization, there are certain unavoidable consequences of non-optimal staining. Understaining adversely affects segmentation performance while overstaining obscures fine morphological detail, biasing inferences made from the feature data. Robust feature extraction depends on correct segmentation. Understained and overstained cells may be excluded from analysis by an experienced cytotechnician. Use of eosin as a counter stain to enhance cytoplasmic detail was found to improve segmentation accuracy.
From a methodological perspective, our MIP-based segmentation approach is novel yet simple. The proposed segmentation techniques were found to provide satisfactory accuracy for optimally stained cells while being amenable to high throughput analysis. The presence of a single cell per image further reduced the segmentation complexity. However, the biological functionality of our volumes of interest has the potential to impact the performance of our segmentation techniques. For instance, accurate segmentation of nucleoli may depend on the density and distribution of ribosomal RNA (rRNA) since nucleoli are sites of rRNA synthesis. Fluctuations in image intensities within putative nucleoli may be attributed to these density variations. Consequently, we observe an occasional undersegmentation of nucleoli using our approach. Preliminary investigations evaluating the performance of techniques such as 3D region growing (36) and deformable surfaces (37,38) indicate that such methods hold promise when implemented with correct model parameters. The masks from our current segmentation techniques can be used as initial surfaces for these algorithms. Validation of computer segmented VOIs requires comparison with manual segmentation along with computation of intra- and inter-observer differences. Manual segmentation of 3D images is currently under development.
The availability of multidimensional features provides fertile ground for data mining procedures such as feature selection and classification. Supervised classification models could be developed based on individual cell lines and their efficacy tested on mixed cell populations (39). While the quantitative variations we found between the feature data from different cell lines allow discernment of different stages of pre-neoplastic progression on the basis of morphology, the overlapping distributions of the feature data point toward the need for a larger sample size to support stronger inferences. Power analysis and statistical methods to determine the set of most discriminatory features are currently in progress. We are extending our imaging modality to fluorescence mode to facilitate investigations of cell dynamics and function. The addition of 3D immunofluorescence imaging holds promise to reveal, among others, correlations between chromosomal abnormalities or specific tumor suppressor and oncogene mutations and higher order chromatin structure; and, further, how these factors may engender or influence gene expression patterns that predispose to cancer. The use of cell lines circumvents the problems encountered in highly heterogeneous biopsies. However, an immediate goal is to apply our technique to disaggregated biopsy material. Perhaps most efficacious of all would be to extend the capacity of high resolution 3D optical tomography to characterize intact biopsy specimens, which are inherently three-dimensional. While technically daunting, 3D tissue architectural evaluation coupled with sensitive quantification of abnormal cells’ nuclear morphology would provide tremendous added detection value since, for example, stromal components and vascularity might be included in the analysis.
Supplementary Material
Acknowledgments
This research was supported by the National Cancer Institute Center for Convergence of Physical Science and Cancer Biology, grant number U54CA143862 (Paul Davies, PI). The authors are grateful to Dr. Brian J. Reid from the Fred Hutchinson Cancer Research Center for providing the esophageal epithelial cell lines. The authors appreciate the assistance provided by Courtney Hemphill for cell culture, Yuguang Jin for sample preparation, and Florence Patten for advice on hematoxylin staining.
References
- 1.Misteli T. Concepts in nuclear architecture. Bioessays. 2005;27(5):477–487. doi: 10.1002/bies.20226. [DOI] [PubMed] [Google Scholar]
- 2.True L, Jordan C. The cancer nuclear microenvironment: interface between light microscopic cytology and molecular phenotype. J Cell Biochem. 2008;104(6):1994–2003. doi: 10.1002/jcb.21478. [DOI] [PubMed] [Google Scholar]
- 3.Zink D, Fischer A, Nickerson J. Nuclear Structure in Cancer Cells. Nature Reviews Cancer. 2004;4:677–687. doi: 10.1038/nrc1430. [DOI] [PubMed] [Google Scholar]
- 4.Bacus J, Boone C, Bacus J, Follen M, Kelloff G, Kagan V, Lippman S. Image morphometric nuclear grading of intraepithelial neoplastic lesions with applications to cancer chemoprevention trials. Cancer Epidemiology Biomarkers & Prevention. 1999;8(12):1087. [PubMed] [Google Scholar]
- 5.Hoque A, Lippman S, Boiko I, Atkinson E, Sneige N, Sahin A, Weber D, Risin S, Lagios M, Schwarting R. Quantitative nuclear morphometry by image analysis for prediction of recurrence of ductal carcinoma in situ of the breast. Cancer Epidemiology Biomarkers & Prevention. 2001;10(3):249. [PubMed] [Google Scholar]
- 6.Palcic B. Nuclear texture: can it be used as a surrogate endpoint biomarker? Journal of cellular biochemistry Supplement. 1994;19:40. [PubMed] [Google Scholar]
- 7.Partin A, Steinberg G, Pitcock R, Coffey D, Wu L, Piantadosi S, Epstein J. Use of nuclear morphometry, Gleason histologic scoring, clinical stage, and age to predict disease-free survival among patients with prostate cancer. Cancer. 1992;70(1):161–168. doi: 10.1002/1097-0142(19920701)70:1<161::aid-cncr2820700126>3.0.co;2-5. [DOI] [PubMed] [Google Scholar]
- 8.da Silva V, Prolla J, Sharma P, Sampliner R, Thompson D, Bartels P. Karyometry in Barrett’s esophagus. Analytical and quantitative cytology and histology/the International Academy of Cytology [and] American Society of Cytology. 2001;23(1):40–46. [PubMed] [Google Scholar]
- 9.Doudkine A, MacAulay C, Poulin N, Palcic B. Nuclear texture measurements in image cytometry. Pathologica. 1995;87(3):286–299. [PubMed] [Google Scholar]
- 10.Guillaud M, Zhang L, Poh C, Rosin MP, MacAulay C. Potential use of quantitative tissue phenotype to predict malignant risk for oral premalignant lesions. Cancer research. 2008;68(9):3099–3107. doi: 10.1158/0008-5472.CAN-07-2113. [DOI] [PMC free article] [PubMed] [Google Scholar]
- 11.Kemp RA, Reinders DM, Turic B. Detection of lung cancer by automated sputum cytometry. Journal of Thoracic Oncology. 2007;2(11):993–1000. doi: 10.1097/JTO.0b013e318158d488. [DOI] [PubMed] [Google Scholar]
- 12.Mairinger T, Mikuz G, Gschwendtner A. Nuclear chromatin texture analysis of nonmalignant tissue can detect adjacent prostatic adenocarcinoma. The Prostate. 1999;41(1):12–19. doi: 10.1002/(sici)1097-0045(19990915)41:1<12::aid-pros3>3.0.co;2-#. [DOI] [PubMed] [Google Scholar]
- 13.Mariuzzi L, Mombello A, Granchelli G, Rucco V, Tarocco E, Frank D, Davis J, Thompson D, Bartels H, Mariuzzi GM. Quantitative study of breast cancer progression: different pathways for various in situ cancers. Modern pathology. 2002;15(1):18–25. doi: 10.1038/modpathol.3880485. [DOI] [PubMed] [Google Scholar]
- 14.Montironi R, Scarpelli M, Lopez-Beltran A, Mazzucchelli R, Alberts D, Ranger-Moore J, Bartels HG, Hamilton PW, Einspahr J, Bartels PH. Chromatin phenotype karyometry can predict recurrence in papillary urothelial neoplasms of low malignant potential. Cellular Oncology. 2007;29(1):47–58. doi: 10.1155/2007/356464. [DOI] [PMC free article] [PubMed] [Google Scholar]
- 15.Petersen I, Kotb W, Friedrich KH, Schlüns K, Böcking A, Dietel M. Core classification of lung cancer: Correlating nuclear size and mitoses with ploidy and clinicopathological parameters. Lung Cancer. 2009;65(3):312–318. doi: 10.1016/j.lungcan.2008.12.013. [DOI] [PubMed] [Google Scholar]
- 16.Schmid K, Angerstein N, Geleff S, Gschwendtner A. Quantitative nuclear texture features analysis confirms WHO classification 2004 for lung carcinomas. Modern pathology. 2006;19(3):453–459. doi: 10.1038/modpathol.3800541. [DOI] [PubMed] [Google Scholar]
- 17.Veltri RW, Khan MA, Miller MC, Epstein JI, Mangold LA, Walsh PC, Partin AW. Ability to predict metastasis based on pathology findings and alterations in nuclear structure of normal-appearing and cancer peripheral zone epithelium in the prostate. Clinical Cancer Research. 2004;10(10):3465–3473. doi: 10.1158/1078-0432.CCR-03-0635. [DOI] [PubMed] [Google Scholar]
- 18.Weyn B, Jacob W, da Silva V, Montironi R, Hamilton P, Thompson D, Bartels H, Van Daele A, Dillon K, Bartels P. Data representation and reduction for chromatin texture in nuclei from premalignant prostatic, esophageal, and colonic lesions. Cytometry Part A. 2000;41(2):133–138. [PubMed] [Google Scholar]
- 19.Beil M, Irinopoulou T, Vassy J, Rigaut J. Chromatin texture analysis in three-dimensional images from confocal scanning laser microscopy. Analytical and quantitative cytology and histology/the International Academy of Cytology [and] American Society of Cytology. 1995;17(5):323–331. [PubMed] [Google Scholar]
- 20.Huisman A, Ploeger LS, Dullens HFJ, Jonges TN, Belien JAM, Meijer GA, Poulin N, Grizzle WE, van Diest PJ. Discrimination between benign and malignant prostate tissue using chromatin texture analysis in 3-D by confocal laser scanning microscopy. The Prostate. 2007;67(3):248–254. doi: 10.1002/pros.20507. [DOI] [PubMed] [Google Scholar]
- 21.Kim T, Choi H, Hwang H, Choi H. Three-dimensional Texture Analysis of Renal Cell Carcinoma Cell Nuclei for Computerized Automatic Grading. Journal of Medical Systems. 2009:1–8. doi: 10.1007/s10916-009-9285-6. [DOI] [PubMed] [Google Scholar]
- 22.Beil M, Irinopoulou T, Vassy J, Rigaut J. Application of confocal scanning laser microscopy for an automated nuclear grading of prostate lesions in three dimensions. Journal of microscopy. 2003;183(3):231–240. doi: 10.1046/j.1365-2818.1996.920650.x. [DOI] [PubMed] [Google Scholar]
- 23.Meyer M, Fauver M, Rahn J, Neumann T, Patten F, Seibel E, Nelson A. Automated cell analysis in 2D and 3D: A comparative study. Pattern Recognition. 2009;42(1):141–146. [Google Scholar]
- 24.Chen X, Yang C. Esophageal adenocarcinoma: a review and perspectives on the mechanism of carcinogenesis and chemoprevention. Carcinogenesis. 2001;22(8):1119. doi: 10.1093/carcin/22.8.1119. [DOI] [PubMed] [Google Scholar]
- 25.Paulson T, Reid B. Focus on Barrett’s esophagus and esophageal adenocarcinoma. Cancer cell. 2004;6(1):11–16. doi: 10.1016/j.ccr.2004.06.021. [DOI] [PubMed] [Google Scholar]
- 26.Galipeau P, Cowan D, Sanchez C, Barrett M, Emond M, Levine D, Rabinovitch P, Reid B. 17p (p53) allelic losses, 4N (G2/tetraploid) populations, and progression to aneuploidy in Barrett’s esophagus. Proceedings of the National Academy of Sciences of the United States of America. 1996;93(14):7081. doi: 10.1073/pnas.93.14.7081. [DOI] [PMC free article] [PubMed] [Google Scholar]
- 27.Harada H, Nakagawa H, Oyama K, Takaoka M, Andl C, Jacobmeier B, von Werder A, Enders G, Opitz O, Rustgi A. Telomerase induces immortalization of human esophageal keratinocytes without p16INK4a inactivation. Mol Cancer Res. 2003;1(10):729–38. [PubMed] [Google Scholar]
- 28.Palanca-Wessels MC, Barrett MT, Galipeau PC, Rohrer KL, Reid BJ, Rabinovitch PS. Genetic analysis of long-term Barrett’s esophagus epithelial cultures exhibiting cytogenetic and ploidy abnormalities. Gastroenterology. 1998;114(2):295–304. doi: 10.1016/s0016-5085(98)70480-9. [DOI] [PubMed] [Google Scholar]
- 29.Kak A, Slaney M. Principles of Computerized Tomographic Imaging. Philadelphia: Society for Industrial and Applied Mathematics; 2001. [Google Scholar]
- 30.Rosin P. Unimodal thresholding. Pattern Recognition. 2001;34(11):2083–2096. [Google Scholar]
- 31.Otsu N. A thresholding selection method from gray-level histogram. IEEE Transactions on Systems, Man, and Cybernetics. 1979;9(1):62–66. [Google Scholar]
- 32.Diamond D, Berry S, Umbricht C, Jewett H, Coffey D. Computerized image analysis of nuclear shape as a prognostic factor for prostatic cancer. The Prostate. 1982;3(4):321–332. doi: 10.1002/pros.2990030402. [DOI] [PubMed] [Google Scholar]
- 33.Haralick RM, Shanmugam K, Dinstein IH. Textural features for image classification. IEEE Transactions on systems, man and cybernetics. 1973;3(6):610–621. [Google Scholar]
- 34.Veltri R, Partin A, Miller M. Quantitative nuclear grade (QNG): a new image analysis-based biomarker of clinically relevant nuclear structure alterations. Journal of cellular biochemistry. 2000;79(S35):151–157. doi: 10.1002/1097-4644(2000)79:35+<151::aid-jcb1139>3.0.co;2-7. [DOI] [PubMed] [Google Scholar]
- 35.Rohde G, Ribeiro A, Dahl K, Murphy R. Deformation-based nuclear morphometry: Capturing nuclear shape variation in HeLa cells. Cytometry Part A. 2008;73(4):341–350. doi: 10.1002/cyto.a.20506. [DOI] [PubMed] [Google Scholar]
- 36.Lin G, Chawla M, Olson K, Barnes C, Guzowski J, Bjornsson C, Shain W, Roysam B. A multi-model approach to simultaneous segmentation and classification of heterogeneous populations of cell nuclei in 3D confocal microscope images. Cytometry Part A. 2007;71(9):724–736. doi: 10.1002/cyto.a.20430. [DOI] [PubMed] [Google Scholar]
- 37.McInerney T, Terzopoulos D. Topology adaptive deformable surfaces for medical image volume segmentation. IEEE Trans Med Imaging. 1999;18(10):840–850. doi: 10.1109/42.811261. [DOI] [PubMed] [Google Scholar]
- 38.Xu C, Prince J. Handbook of Medical Image Processing and Analysis. 2008. Gradient vector flow deformable models; pp. 181–194. [Google Scholar]
- 39.Veltri R, Partin A, Miller M. Quantitative Nuclear Grade. Cancer Chemoprevention. 2005:97–108. [Google Scholar]
Associated Data
This section collects any data citations, data availability statements, or supplementary materials included in this article.