Abstract
Phage shock proteins (Psp) and their homologues are found in species from the three domains of life: Bacteria, Archaea and Eukarya (e.g. higher plants). In enterobacteria, the Psp response helps to maintain the proton motive force (PMF) of the cell when the inner membrane integrity is impaired. The presumed ability of ArcB to sense redox changes in the cellular quinone pool and the strong decrease of psp induction in ΔubiG or ΔarcAB backgrounds suggest a link between the Psp response and the quinone pool. The authors now provide evidence indicating that the physiological signal for inducing psp by secretin-induced stress is neither the quinone redox state nor a drop in PMF. Neither the loss of the H+-gradient nor the dissipation of the electrical potential alone is sufficient to induce the Psp response. A set of electron transport mutants differing in their redox states due to the lack of a NADH dehydrogenase and a quinol oxidase, but retaining a normal PMF displayed low levels of psp induction inversely related to oxidised ubiquinone levels under microaerobic growth and independent of PMF. In contrast, cells displaying higher secretin induced psp expression showed increased levels of ubiquinone. Taken together, this study suggests that not a single but likely multiple signals are needed to be integrated to induce the Psp response.
Electronic supplementary material
The online version of this article (doi:10.1007/s00284-011-9869-5) contains supplementary material, which is available to authorized users.
Introduction
The Phage shock protein (Psp) response was discovered during studies of the infection process of filamentous phage f1 in Escherichia coli, where Psp proteins were induced by production of the phage-derived secretin pIV [7]. Since then, substantial progress has been made in understanding the physiological role of the Psp response. It is now clear that it is not only important during f1-phage infection, but also generally helps the bacterium to respond to stresses that impair the inner membrane integrity. Psp proteins function to maintain the proton motive force (PMF) under otherwise PMF-dissipating conditions [25, 29, 30]. The Psp response is important for the pathogenicity of enterobacteria such as Salmonella enterica [17] or Shigella flexneri. Furthermore it is involved in biofilm formation of E. coli [5] and in bacterial protein secretion [24] and translocation [9, 10, 23, 37]. The importance of Psp proteins is not limited to proteobacteria. PspA homologues have been found in the cyanobacterium Synechocystis and in plants (where it is essential for thylakoid biogenesis and photosynthesis) [45], as well as in Gram-positive bacteria and archaea [6, 42].
Despite detailed data regarding the mechanism of transcriptional regulation of the Psp response [8–10, 12, 13, 22, 23, 31, 34, 46], important information explaining its onset still remains elusive. The authors recently reported direct cross-talk, via protein–protein interactions, between the ArcAB and Psp systems [26]. It was revealed that in microaerobiosis activation of ArcB and the subsequent phosphorelay to its response regulator ArcA are required for the full expression of the psp genes [25, 26]. The ArcAB system consequently appears to be important for the creation or amplification of one psp-inducing signal. However, it is not clear whether the ArcAB effect on psp expression is due to direct ArcB activation of psp or due to a physiological consequence of an ArcB dependent activation of other factors.
The findings from Jovanovic et al. [25, 26] imply that an inducing signal may be sensed by the ArcB sensor kinase. The kinase activity of ArcB is regulated in part through the redox state of the quinone pools [4, 19, 32]. The quinone pool may therefore be a component of the psp signalling cascade acting upstream of ArcB. However, the nature of the signals for the psp induction is still unknown, although it is often proposed that psp is induced by dissipation of PMF [9, 34].
In this study, the authors have specifically analysed the two PMF components—the H+-gradient and the electrical potential—as well as the cellular quinone pool for their roles in the induction of the Psp response. It was demonstrated that neither loss of the H+-gradient nor dissipation of the electrical potential is sufficient to induce psp. Further, pIV-dependent induction of psp occurs when the redox state of the quinone pool becomes less reduced, suggesting the physiological signal—whilst being linked to ArcAB—is not a reduced redox state of quinones.
Materials and Methods
Bacterial Strains, Media and Growth Conditions
Bacterial strains and plasmids are shown in Table 1. The bacteriophage P1vir general-transduction method as described by Miller [33] was used to introduce a lacZ transcriptional reporter fusion into the chromosome to create EC10-13 and to transfer the menA mutation from JW3901 [28] into MVA4 to create EC14 (Table 1). Strains were grown at 37°C in Luria–Bertani (LB) broth or on LB agar plates [33] supplemented with the appropriate antibiotic(s). Depending on the desired level of aeration, a 30 ml culture of the strain to be tested (with an initial OD600 ~ 0.1) was grown in 250 ml (aerobic growth) or 100 ml (microaerobic growth) Erlenmeyer flasks at either 200 rpm (aerobic growth) or 100 rpm (microaerobic growth) [26]. For anaerobic growth, strains were grown without shaking in a universal tube fully filled with culture and sealed with a Suba-seal® (Sigma). Where indicated CCCP, Valinomycin and acetate were added at the following final concentrations: CCCP 40 μM, Valinomycin 10 μM (for K+-uptake, 150 mM KCl and 120 mM Tris was added to the bacterial culture prior to Valinomycin treatment) and acetate 34 mM. Experiments with 34 mM acetate were performed in LB supplemented with 50 mM MOPS (adjusted to pH 7.1–7.3) and LB supplemented with 100 mM MES (adjusted to pH 5.0). Growth rates of all strains tested were similar under the conditions used in this study.
Table 1.
Strains and plasmids
| Strain or plasmid | Relevant characteristics | Reference |
|---|---|---|
| Strain | ||
| BW25113 | F-, Δ(araD-araB)567, ΔlacZ4787(::rrnB-3), &lambda −, rph-1, Δ(rhaD-rhaB)568, hsdR514 | CGSC# 7636 |
| MC1061 | F-, Δ(araA-leu)7697, [araD139] B/r, Δ(codB-lacI)3, galK16, galE15(GalS), &lambda −, e14-, mcrA0, relA1, rpsL150(strR), spoT1, mcrB1, hsdR2 | CGSC# 6649 |
| MG1655 | F-, lambda −, rph-1 | CGSC# 7740 |
| RP437 | F-, thr-1, araC14, leuB6(Am), fhuA31, lacY1, tsx-78, lambda −, eda-50, hisG4(Oc), rfbC1?, rpsL136(strR), xylA5, mtl-1, metF159(Am), thi-1 | CGSC# 12122 |
| MG1655ΔpspF | F-, lambda −, rph-1, ΔpspF | [30] |
| MVA4 | MC1061ϕpspA-lacZ (apr) | [16] |
| MVA44 | MG1655ϕpspA-lacZ (apr) | [25] |
| MVA59 | MG1655ΔarcB::kan (kanr) | [25] |
| BT3415 | RP437Δtsr-7021 nuoF::miniTn10cm (cmr) | [14] |
| BT3390 | RP437Δtsr-7021 ndh:erm (ermr) | [14] |
| BT3402 | BT3415Δ(cyoABCDE)456::kan (kanr) | [14] |
| BT3406 | BT3390Δ(cyoABCDE)456::kan (kanr) | [14] |
| BT3408 | BT3390 Zbg-2200::kanΔ(cydAB′)455 (kanr) | [14] |
| EC10 | RP437 ϕpspA-lacZ (apr) [RP437×MVA4] | This study |
| EC11 | RP437Δtsr-7021 nuoF::miniTn10cm (cmr) Δ(cyoABCDE)456::kan (kanr) ϕpspA-lacZ (apr) [BT3402×MVA4] | This study |
| EC12 | RP437Δtsr-7021 ndh:erm (ermr) Δ(cyoABCDE)456::kan (kanr) ϕpspA-lacZ (apr) [BT3406×MVA4] | This study |
| EC13 | RP437Δtsr-7021 ndh:erm (ermr) Zbg-2200::kanΔ(cydAB′)455 (kanr) ϕpspA-lacZ (apr) [BT3408×MVA4] | This study |
| JW3901 | BW25113ΔmenA::kan (kanr) | [28] |
| EC14 | MC1061ϕ pspA-lacZ ΔmenA::kan (kanr) [MVA4×JW3901] | This study |
| Plasmids | ||
| pGZ119EH | IPTG-inducible tac promoter expression vector (cmr) ColD origin of replication | A gift from M. Russel |
| pPMR129 | pGZ119EH harbouring gIV (pIV); ColD origin of replication; (cmr) | A gift from M. Russel |
| pGJ4 | IPTG-inducible Ptac promoter expression vector encoding gIV (pIV); ColD origin of replication; (tetr) | [25] |
| pGJ46 | 490 bp of pflB promoter region amplified by PCR from the chromosome of MG1655 and cloned into pRS415A via EcoRI–BamHI; p15A origin of replication; (apr) | [26] |
| pGJ66 | 193 bp of yfiD promoter region amplified by PCR from the chromosome of MG1655 and cloned into pRS415A via EcoRI–BamHI; p15A origin of replication; (apr) | This study |
Listed are the strains and plasmids used in this study
Extraction and Measurement of Quinones
The quinone extraction and measurement methodology was adapted from Bekker et al. [3]. Cultures were grown to an OD600 ~ 1.0. Samples were taken during the exponential growth phase and cultures were not disturbed prior to sampling. To quench the sample, 8 ml of the culture were added quickly (to prevent reduction of the quinones; 3) to 24 ml of ice-cold methanol and the quinones extracted by adding 6 ml of petroleum ether (40–60°C) per 8 ml of MeOH-culture mixture. Samples were vortexed and centrifuged at 900×g for 2 min. The upper phase (petroleum ether) was removed into a clean tube and evaporated under constant nitrogen flow. The lower phase was again treated with 6 ml of petroleum ether, vortexed and centrifuged and the process repeated to back-extract any remaining quinones. The extracted and dried quinones were resuspended in 50 μl of 99.9% ethanol using a glass rod. A 30 μl sample of this solution was loaded onto a reverse phase Lichrosorb (Chrompack) 10 RP 18 column (4.6 mm i.d., 250 mm length) equilibrated with methanol which was also used as mobile phase. Quinone contents were analysed using the Pharmacia LKB gradient pump 2249 HPLC system. Peaks were identified by UV–Vis spectroscopy [3] and the amount of quinones calculated from their corresponding area using a standard curve for UQ10 (Suppl. Fig. 5). Three separate growth/HPLC replicates were analysed per strain tested (Suppl. Fig. 6). In line with previous reports [39, 40, 42, 43, 46] and as an internal control, MK8 and DMK8 could be detected under microaerobic growth conditions (Suppl. Fig. 6); under aerobic growth only ubiquinone and ubiquinol could be observed.
β-Galactosidase Assay
Cells were grown as specified above. The level of pspA, pflB and yfiD promoter activity was measured in three biological replicates for each strain tested. After determining the cell-density (by measuring the OD600), a 500 μl sample of the day-culture (at mid-log phase growth) was supplemented with 500 μl of Z buffer (60 mM Na2HPO4, 40 mM NaH2PO4, 10 mM KCl, 1 mM MgSO4 and 50 mM β-mercaptoethanol). Following addition of 50 μl of chloroform and vortexing for 30 s, the solution was incubated at 30°C with 200 μl of ONPG (4 mg/ml dissolved in Z buffer). The reaction was quenched by 500 μl of 1 M Na2CO3 once a pale yellow colour was observed and the time between addition of ONPG and quenching was recorded. The reaction was analysed at OD420 (ONPG hydrolysis) and OD550 (light scatter) and the activity of the pspA, pflB and yfiD promoter expressed as Miller units (MU).
Immunoblotting
Immunoblotting was performed according to Elderkin et al. [15] using PspA- or pIV-specific antibodies as indicated. Antibodies were used as follows: anti-PspA (This study; 1:1,000 overnight in 5% milk; secondary antibody: anti-rabbit-HRP 1:5,000 in 5% milk for 1 h), anti-pIV (a gift from M. Russel; 1:5,000 in 5% milk; secondary antibody: anti-rabbit-HRP 1:5,000 in 5% milk for 1 h).
Measurement of the Electrical Potential
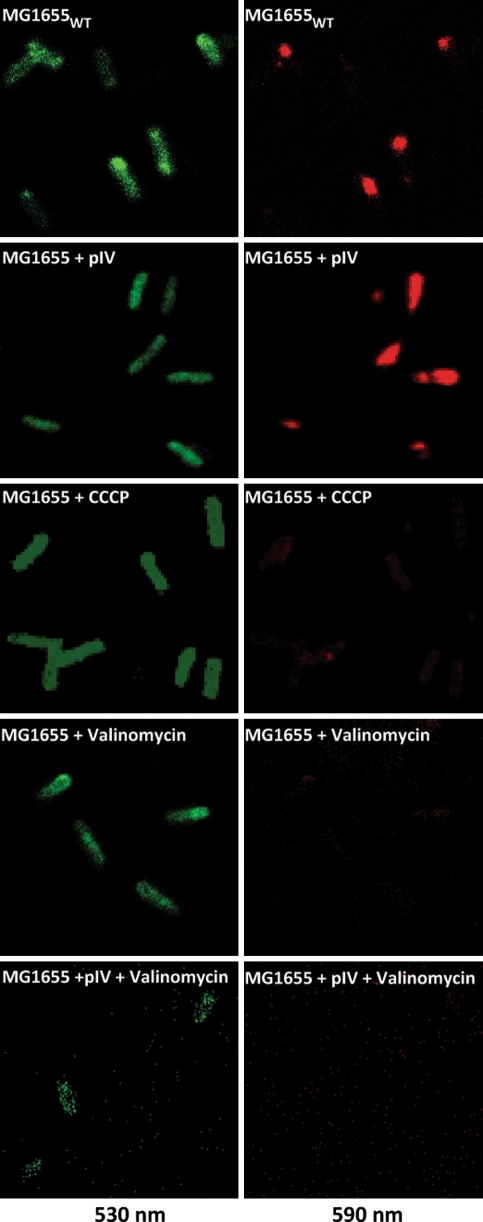
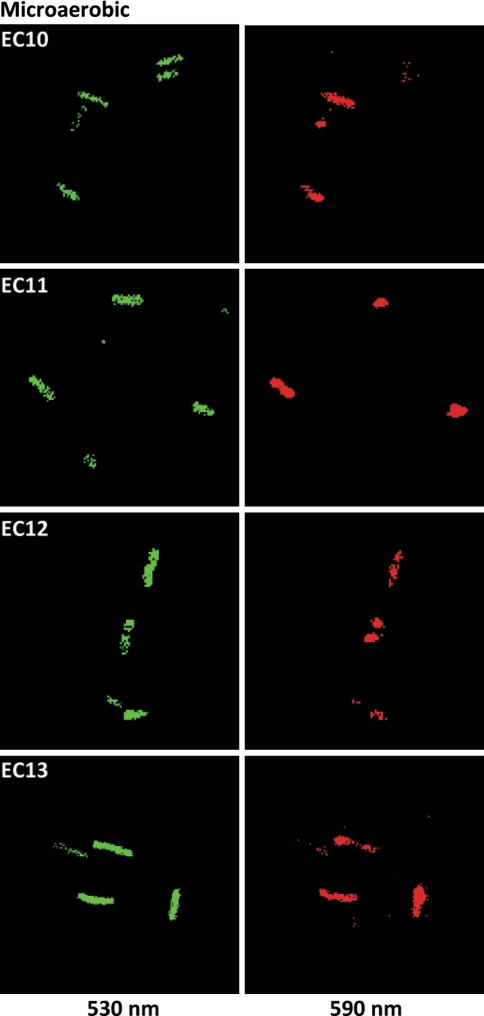
The electrical potential was measured via the membrane-permeable JC-1 dye [2]. JC-1 changes its oligomeric state in response to the level of the electrical potential, forming red fluorescent J-aggregates (measured as red fluorescent emission at 590 nm upon excitation at 488 nm) if the cellular electrical potential is equal or greater than wild-type levels that is not stress challenged. When the electrical potential is decreased, JC-1 remains monomeric, emitting fluorescence at 530 nm (upon excitation at 488 nm). Cells with decreased electrical potential will therefore appear mostly green. Since conversion between both states is not 100%, cells with wild-type electrical potential will emit light at both wavelengths and hence simultaneously appear green and red. The electrical potential obtained using the JC-1 dye represents the cellular PMF since measurements were taken at pH 7.6 (corresponding to the pH inside the bacterial cell before permeabilisation). Cells were grown to mid-log phase in LB supplemented with the appropriate antibiotic(s). A 1 ml sample of cells was harvested (4,500×g) and resuspended in 1 ml of permeabilisation buffer (10 mM Tris–HCl (pH 7.6), 1 mM EDTA and 10 mM glucose). Following 30 min incubation with 2 μl JC-1 dye (5 mg/ml) (PIERCE) at RT, cells were harvested at 4,500×g and resuspended in 500 μl of permeabilisation buffer. Cells were imaged using a Leica SP2 upright confocal fluorescence microscope fitted with a HCX PL APO CS 63.0×1.32 Oil Ph3 objective and analysed using the LCS Lite software (Leica).
Results
The PMF-Dissipating Agents Valinomycin and Acetate do not Induce the Psp Response
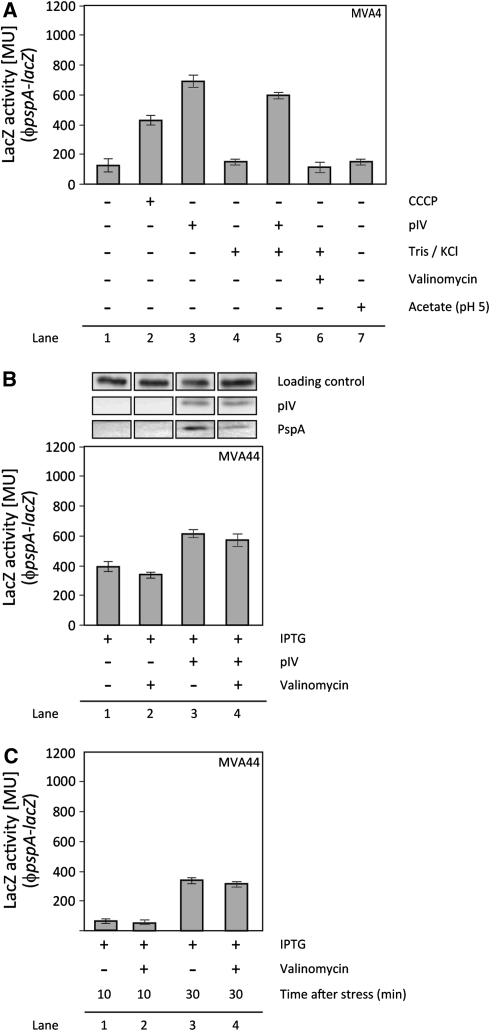
It has been shown that CCCP dissipates the PMF and induces psp [25] (Figs. 1, 2). CCCP is a protonophore causing an influx of H+ into the cytoplasm, thereby discharging both the electrical potential and the H+-gradient across the inner membrane. Hence, it is conceivable that changes in one of the two PMF components may be required to trigger induction of the Psp response. The authors therefore tested the effect of both components on the psp induction individually (Figs. 1, 2).
Fig. 1.
Measurement of psp induction by various agents. a The psp induction was measured as LacZ activity in cells containing a chromosomal ϕpspA–lacZ either in a MVA4 or b, c MVA44. a psp is induced by CCCP (40 μM for 30 min; Lane 2) and pIV from pGJ4 (leaky expression, no addition of IPTG; Lane 3 and 5), but not by KCl/Tris (Lane 4), Valinomycin (10 μM for 30 min; Lane 6) or acetate (34 mM) at pH 5 (Lane 7) or pH 7 (data not shown). KCl/Tris does not inhibit the induction of psp by pIV (Lane 5). b The effect of Valinomycin on the ability of pIV to induce psp was assessed in MVA44 (MG1655ϕpspA-lacZ) cells. Plasmid-borne pIV was set under the control of a tight IPTG-inducible promoter (pPMR129). All cells were incubated with 1 mM IPTG for 30 min. Cells in lane 2 and 4 were treated with Valinomycin (10 μM for 30 min). IPTG and Valinomycin addition occurred simultaneously. IPTG treatment in cells containing pPMR129 induced the production of the pIV secretin (Lane 3 and 4). Note that the basal level of LacZ activity in MVA44 is increased compared to MVA4 due to the native lacZ located on the chromosome of MVA44. Expression of PspA protein was assessed by immunoblotting with PspA-specific antibodies. Cells in lane 3 and 4 clearly show increased PspA production (due to the presence of pIV as determined by immunoblotting with pIV-specific antibodies). c To test, whether “time after stress” was important for induction of psp by Valinomycin, the LacZ activity in MVA44 was measured after 10 and 30 min incubation with Valinomycin (10 μM) and compared to untreated MVA44 cells. To cross-compare with results from b cells were incubated with 1 mM IPTG for the indicated length of time. Valinomycin does not induce psp after 10 and 30 min (Lane 2 and 4)
Fig. 2.
PMF measurement in MG1655 cells. The PMF in MG1655 was measured at mid-log phase growth using the JC-1 dye. Cells were either untreated (MG1655 WT), or grown in the presence of pIV from pGJ4 (leaky expression, no addition of IPTG) (MG1655 + pIV), CCCP (40 μM for 30 min; MG1655 + CCCP), Valinomycin (10 μM for 30 min; MG1655 + Valinomycin) or simultaneously with both pIV from pGJ4 (leaky expression, no addition of IPTG) and Valinomycin (10 μM for 30 min; MG1655 + pIV + Valinomycin). Wild-type cells expressing pIV show no apparent drop in PMF compared to MG1655WT cells. CCCP and Valinomycin dissipate PMF (as seen through the marked decrease in red (590 nm) fluorescent cells). In addition, Psp effector proteins (induced by pIV) can not overcome the dissipation of PMF in presence of Valinomycin (Color figure online)
Paul et al. [35] used Valinomycin and acetate (at an external pH of 5 and 7) to separate the electrical potential from the H+-gradient. Valinomycin is a K+-ionophore and specifically dissipates the electrical potential component of PMF by facilitating the influx of K+ into the cytoplasm whilst leaving the H+-gradient unchanged. Acetate in contrast disrupts the H+-gradient by protonating the cytoplasm after crossing the inner membrane.
Using a chromosomal ϕpspA-lacZ reporter, the authors measured the pspA promoter activity in cells treated either with Valinomycin or acetate (at an external pH 5 and 7) (Fig. 1a), essentially as described by Paul et al. [35]. Neither cells (primed for K+-uptake via Valinomycin through the addition of 150 mM KCl and 120 mM Tris to the medium) incubated with 10 μM Valinomycin for 10 or 30 min (Fig. 1a, b, c), nor cells grown in the presence of 34 mM acetate (at an external pH 5 or 7) showed any increase in activity from the pspA promoter (Fig. 1a). Furthermore, measurement of PMF clearly demonstrates that Valinomycin dissipates the electrical potential of the cell (MG1655 + Valinomycin; Fig. 2).
To differentiate between whether the decreased pspA promoter activity is due to (i) the inability of Valinomycin to induce psp, or (ii) because Valinomycin simply inhibits psp induction, cells were subjected to pIV-secretin stress in the presence of Valinomycin (Fig. 1b). In the presence of Valinomycin, pIV production caused increased pspA promoter activity (as measured by β-galactosidase assays) and a significant increase in PspA expression (as measured by immunoblotting with PspA specific antibodies) (Fig. 1b). Hence, Valinomycin per se does not hinder psp induction. The authors next measured the effect of pIV, CCCP and Valinomycin on the cell’s PMF using the JC-1 dye (as described in “Materials and Methods”). In agreement with previous reports [25], pIV does not drop the PMF in wild-type cells (MG1655 + pIV, Fig. 2). It has been shown that this is due to the activated Psp response as cells lacking the activator of psp transcription, PspF, fail to maintain PMF at wild-type levels [25]. In contrast, treatment with both CCCP (MG1655 + CCCP, Fig. 2) and Valinomycin (MG1655 + Valinomycin, Fig. 2) dissipates PMF of wild-type cells. If dissipation of PMF is the signal to activate the Psp response, then these Valinomycin treated cells should show psp induction. However, only CCCP induces psp, Valinomycin does not (Fig. 1a; Lane 2 and 6). Notably, treatment with both pIV and Valinomycin (MG1655 + pIV + Valinomycin, Fig. 2) results in PMF dissipation despite the increased activity of the psp promoter and production of PspA in these cells (Fig. 1b, Lane 1 vs. 4) demonstrating the Psp response is “on”. Failure to maintain PMF may be because the dissipation of PMF is so severe (due to the presence of two PMF discharging agents) that Psp can not cope with it. It is also possible that Psp can not counteract the mechanism by which Valinomycin dissipates PMF (as seen with CCCP, where the induced Psp response can not maintain PMF; MG1655 + CCCP; Fig. 2).
Production of the pIV-Secretin and the Redox State of the Ubiquinone Pool
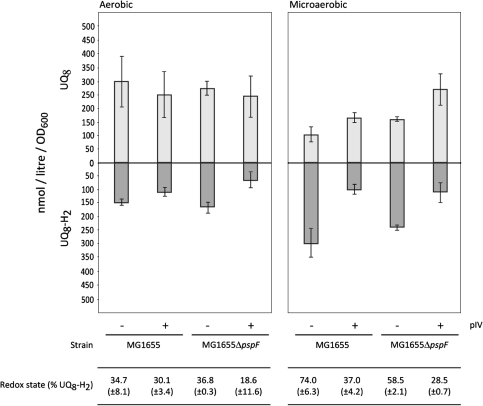
The above data suggest that dissipation of PMF is not sufficient to induce the Psp response. Under microaerobic growth, pIV-dependent stimulation of psp induction requires an active ArcB [26]. Activation of ArcB is responsive to the redox state of quinones—the electron carriers of the electron transport chain [4, 19, 32]. These observations imply that quinones might play a role in the induction of the Psp response. The authors therefore determined whether the presence of the psp inducing stress agent, pIV-secretin, might influence the content and/or the redox state of ubiquinone and so activate ArcB (Fig. 3). The results clearly show that under aerobic and microaerobic growth pIV does influence the ubiquinone pool of the cell. The effects of pIV are much more pronounced under microaerobic growth. In cells where pIV is produced UQ8 is increased under microaerobic growth. UQ8-H2 is consistently decreased in the presence of pIV under aerobic and microaerobic growth. Accordingly, the redox state of ubiquinone is shifted towards the more oxidised state (with the total percentage of the reduced form UQ8-H2 being almost halved under microaerobic growth when pIV is present). Intriguingly, the effect of pIV is dependent on the activity of the Psp response (compare wild-type MG1655 cells with those lacking the ability to activate the Psp response, MG1655ΔpspF) (Fig. 3), and in the absence of the Psp response pIV causes an even more marked oxidation of the quinone pool. The Psp response seems to counter effects of pIV on ubiquinones.
Fig. 3.
Ubiquinones in MG1655 and MG1655ΔpspF in absence (−) and presence (+) of pIV. The effect of pIV production from pGJ4 (leaky expression, no addition of IPTG) on the amount of oxidised (UQ8; light grey) and reduced (UQ8-H2; dark grey) ubiquinone as well as the redox state (% UQ8-H2) in wild-type MG1655 cells (with the ability to mount the Psp response) and in MG1655ΔpspF cells (lacking the PspF transcriptional activator, hence unable to mount the Psp response) are shown. Measurements were taken under aerobic and microaerobic growth conditions. Values for the standard deviation are included
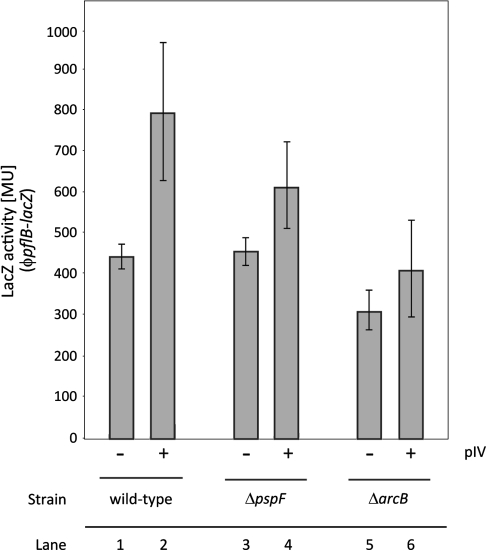
Since pIV caused changes in the redox state of ubiquinone, a ϕpfl-lacZ reporter fusion was used to the minimal sequence of the pflB promoter that is ArcBA sensitive [38] to assess the impact of pIV upon ArcAB activity (Fig. 4). Differences in pfl promoter activity were very modest when cells with or without pIV were compared. Similar small pIV dependent differences were seen in cells lacking PspF (Fig. 4; Lane 3 and 4). The results were confirmed using a ϕyfiD-lacZ reporter fusion to the ArcA-P dependent yfiD promoter (Suppl. Fig. 1). Anaerobic growth increased somewhat the pfl promoter activity, consistent with higher ArcB activity and hence ArcA-P levels in anaerobically grown cells (Suppl. Fig. 2). It was concluded that although the synthesis of pIV causes changes in the quinone/quinol ratio, these are insufficient to greatly impact on the amount of ArcA-P in the cells or to clearly activate ArcB for induction of the Psp response by pIV. The signal for induction of psp via pIV action seems not to be evident as a marked increase in ubiquinol to ubiquinone ratios. It was noted that ArcB activity is sensitive to factors other than redox state of the quinones [4, 18, 20, 21]; these could play a role in activation of the Psp response.
Fig. 4.
Impact of pIV upon ArcAB activity. The impact of pIV upon ArcAB activity was assessed using a ϕpfl–lacZ reporter fusion to the ArcA-P dependent pflB promoter (pGJ46). pIV has a modest effect on pflB promoter activity. Wild-type: MG1655; ΔpspF: MG1655ΔpspF; ΔarcB: MG1655ΔarcB (MVA59). pIV was under leaky expression on pGJ4 (no addition of IPTG). Cells were grown microaerobically as described in “Material and Methods”
psp Induction in Electron Transport Mutants and Changes in the Ubiquinone Pool
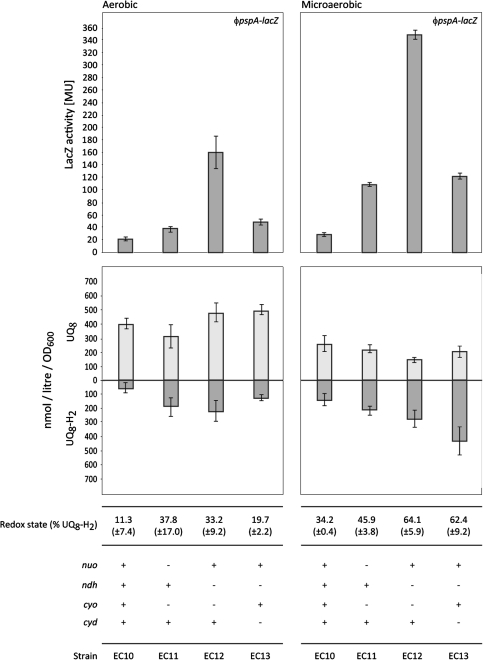
In order to explore further whether changes in the quinone species or content might affect psp expression, the authors determined the content and redox state of ubiquinone and measured the level of psp induction in E. coli strains (EC10, EC11, EC12 and EC13; Table 1) lacking either the NADH dehydrogenases NDH-1 or NDH-2 and quinol oxidases Cyt bd-I or Cyt bo [14]. These components of the electron transport chain are linked by quinones, which transfer electrons from the dehydrogenases to the oxidases (Suppl. Fig. 4). Hence, the authors considered that the quinone pool of these mutants would vary significantly. Indeed, both the oxidised and reduced forms of the ubiquinones exhibited marked differences (with respect to each other), depending on which combination of dehydrogenase and oxidase was deleted, thereby enabling any correlation between the ubiquinones and psp induction to be addressed (Fig. 5).
Fig. 5.
Induction of psp and the ubiquinone pool in the electron transport mutants. Comparison of (Top) the level of psp induction and (Bottom) the amount of oxidised (UQ8; light grey) and reduced (UQ8-H2; dark grey) ubiquinone as well as the redox state (% UQ8-H2) in wild-type EC10 and the electron transport mutants EC11, EC12 and EC13 under aerobic and microaerobic growth. Values for the standard deviation are included. Note that growth rates of EC11, EC12 and EC13 were similar to the parental strain EC10. Thus, the authors infer that there are no gross pleiotropic defects in these strains
A ϕpspA-lacZ reporter fusion was introduced into the chromosome of each mutant and the parental RP437 strain to create EC10, EC11, EC12 and EC13 (Table 1) and the activity of the pspA promoter measured under aerobic and microaerobic growth conditions (Fig. 5).
All electron transport mutants in addition contained a deletion of the tsr gene involved in chemotaxis [14]. However, deletion of tsr alone had no effect on the induction of the Psp response when compared to the wild-type EC10 (data not shown). The observed differences in the psp induction levels among the electron transport mutants (see below) therefore were judged to be due to their individual differences with respect to the composition of their electron transport chain rather than any effects of the tsr deletion.
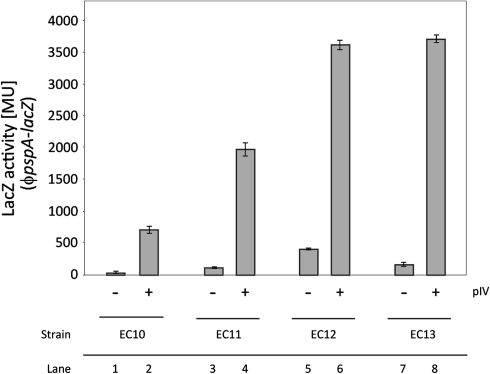
Compared to the wild-type control strain, EC10, all three electron transport mutants show elevated psp gene expression under aerobic and microaerobic growth, independent of pIV (Fig. 5). However, these levels of psp induction are markedly different. The pspA promoter is most active in the EC12 strain, with an eightfold increase of LacZ activity compared to EC10 under aerobic growth and an 18-fold increase under microaerobic growth. In contrast, psp induction in the EC13 strain is twofold under aerobic and sixfold under microaerobic growth in comparison to EC10. EC11 shows the lowest level of psp induction compared to EC10 with a twofold increase under aerobic and a fivefold increase under microaerobic growth (Fig. 5). Moreover, psp can still be much further induced by pIV in these mutant strains (Fig. 6). The effect of pIV appears to be additive to the basal level of psp induction in each strain (Fig. 6) showing that pIV alone does not fully deregulate the Psp response in the wild-type control. This is in line with previous reports suggesting that some PspA-dependent negative regulation still occurs under pIV stress conditions [16, 26].
Fig. 6.
Induction of psp by pIV in the electron transport mutants. The ability of pIV-dependent (leaky expression of pIV from pGJ4, no addition of IPTG) induction of psp in the electron transport mutants was assessed under microaerobic growth. pIV appears to have an additive effect on psp induction dependent of the basal level of induction
The authors measured under either aerobic or microaerobic growth, the amount of ubiquinone (UQ8) and ubiquinol (UQ8-H2) and determined the redox state of the ubiquinone pool (% UQ8-H2). Under aerobic conditions (Fig. 5), no simple linear relationship between psp induction and ubiquinone or ubiquinol was observed. Under microaerobic growth, psp induction was inversely proportional to the amount of oxidised UQ8 (Fig. 5; e.g. the lower the amount of UQ8 the higher the level of psp induction). These data indicate the reduction of ubiquinone might well affect a low level Psp response (Fig. 5). However, the activating effects of pIV (Fig. 6) are much greater and seem not to be mediated by an increase in ubiquinol (Fig. 3).
The redox state of the ubiquinone pool is generally (in all strains tested) shifted towards a more reduced state under microaerobic growth (Fig. 5), consistent with the lowered respiratory flux under such conditions compared to full aerobiosis. In addition, when cells were grown microaerobically, low amounts of both demethylmenaquinone (DMK8) and menaquinone (MK8) could be detected in agreement with previous results [3] (Suppl. Fig. 6). This observation is fully in line with the role of DMK8 and MK8 as the main type of quinone in E. coli under conditions with low aeration [4, 41, 43, 47]. Together with the observed redox states, these results indicate that the quinone measurements generated in this study are truly representative of the physiological state of the cell.
DMK8 and MK8 are not Required to Mount the Psp Response
Both DMK8 and MK8 were observed under microaerobic growth, a condition where ArcB is required to activate psp transcription [26]. Kinase activity of ArcB is inactivated by the ubiquinone and menaquinone analogues UQ0 and menadione, respectively [19]. Furthermore, menaquinone was found to be essential for activation of the ArcB kinase under anaerobic conditions [4]. It is therefore conceivable that DMK8 and MK8 play a role in psp induction.
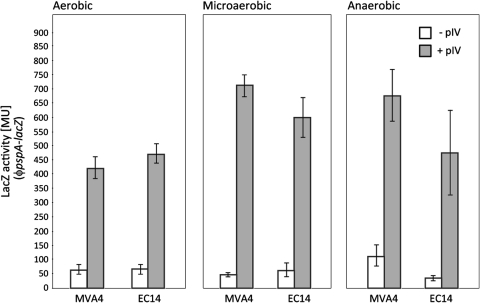
The ability to induce psp was analysed in EC14 (Table 1). These cells lack DMK8 and MK8 due to a deletion of menA [28, 40]. Notably, EC14 cells maintained the ability to mount the usual Psp response to pIV-secretin stress under anaerobic, microaerobic and aerobic growth. It therefore seems unlikely that either DMK8 or MK8 are required for any ArcB dependent psp induction (Fig. 7).
Fig. 7.
Induction of psp in EC14 (MVA4ΔmenA). The ability of pIV-dependent (leaky expression of pIV from pGJ4, no addition of IPTG) induction of psp in EC14 (Table 1) lacking menA and hence both DMK8 and MK8 was assessed under aerobic, microaerobic and anaerobic growth. The lack of menA appears to have no effect on psp induction under the growth conditions tested. White bars pIV absent, Grey bars pIV present. Values for the standard deviation are included
The Psp Response can be Induced at Wild-Type PMF Levels
Edwards et al. [14] reported no significant differences in the electrical potential of the electron transport mutants under aerobic growth when measured using tetraphenyl phosphonium (TPP+) in combination with a TPP+-sensitive electrode. The dye-based measurements of the cellular electrical potential under the growth conditions used for this study are congruent with the data reported by Edwards et al. [14]. The electrical potential of the electron transport defective mutant strains was similar to wild-type, EC10, under both aerobic (data not shown) and microaerobic growth (Fig. 8). Recall their psp induction levels are markedly different (Fig. 5). This indicates that the differences in psp induction observed between the electron transport mutants may not be caused by a drop in PMF, fully supporting the observations where neither the dissipation of the electrical potential by Valinomycin nor the loss of the H+-gradient through acetate induced the Psp response (Figs. 1, 2).
Fig. 8.
PMF measurement in the electron transport mutants. The PMF in EC10, EC11, EC12 and EC13 was measured at mid-log phase growth using the JC-1 dye. The electron transport mutants show no marked decrease in the number of red (590 nm) fluorescent cells compared to the wild-type EC10 strain indicating wild-type PMF levels of EC11, EC12 and EC13 (Color figure online)
Discussion
Since its discovery nearly two decades ago [7], the Psp response has been studied extensively. Today, much is known about its transcriptional regulation [9, 10, 22, 23, 31, 34, 36], its degree of conservation and its incidence throughout bacteria, archaea and plants [6, 9, 23, 42, 45]. Its role in maintenance of PMF [9, 23, 25, 29, 30] and its relationship to bacterial pathogenicity [9, 10, 23, 37] have also been established. A variety of conditions have been found which stimulate psp expression, all of which appear to impair IM integrity [9, 23].
The precise nature of the psp inducing signal as well as determining how it is perceived has remained elusive. It was suggested that a common outcome of all psp inducing agents is the dissipation of PMF [9, 34]. Whether or not psp could be induced directly by low levels of PMF was untested. Similarly, an activating signal for ArcAB in its role in psp expression was not defined.
The data suggest that a drop in PMF may not be the primary signal for the Psp response. The authors used Valinomycin and/or acetate to analyse the contribution of each individual component of PMF in relation to induction of the Psp response. The outcome strongly suggests that dissipation neither of the electrical potential nor of the H+-gradient is sufficient to induce psp. Further support for this view emerges from electron transport mutants in which the PMF appeared to be similar to wild-type EC10 cells under both aerobic and microaerobic growth conditions (in agreement with reports from Edwards et al. [14] where under aerobiosis the strains showed no major difference in PMF), the level of psp induction however varied significantly indicating that the Psp response can be mounted independently of a detectable reduction in the PMF level. Recent data published by Wang et al. [44] also suggest that strong induction of PspA upon depletion of YidC could be independent of a drop in the PMF.
These findings can help to explain the apparent paradox of why the Psp response is still induced in cells producing pIV, despite measurements of the electrical potential clearly showing that PMF remains at near wild-type levels ([25]; and compare Figs. 1a, 2). PMF maintenance under pIV stress can be attributed to a functioning Psp response, which is consistent with Psp’s proposed role under stress [25, 29, 30], since a drop in PMF is only evident in stressed cells where the Psp activator protein PspF is deleted (MG166ΔpspF). These mutant cells fail to maintain wild-type PMF in the presence of pIV [25]. Recovery of PMF in wild type cells by the induced Psp effectors would, in principle, result in a loss of the inducing signal should it be the decreased PMF. These considerations imply that when inducing the Psp response pIV should cause a constant physiological change which cannot be completely relieved by Psp effectors. As suggested [25, 27], it is likely that multiple factors activate the Psp response; changes in physical and chemical properties of the membrane linked to change in cell physiology (see below) may serve as the psp inducing signal.
The data suggest that PspA content when pIV is not being expressed is inversely correlated to the amount of oxidised ubiquinone. This is also logical since ArcB is inhibited by oxidised ubiquinones. However, the higher level psp induction seen with pIV occurs when the oxidised ubiquinone is increasing. Thus, the requirements for ArcB activity in pIV-dependent psp expression cannot be explained by the quinone redox state, although other ArcB activating signals may be at play [4, 18, 20, 21]. A psp inducing signal elicited by pIV which is not PMF or the quinone redox state might simply rely on a relatively low and constant level of ArcA-P activity in microaerobically grown cells. In agreement, inactivation of TolC which induces psp also triggers a metabolic shutdown, increases the reducing capacity of the cell, inhibits NADH-I and NADH-II, and causes high NADH/NAD+ ratios and IM stress [11]. These findings further underline the possibility that psp can be induced by multiple factors. Sensitivities of the electron transport chain and cellular redox towards pIV being mislocalised in the IM could elicit the primary inducing signals [25].
Electronic supplementary material
Below is the link to the electronic supplementary material.
Acknowledgments
This study was supported by a project grant from The Wellcome Trust to MB and an IC Postgraduate Studentship to CE. ATB contributed to this study as a postdoctoral fellow for the SysMO-SUMO project supported by NWO-SysMO 826.06.002. The authors also thank the members of the MB lab for helpful comments and discussions on the manuscript.
Open Access
This article is distributed under the terms of the Creative Commons Attribution Noncommercial License which permits any noncommercial use, distribution, and reproduction in any medium, provided the original author(s) and source are credited.
Abbreviations
- Psp
Phage shock protein
- PMF
Proton motive force
- pIV
Protein IV from filamentous phage f1
- UQ8
Ubiquinone-8
- UQ8-H2
Ubiquinol-8
- MK8
Menaquinone-8
- DMK8
Demethylmenaquinone-8
- β-Gal
β-Galactosidase
- ETC
Electron transport chain
Contributor Information
Christoph Engl, Email: Christoph.Engl@med.nyu.edu.
Martin Buck, Email: m.buck@imperial.ac.uk.
References
- 1.Baba T, Ara T, Hasegawa M et al. (2006) Construction of Escherichia coli K-12 in-frame, single-gene knock-out mutants—the Keio collection. Mol Syst Biol. doi: 10.1038/msb4100050 [DOI] [PMC free article] [PubMed]
- 2.Becker LA, Bang IS, Crouch ML, et al. Compensatory role of PspA, a member of the phage shock protein operon, in rpoE mutant Salmonella enterica serovar Typhimurium. Mol Microbiol. 2005;56:1004–1016. doi: 10.1111/j.1365-2958.2005.04604.x. [DOI] [PubMed] [Google Scholar]
- 3.Bekker M, Kramer G, Hartog AF, et al. Changes in the redox state and composition of the quinone pool of Escherichia coli during aerobic batch-culture growth. Microbiology. 2007;153:1974–1980. doi: 10.1099/mic.0.2007/006098-0. [DOI] [PubMed] [Google Scholar]
- 4.Bekker M, Alexeeva S, Laan W, et al. The ArcBA two-component system of Escherichia coli is regulated by the redox state of both the ubiquinone and the menaquinone pool. J Bacteriol. 2010;192:746–754. doi: 10.1128/JB.01156-09. [DOI] [PMC free article] [PubMed] [Google Scholar]
- 5.Beloin C, Valle J, Latour-Lambert P, et al. Global impact of mature biofilm lifestyle on Escherichia coli K-12 gene expression. Mol Microbiol. 2004;51:659–674. doi: 10.1046/j.1365-2958.2003.03865.x. [DOI] [PubMed] [Google Scholar]
- 6.Bidle KA, Kirkland PA, Nannen JL, et al. Proteomic analysis of Haloferax volcanii reveals salinity-mediated regulation of the stress response protein PspA. Microbiology. 2008;154:1436–1443. doi: 10.1099/mic.0.2007/015586-0. [DOI] [PMC free article] [PubMed] [Google Scholar]
- 7.Brissette JL, Russel M, Weiner L, et al. Phage shock protein, a stress protein of Escherichia coli. Proc Natl Acad Sci USA. 1990;87:862–866. doi: 10.1073/pnas.87.3.862. [DOI] [PMC free article] [PubMed] [Google Scholar]
- 8.Buck M, Gallegos MT, Studholme DJ, et al. The bacterial enhancer-dependent sigma(54) (sigma(N)) transcription factor. J Bacteriol. 2000;182:4129–4136. doi: 10.1128/JB.182.15.4129-4136.2000. [DOI] [PMC free article] [PubMed] [Google Scholar]
- 9.Darwin AJ. The phage-shock-protein response. Mol Microbiol. 2005;57:621–628. doi: 10.1111/j.1365-2958.2005.04694.x. [DOI] [PubMed] [Google Scholar]
- 10.Darwin AJ. Regulation of the phage-shock-protein stress response in Yersinia enterocolitica. Adv Exp Med Biol. 2007;603:167–177. doi: 10.1007/978-0-387-72124-8_14. [DOI] [PubMed] [Google Scholar]
- 11.Dhamdhere G, Zgurskaya HI. Metabolic shutdown in Escherichia coli cells lacking the outer membrane channel TolC. Mol Microbiol. 2010;77:743–754. doi: 10.1111/j.1365-2958.2010.07245.x. [DOI] [PMC free article] [PubMed] [Google Scholar]
- 12.Dworkin J, Jovanovic G, Model P. Role of upstream activation sequences and integration host factor in transcriptional activation by the constitutively active prokaryotic enhancer-binding protein PspF. J Mol Biol. 1997;273:377–388. doi: 10.1006/jmbi.1997.1317. [DOI] [PubMed] [Google Scholar]
- 13.Dworkin J, Jovanovic G, Model P. The PspA protein of Escherichia coli is a negative regulator of sigma(54)-dependent transcription. J Bacteriol. 2000;182:311–319. doi: 10.1128/JB.182.2.311-319.2000. [DOI] [PMC free article] [PubMed] [Google Scholar]
- 14.Edwards JC, Johnson MS, Taylor BL. Differentiation between electron transport sensing and proton motive force sensing by the Aer and Tsr receptors for aerotaxis. Mol Microbiol. 2006;62:823–837. doi: 10.1111/j.1365-2958.2006.05411.x. [DOI] [PMC free article] [PubMed] [Google Scholar]
- 15.Elderkin S, Jones S, Schumacher J, et al. Mechanism of action of the Escherichia coli phage shock protein PspA in repression of the AAA family transcription factor PspF. J Mol Biol. 2002;320:23–37. doi: 10.1016/S0022-2836(02)00404-7. [DOI] [PubMed] [Google Scholar]
- 16.Engl C, Jovanovic G, Lloyd LJ, et al. In vivo localisations of membrane stress controllers PspA and PspG in Escherichia coli. Mol Microbiol. 2009;73:382–396. doi: 10.1111/j.1365-2958.2009.06776.x. [DOI] [PMC free article] [PubMed] [Google Scholar]
- 17.Eriksson S, Lucchini S, Thompson A, et al. Unravelling the biology of macrophage infection by gene expression profiling of intracellular Salmonella enterica. Mol Microbiol. 2003;47:103–118. doi: 10.1046/j.1365-2958.2003.03313.x. [DOI] [PubMed] [Google Scholar]
- 18.Georgellis D, Lynch AS, Lin EC. In vitro phosphorylation study of the arc two-component signal transduction system of Escherichia coli. J Bacteriol. 1997;179:5429–5435. doi: 10.1128/jb.179.17.5429-5435.1997. [DOI] [PMC free article] [PubMed] [Google Scholar]
- 19.Georgellis D, Kwon O, Lin ECC. Quinones as the redox signal for the Arc two-component system of bacteria. Science. 2001;292:2314–2316. doi: 10.1126/science.1059361. [DOI] [PubMed] [Google Scholar]
- 20.Iuchi S, Lin EC. arcA (dye), a global regulatory gene in Escherichia coli mediating repression of enzymes in aerobic pathways. Proc Natl Acad Sci USA. 1988;85:1888–1892. doi: 10.1073/pnas.85.6.1888. [DOI] [PMC free article] [PubMed] [Google Scholar]
- 21.Iuchi S, Cameron DC, Lin EC. A second global regulator gene (arcB) mediating repression of enzymes in aerobic pathways of Escherichia coli. J Bacteriol. 1989;171:868–873. doi: 10.1128/jb.171.2.868-873.1989. [DOI] [PMC free article] [PubMed] [Google Scholar]
- 22.Joly N, Burrows PC, Engl C, et al. A lower-orderoligomer form of phage shock protein A (PspA) stably associates with the hexameric AAA(+) transcription activator protein PspF for negative regulation. J Mol Biol. 2009;394:764–775. doi: 10.1016/j.jmb.2009.09.055. [DOI] [PMC free article] [PubMed] [Google Scholar]
- 23.Joly N, Engl C, Jovanovic G, et al. Managing membrane stress: the Phage shock protein (Psp) response, from molecular mechanisms to physiology. FEMS Microbiol Rev. 2010;34(5):797–827. doi: 10.1111/j.1574-6976.2010.00240.x. [DOI] [PubMed] [Google Scholar]
- 24.Jones SE, Lloyd LJ, Tan KK, et al. Secretion defects that activate the phage shock response of Escherichia coli. J Bacteriol. 2003;185:6707–6711. doi: 10.1128/JB.185.22.6707-6711.2003. [DOI] [PMC free article] [PubMed] [Google Scholar]
- 25.Jovanovic G, Lloyd LJ, Stumpf MP, et al. Induction and function of the phage shock protein extracytoplasmic stress response in Escherichia coli. J Biol Chem. 2006;281:21147–21161. doi: 10.1074/jbc.M602323200. [DOI] [PubMed] [Google Scholar]
- 26.Jovanovic G, Engl C, Buck M. Physical, functional and conditional interactions between ArcAB and phage shock proteins upon secretin-induced stress in Escherichia coli. Mol Microbiol. 2009;74:16–28. doi: 10.1111/j.1365-2958.2009.06809.x. [DOI] [PMC free article] [PubMed] [Google Scholar]
- 27.Jovanovic G, Engl C, Mayhew AJ, Burrows PC, Buck M (2010) Properties of the phage shock protein (Psp) regulatory complex that govern signal transduction and induction of the Psp response in Escherichia coli. Microbiology [Epub ahead of print] [DOI] [PMC free article] [PubMed]
- 28.Kitagawa M, Ara T, Arifuzzaman M, et al. Complete set of ORF clones of Escherichia coli ASKA library (a complete set of E. coli K-12 ORF archive): unique resources for biological research. DNA Res. 2005;12:291–299. doi: 10.1093/dnares/dsi012. [DOI] [PubMed] [Google Scholar]
- 29.Kleerebezem M, Crielaard W, Tommassen J. Involvement of stress protein PspA (phage shock protein A) of Escherichia coli in maintenance of the proton motive force under stress conditions. EMBO J. 1996;15:162–171. [PMC free article] [PubMed] [Google Scholar]
- 30.Kobayashi R, Suzuki T, Yoshida M. Escherichia coli phage-shock protein A (PspA) binds to membrane phospholipids and repairs proton leakage of the damaged membranes. Mol Microbiol. 2007;66:100–109. doi: 10.1111/j.1365-2958.2007.05893.x. [DOI] [PubMed] [Google Scholar]
- 31.Lloyd LJ, Jones SE, Jovanovic G, et al. Identification of a new member of the phage shock protein response in Escherichia coli, the phage shock protein G (PspG) J Biol Chem. 2004;279:55707–55714. doi: 10.1074/jbc.M408994200. [DOI] [PubMed] [Google Scholar]
- 32.Malpica R, Franco B, Rodriguez C, et al. Identification of a quinone-sensitive redox switch in the ArcB sensor kinase. Proc Natl Acad Sci USA. 2004;101:13318–13323. doi: 10.1073/pnas.0403064101. [DOI] [PMC free article] [PubMed] [Google Scholar]
- 33.Miller JH. A short course in bacterial genetics: a laboratory manual and handbook for Escherichia coli and related bacteria. Cold Spring Harbor: Cold Spring Harbor Laboratory; 1992. [Google Scholar]
- 34.Model P, Jovanovic G, Dworkin J. The Escherichia coli phage-shock-protein (psp) operon. Mol Microbiol. 1997;24:255–261. doi: 10.1046/j.1365-2958.1997.3481712.x. [DOI] [PubMed] [Google Scholar]
- 35.Paul K, Erhardt M, Hirano T, et al. Energy source of flagellar type III secretion. Nature. 2008;451:489–492. doi: 10.1038/nature06497. [DOI] [PubMed] [Google Scholar]
- 36.Rappas M, Schumacher J, Beuron F, et al. Structural insights into the activity of enhancer binding proteins. Science. 2005;307:1972–1975. doi: 10.1126/science.1105932. [DOI] [PMC free article] [PubMed] [Google Scholar]
- 37.Rowley G, Spector M, Kormanec J, et al. Pushing the envelope: extracytoplasmic stress responses in bacterial pathogens. Nat Rev Microbiol. 2006;4:383–394. doi: 10.1038/nrmicro1394. [DOI] [PubMed] [Google Scholar]
- 38.Sawers RG. Differential turnover of the multiple transcripts of the Escherichia focA-pflB operon. Microbiology. 2006;152:2197–2205. doi: 10.1099/mic.0.28951-0. [DOI] [PubMed] [Google Scholar]
- 39.Soballe B, Poole RK. Microbial ubiquinones: multiple roles in respiration, gene regulation and oxidative stress management. Microbiology. 1999;145:1817–1830. doi: 10.1099/13500872-145-8-1817. [DOI] [PubMed] [Google Scholar]
- 40.Suvarna K, Stevenson D, Meganathan R, et al. Menaquinone (vitamin K2) biosynthesis: localization and characterization of the menA gene from Escherichia coli. J Bacteriol. 1998;180:2782–2787. doi: 10.1128/jb.180.10.2782-2787.1998. [DOI] [PMC free article] [PubMed] [Google Scholar]
- 41.Unden G. Differential roles for menaquinone and demethylmenaquinone in anaerobic electron transport of E. coli and their fnr independent expression. Arch Microbiol. 1988;150:499–503. doi: 10.1007/BF00422294. [DOI] [PubMed] [Google Scholar]
- 42.Vrancken K, Van Mellaert L, Anne J. Characterization of the Streptomyces lividans PspA response. J Bacteriol. 2008;190:3475–3481. doi: 10.1128/JB.01966-07. [DOI] [PMC free article] [PubMed] [Google Scholar]
- 43.Wallace BJ, Young IG. Role of quinones in electron transport to oxygen and nitrate in Escherichia coli. Studies with a ubiA− menA− double quinone mutant. Biochim Biophys Acta. 1977;461:84–100. doi: 10.1016/0005-2728(77)90071-8. [DOI] [PubMed] [Google Scholar]
- 44.Wang P, Kuhn A, Dalbey RE. Global change of gene expression and cell physiology in YidC-depleted Escherichia coli. J Bacteriol. 2010;192:2193–2209. doi: 10.1128/JB.00484-09. [DOI] [PMC free article] [PubMed] [Google Scholar]
- 45.Westphal S, Heins L, Soll J, et al. Vipp1 deletion mutant of Synechocystis: a connection between bacterial phage shock and thylakoid biogenesis? Proc Natl Acad Sci USA. 2001;98:4243–4248. doi: 10.1073/pnas.061501198. [DOI] [PMC free article] [PubMed] [Google Scholar]
- 46.Wigneshweraraj S, Bose D, Burrows PC, et al. Modus operandi of the bacterial RNA polymerase containing the sigma54 promoter-specificity factor. Mol Microbiol. 2008;68:538–546. doi: 10.1111/j.1365-2958.2008.06181.x. [DOI] [PubMed] [Google Scholar]
- 47.Wissenbach U, Ternes D, Unden G. An Escherichia coli mutant containing only demethylmenaquinone, but no menaquinone: effects on fumarate, dimethylsulfoxide, trimethylamine N-oxide and nitrate respiration. Arch Microbiol. 1992;158:68–73. doi: 10.1007/BF00249068. [DOI] [PubMed] [Google Scholar]
Associated Data
This section collects any data citations, data availability statements, or supplementary materials included in this article.


