Abstract
Clinical electroporation (EP) is a rapidly advancing treatment modality that uses electric pulses to introduce drugs or genes into, e.g., cancer cells. The indication of successful EP is an instant plasma membrane permeabilization in the treated tissue. A noninvasive means of monitoring such a tissue reaction represents a great clinical benefit since, in case of target miss, retreatment can be performed immediately. We propose diffusion-weighted magnetic resonance imaging (DW-MRI) as a method to monitor EP tissue, using the concept of the apparent diffusion coefficient (ADC). We hypothesize that the plasma membrane permeabilization induced by EP changes the ADC, suggesting that DW-MRI constitutes a noninvasive and quick means of EP verification. In this study we performed in vivo EP in rat brains, followed by DW-MRI using a clinical MRI scanner. We found a pulse amplitude–dependent increase in the ADC following EP, indicating that (1) DW-MRI is sensitive to the EP-induced changes and (2) the observed changes in ADC are indeed due to the applied electric field.
Keywords: Electroporation, Magnetic resonance imaging, Diffusion-weighted, Treatment verification, Brain, Tumor
Introduction
When biological tissue is exposed to an electric field of a certain minimum intensity the phospho-lipid configuration of the plasma membrane of the tissue cells may be changed focally. This phenomenon is known as “electroporation” (EP), and when applied efficiently it leads to plasma membrane permeabilization, which can be utilized to transfer exogenous molecules into the cells (Neumann et al. 1982). EP has proven its clinical value, e.g., when used in combination with cytotoxic drugs, mostly bleomycin, showing good response in targets such as cutaneous metastases from disseminated malignant melanoma, breast cancer, and head and neck cancer (Heller et al. 1999; Marty et al. 2006; Mir et al. 2006; Campana et al. 2009; Matthiessen et al. 2009). Currently, technologies to deliver EP-based treatments also to deep-seated tumors are emerging (Agerholm-Larsen et al. 2009; Miklavcic et al. 2010; Garcia et al. 2010). This progression in clinical utilization warrants increased research in practical tools for verification of the delivered treatments.
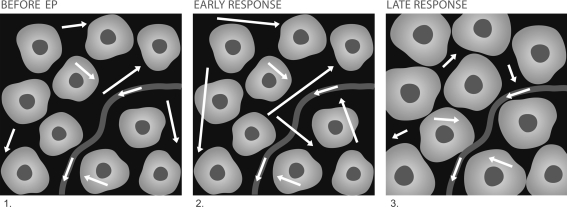
One of the immediate physical effects of EP is an increased conductivity (σ) of the exposed tissue (Kinosita and Tsong 1979), suggesting that the ionic current is less restricted by the plasma membranes, i.e., that the ionic migration involves to some extent the intracellular space as well. Later (minutes/hours) tissue effects of EP can sometimes be observed as a decrease in σ, below the initial conductivity level (before EP) (Fig. 1). This effect has been related to membrane resealing in combination with a reduction of the extracellular space due to cytotoxic edema. One plausible explanation is that the NA,K-ATPase pumps are unable to compensate for the increased transmembrane diffusion of ions, resulting in increased intracellular content of sodium and water (Abidor et al. 1994; Hojman et al. 2008; Ivorra et al. 2009). At static or low-frequency conditions, the diffusion coefficient (D) of water molecules within the tissue is linearly related to σ:
 |
1 |
where r w and r i are the Stokes radii of water molecules and the ion, respectively; q is the charge of the ion; N is the ionic density; k is the Boltzmann constant; and T is the temperature (Sekino et al. 2003).
Fig. 1.
An artistic representation of the proposed model of water diffusion in tissue following EP: White arrows illustrate the random movement of water molecules, arrow lengths correspond to the impact-free motion, curved line represents a blood vessel, and light uniform structures on the dark background represent cells, with nuclei shown as dark spots. Before EP: restricted motion; cell membranes are intact. Early response: occurs immediately after onset of the voltage pulse and can last for several minutes after EP, less restricted motion due to increased permeability of the plasma membranes. Late response: occurs minutes/hours after treatment, cell swelling and membrane resealing limit the random motion of the water molecules
Electric impedance tomography has already been demonstrated as a tool to detect EP-induced conductivity changes in tissue (Davalos et al. 2002; Granot et al. 2009). This technique is able to acquire data with a time resolution that is superior to all other known techniques (tens of milliseconds), but due to serious drawbacks, such as low spatial resolution and impractical measuring procedure, it has not become integrated with the clinical setting. Morphological magnetic resonance imaging (MRI) has been used to assess tissue regions treated with electric fields as well (Hjouj and Rubinsky 2010). This modality, however, has been successful only at verifying treatments based on irreversible cell permeabilization (irreversible EP). The objective of irreversible EP is to eradicate a tumor through the application of high-intensity electric fields or long exposure times at moderate field intensities (Gehl et al. 2002; Rebersek and Miklavcic 2010), in the absence of drugs (Aung et al. 2009; Hjouj and Rubinsky 2010; Zhang et al. 2010). To overcome the limitations of these existing monitoring techniques, we suggest diffusion-weighted MRI (DW-MRI) as a possible method for detecting the local EP-induced cellular and extracellular changes.
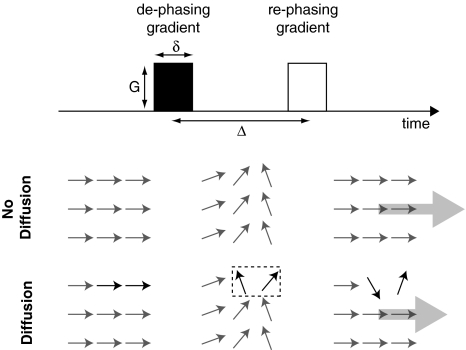
A more complete description of the physics of DW-MRI may be found elsewhere (e.g., Callaghan 1991), but we provide here a conceptual description of the technique. In the standard DW-MRI procedure, pulsed magnetic gradients are utilized to determine the mean-squared displacement, <r 2>, of an ensemble of water molecules over a diffusion time, Δ. The diffusion coefficient, D, is related to <r 2> by the Einstein equation <r 2> = 6DΔ (for diffusion in three dimensions). The magnetic gradients are applied as pairs, with the first pulse (dephasing gradient) labeling the phase of the transverse magnetization from the water molecules and the second pulse (rephasing gradient) reversing the phase exactly, in case of static water molecules (Fig. 2). If the water molecules have moved (diffused) during the diffusion time, Δ, a net phase difference will remain after the application of the rephasing pulse. The mixing of different phases caused by the diffusion will result in a reduction of the signal within the sample. Thus, if the water molecules have limited motion, the signal intensity, S, will be high; and if the water molecules have less restricted motion, the signal intensity will be low.
Fig. 2.
A simplified pulsed gradient spin-echo sequence used in standard DW-MRI, showing only the gradient pairs (top), and a schematic representation of the magnetic spin orientation of an ensemble of protons (water molecules). In the situation of no diffusion, the rephasing gradient exactly cancels the phase difference induced by the dephasing gradient, and the net magnetization of the ensemble is large (strong signal). In the case of diffusion, illustrated as two water molecules switching location during the diffusion time Δ, the rephasing gradient does not eliminate the phase differences of the diffused molecules, and the resulting magnetization and signal is weaker
In biological tissue, molecular diffusion is confined within different compartments (e.g., extracellular and intracellular space), and the physical diffusion coefficient, D, is therefore replaced by the so-called apparent diffusion coefficient (ADC), representing the diffusion averaged over different contributors. The ADC is derived using the formalism of Stejskal and Tanner (1965):
 |
2 |
where S(b) and S(0) are the signal intensities with and without the application of the magnetic gradient (sometimes termed “motion-sensitive gradient”), respectively, expressed through the attenuation factor b, defined as
 |
3 |
where γ is the gyromagnetic ratio, G is the intensity of the gradient magnetic field and δ is the duration of the magnetic gradient pulses.
Based on the experimental fact that EP induces conductivity changes and on the proportionality between σ and D shown in Eq. 1, we hypothesize that tissue that has been electroporated efficiently is detectable by DW-MRI.
In this study, we applied the DW-MRI method to rat brains in vivo, to investigate the change in diffusion conditions following an EP procedure in the brain. We demonstrate the feasibility of the method using a clinical MR scanner and assess the EP tissue quantitatively in terms of the ADC. Unlike conventional MRI, DW-MRI provides, with the ADC, a quantitative assessment of the target tissue and therefore relies less on the individual physician/operator, although the spatial resolution of the ADC maps is usually high enough to allow visual inspection as well. Due to the practicality and speed of DW-MRI, it gives the physician the opportunity to retreat on the fly in case of target miss. Most importantly, since MRI scanners are available in most radiological departments, we believe that this technique has the potential to become a standard tool in future EP-based treatments.
Materials and Methods
Animal Model
Five Sprague–Dawley male rats (300–350 g) were used in this study, two for each voltage condition and one as control (0 V). Animals were fully anesthetized for surgical procedures (2.7 ml/kg body weight given s.c.) with fentanyl fluanisone combination (Hypnorm; VetaPharma, Leeds, UK), midazolam (Dormicum; Hoffmann-La Roche, Basel Switzerland) and sterile H2O (1:1:2 mixture). The skin was incised to expose the skull, and a 5-mm burr hole was made in the skull through which the electrodes of the eight-electrode device (Fig. 3, top) were deployed to a depth of 5 mm into the brain. The total surgical procedure took less than 20 min. The study was approved by the Danish Animal Experiments Inspectorate.
Fig. 3.
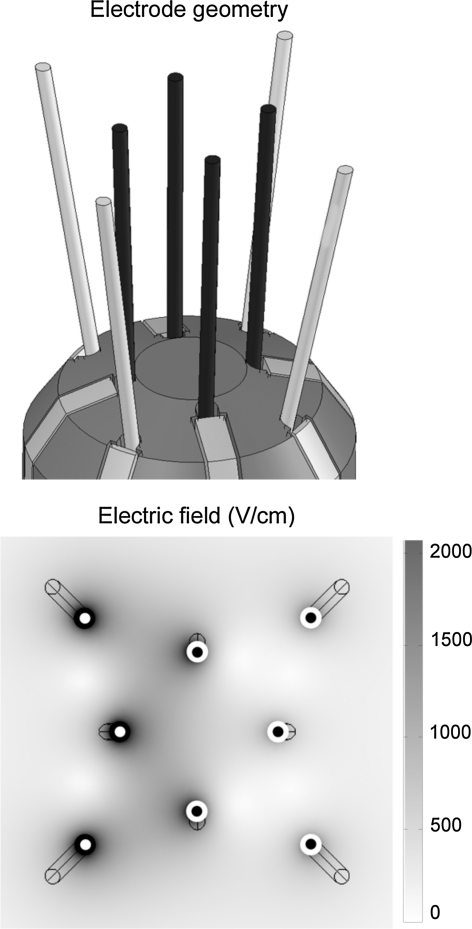
Top the dedicated rat brain electrode device: four parallel inner electrodes and four angled outer electrodes of 0.2 mm diameter each. The diagonal tip distances of inner and outer electrodes are 2.3 and 5.2 mm, respectively. The electrodes have a Pd core and a shell made of 35N LT® (Forte Wayne Metals, Fort Wayne, IN). Bottom top view of the electrode positions and the electric field distribution at one particular polarity configuration. White and black dots correspond to opposing polarities. The configuration is “rotated” 90° three times to cover the target tissue, and eight full revolutions are required to complete the EP procedure. The electric field distribution is for the plane perpendicular to the inner electrode plane halfway in the conducting part and shows that the average electric field strength is about 1,000 V/cm in the targeted area, when the high-voltage condition (200 V) is applied
In Vivo EP
We used a dedicated eight-electrode device (Fig. 3, top) to electroporate normal brain tissue in the animals (Agerholm-Larsen et al. 2009). The electrodes were deployed 5 mm into the tissue, with the distal 3 mm of the electrode being electricity-conductive. Thirty-two pulses were delivered (Fig. 3, bottom), each of 0.1 ms duration at 1 Hz. Three conditions were used: 0 V (control), 100 V (low-voltage condition) and 200 V (high-voltage condition). The pulses were delivered with a square wave voltage generator (Cliniporator; IGEA, Carpi, Italy). The pulse delivery took less than 1 min.
This EP setup has been proven successful in a previous study by Agerholm-Larsen et al. (2009), where the cytotoxic drug bleomycin was delivered to brain tumors in a rat brain tumor model. The experiment demonstrated that a pulse amplitude of 100 V is sufficient to obtain a significant tumor response based on reversible EP since neither electric field pulses alone nor intratumoral administration of bleomycin alone yielded any considerable tumor response. Histology reinforced these assumptions (see Agerholm-Larsen et al. 2009).
MR Protocol
The first DW-MRI scan was initiated within 4 min after the end of the pulse delivery, and thereafter scans were repeated with approximately 5-min intervals for a total time course of about 20 min. DW-MRI scans were implemented using a generic single-shot, fat-saturated, spin-echo DWIBS sequence with TR/TE of 4,000 ms/80 ms, FOV of 35 × 35 mm and slice thickness of 1 mm. The voxel size was 0.5 × 0.5 mm and the acquisition matrix 72 × 69. Images for two values of the motion gradients (b = 0 and b = 1,000) in the direction along the electrodes (anterior–posterior, or AP) were recorded, and the apparent diffusion equation was derived by the scanner software (MR Systems Achieva, release 2.6.3.5; Philips Healthcare, Best, the Netherlands). With regular time intervals, T2-weighted images were recorded in order to monitor the extent of any edemas. This scan was planned at the same coordinates and recorded in the same direction as the DWIs, with TR/TE of 4,155 ms/100 ms, thickness 1 mm, FOV 50 × 50 mm and matrix 248 × 248. The duration of the DW-MRI scans was below 1 min and the duration of the T2-weighted scans was 2 min, 38 s. All scans were performed on a clinical 3T Philips Achieva system (Philips Healthcare), using a specially adapted animal coil (Shanghai Chenguang Medical Technology, Shanghai, China). These settings should be considered a compromise between the requirement of short acquisition times and high ADC contrast.
Electric Field Calculation
The electric field distribution (Fig. 3, bottom) was calculated using finite element method software (COMSOL Multiphysics 3.5a; Comsol, Stockholm, Sweden), on a 64-bit Linux platform. The tissue was assumed to be homogeneous with constant conductivity.
Results
Data only from the first experiment (n = 1 in each condition) are presented in Figs. 4, 5 and 6. However, all experimental conditions (with applied voltage) were repeated independently, showing the same result.
Fig. 4.
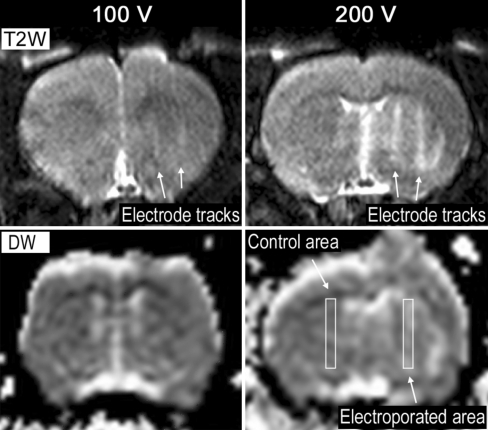
Top T2-weighted (T2W) transaxial image of rat brain showing the electrode tracks from two electrodes after right hemisphere EP, acquired about 10 min after EP. The EP area is defined as the region between the electrode tracks. The left hemisphere was used as a control area and, as expected, showed no reaction for either voltage condition. Bottom mapping of the derived ADCs: bright areas correspond to higher diffusion coefficients, darker areas correspond to lower diffusion coefficients. Rectangular areas outline the EP area (between the electrode tracks shown in the T2-weighted image) and the control area in the contralateral hemisphere, respectively. ADCs correspond to measurements about 14 min after EP
Fig. 5.
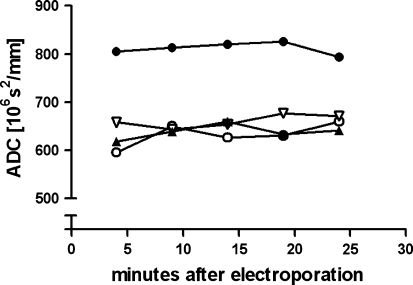
The ADC of different regions in the brain at different time points after EP using the high-voltage condition (200 V/cm). The EP region (filled circle) shows a significantly higher ADC compared to the electrode track regions (filled triangle and empty triangle) and the contralateral hemisphere (empty circle). Data are for one animal. SD ≈ 100 of each data point
Fig. 6.
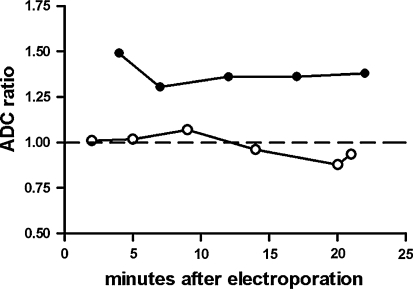
The ADC change over time for the 100 V (empty circle) and 200 V (filled circle) conditions. The ADC ratio is defined as the ADC of the EP region divided by the ADC of the control region in the contralateral hemisphere. Data are for one animal in each voltage condition. SD ≈ 0.15 of each graph point
Figure 4 shows the T2-weighted images and the derived ADC maps for the low-voltage and high-voltage conditions, respectively. The low-voltage condition (100 V) corresponds to an electric field intensity of roughly 500 V/cm as shown in the bottom part of Fig. 3 (rescaled using a multiplication factor of 0.5, corresponding to a halving of the applied voltage). In the low-voltage condition, it is barely possible to see two electrode tracks in the T2-weighted image and nothing is observed in the ADC map by visual inspection. This is supported by the ADC ratio for the 100 V situation shown in Fig. 6, which indicates that the control area and the electroporated areas have similar ADC values.
In the high-voltage condition (200 V), the generated electric field has an intensity of about 1,000 V/cm (Fig. 3, bottom) and the electrode tracks become clearly visible in the T2-weighted image (Fig. 4, top right). The ADC map also shows some changes in the image intensity, although the spatial resolution is much lower compared to the T2-weighted image. The EP area is not easily evaluated in the T2-weighted image, but a slight general increase in signal intensity in that region is seen. Figure 5 shows the ADC values of the EP area in comparison to the ADC values of the electrode track areas and control area in the contralateral hemisphere, respectively. As seen, only the EP area shows an elevated ADC, about 30% higher compared to the other areas. This implies that different tissue reactions are dominant in the electrode track areas and the EP area, information that is not extractable by the T2-weighted image alone. In the total scan time (about 20 min) the ADC of the different areas remained constant (Fig. 5). In Fig. 6 both voltage conditions are compared in terms of their ADC ratios, showing 30% difference between the low-voltage and high-voltage conditions.
In addition to the reported results, we conducted control experiments where only surgery or surgery + electrode deployment (no pulses) was carried out. None of the control experiments showed significant change in the ADC, confirming that the observed effect is due to tissue changes induced by the electric field.
Discussion
MRI has become a standard imaging method in the clinical setting, and EP is gaining importance in the clinic for the delivery of drugs and genes. In this study we show that DW-MRI may be an excellent way to investigate membrane permeabilization due to EP. We find that DW-MRI is not only fast and easily obtainable but also able to indicate permeabilization.
A number of assumptions and simplifications have been made in our study as far as the electric field distribution is concerned. For example, the non-ohmic nature of the tissue in terms of the electric field-dependent conductivity (Pliquett et al. 1995; Sel et al. 2005; Ivorra et al. 2009) has been omitted. Numerical studies suggest that electric field models that account for this nonlinearity enclose a slightly larger volume for typical pulse durations and field intensities (Sel et al. 2005; Pavselj et al. 2005; Pavselj and Miklavcic 2008). The main reason for not implementing this feature is the limitation of the electric property data on brain tissue, in particular. This and other extensions to the electric field model are not considered critical for demonstrating the general feasibility of the method since the effects are considered relatively small.
The High-Voltage Condition
EP occurs when the intensity of the electric field in the tissue surpasses a certain value. Reversible EP is a result of temporary perturbations of the plasma membrane, whereas irreversible EP reflects induction of more pronounced changes in the phospholipid layers, leaving the membrane unable to reseal (Gehl et al. 2002; Rebersek and Miklavcic 2010). Reversible EP lasts for a few minutes at physiological temperature, depending on the tissue and the electric pulse parameters, after which the cells regain molecular homeostasis (Rols and Teissie 1990; Saulis et al. 1991). Our data show a sustained increase of the ADC level for the EP region in the entire measuring time that ended approximately 25 min after delivery of the electric field. One interpretation of this result is that the brain tissue has been irreversibly electroporated, meaning that the plasma membrane does not reseal and, consequently, the conductivity of the EP tissue remains high during the scanning period. Another explanation is that the fluidity of the EP region is increased due to inflammatory reactions of the tissue. However, such tissue reactions should probably be more visible in the T2-weighted images than what was observed. The region of the electrode tracks showed no elevation in the ADC despite high electric field intensity here. This is possibly due to the combined effect of a high degree of membrane permeabilization and related cytotoxic edema, which reduces extracellular space. Histology and assessment of the degree of edema are planned in future experimental work for all voltage conditions.
The Low-Voltage Condition
The increased membrane permeability corresponding to reversible EP (low-voltage condition) has been shown to be accessible by DW-MRI in a numerical study by Imae et al. (2008). Therefore, we expected to detect an increase in ADC in the first minutes following the low field EP. Possibly a further fine-tuning of the MR settings will allow for reversible EP to be detected. Another possible approach is to reduce the time from delivery of EP to the first DW-MRI measurement since the conductivity is increased considerably during the electric pulse delivery but decreases very quickly as the electric field is removed (Ivorra et al. 2009). It should also be kept in mind that in the identical EP setup tumors were electroporated, whereas in the present experiment the voltage pulses were delivered to normal brain tissue. It is therefore possible that the absence of an ADC change merely reflects the cell type differentiated effect of EP; i.e., permeabilization of the membrane has not been achieved.
Edema
When the plasma membrane is permeabilized, the membrane conductivities for sodium and potassium are altered and the following unbalanced osmotic pressure drives sodium ions into the intracellular space and potassium ions out into the extracellular space. However, the influx of ions is greater than the outflux since the increase in conductivity is relatively larger for sodium than for potassium. This imbalance is not immediately compensated by the increased activity of the NA,K-ATPase pumps, and as a consequence, water enters the cell and, in combination with plasma membrane resealing, cell swelling is seen (cytotoxic edema) (Abidor et al. 1994; Hojman et al. 2008; Ivorra et al. 2009). We expected to observe this cell response as a slight decrease in the ADC of the EP tissue under low-voltage conditions (100 V, 500 V/cm) in the late post-EP phase (Ivorra et al. 2009). The failure to see this effect could be related to the fact that the change in ADC was too small to be measured with the suggested settings. The limited size of the regions involved in the ADC assessment (about 3 mm2) made this task difficult compared to the clinical situation, where we expect to perform ADC assessments on areas (cross sections) about 100- to 200-fold larger (Mahmood and Gehl 2011).
Vascular Reactions
It is suggested that in vivo EP induces vascular reactions that are observed as two distinct local perfusion effects (Gehl et al. 2002). First, the vascular reflexive constriction of the afferent arterioles mediated by the sympathetic nervous system results in a delay in perfusion (defined as the time difference in vascular distribution of a dye between pulsed and unpulsed conditions) of the permeabilized tissue, depending on the field intensity and the pulse duration. According to Gehl et al. (2002) a perfusion delay on the order of 200 s can be expected (in muscle tissue) for the high-voltage condition, whereas the perfusion delay should be negligible in the low-voltage condition. Second, it is suggested that EP increases the interstitial pressure and permeabilizes the capillaries, leaving them less resistant to the increased external pressure. A locally reduced flow in the blood vessels is the proposed outcome of this. This effect follows the kinetics of membrane resealing after EP, and according to the proposed model, a full normalization of perfusion is expected 10–15 min after pulse delivery in the high-voltage condition (1,000 V/cm). The reduction of vascular perfusion is measurable by DW-MRI (e.g., Choi et al. 2000); however, this is not easily extractable from our results since our data most probably reflect the combined effect of many reactions (reversibly permeabilized membrane, irreversibly permeabilized membrane, edema, blood flow reduction). To separately evaluate the contributions of the various tissue reactions, specific perfusion measurements would be needed. The proposed diffusion model (Fig. 1) does not consider the blood perfusion changes, which, if included, shorten (or remove) the arrows (diffusion contribution) depicted in the blood vessel after EP and thus should result in a decrease in the ADC. However, it is not known whether the vascular reactions in muscle tissue can be translated directly into the EP-induced vascular reactions in brain tissue. Nevertheless, we believe that vascular reactions are present in brain tissue as well and might help to explain some features of our ADC data. In future studies the vascular reactions might be assessed to enable a more detailed picture of the EP-induced ADC changes.
The ADC
The concept of using the ADC to make clinical assessments after clinical interventions is not new; e.g., it has already proven its value for tumor staging and tumor response assessment after tumor irradiation in radiation therapy (Koh and Collins 2007). Use of the ADC has the obvious clinical benefit that the treated tissue can be evaluated quantitatively. This gives the opportunity to assess more clearly both the extent of the region that has received the treatment and the degree of tissue effect. This is seen as a great advantage over morphological MRI, regardless of whether DWI-MR is better than or equal to conventional MRI in terms of sensitivity to EP tissue. Dose-escalation experiments using increasing voltage amplitudes are important to investigate further the strength of this technique.
Conclusions
DW-MRI is a promising technique for the detection of EP tissue. In this preclinical study we have demonstrated the feasibility of the method, which can easily be translated into clinical use since our experiments were conducted using a human MRI scanner. This is a great advantage over, e.g., impedance tomography imaging, which is not in standard clinical use. The initial results indicate that DW-MRI is sensitive to the tissue changes that follow in the minutes after EP of brain tissue using the high field intensity. This confirms that the change in the ADC is caused by the electric field. The prolonged elevation of the diffusion coefficient may be an indication of irreversible EP or may reflect a delayed normalization. This study fails to demonstrate that DW-MRI is superior to T2-weighted MRI for assessing reversibly electroporated brain tissue, but it still must be regarded as a better technique since a quantitative analysis of the EP tissue is made possible. A decisive conclusion, however, requires further research in order to elucidate how the change in the ADC is related to the change in the permeabilization state of the tissue, e.g., through histological analysis and other techniques. These steps are currently being planned. Also, further exploration of optimal DW-MRI settings is necessary.
Open Access
This article is distributed under the terms of the Creative Commons Attribution Noncommercial License which permits any noncommercial use, distribution, and reproduction in any medium, provided the original author(s) and source are credited.
References
- Abidor IG, Li LH, Hui SW. Studies of cell pellets: II. Osmotic properties, electroporation, and related phenomena: membrane interactions. Biophys J. 1994;67:427–435. doi: 10.1016/S0006-3495(94)80498-9. [DOI] [PMC free article] [PubMed] [Google Scholar]
- Agerholm-Larsen B, Iversen H, Ibsen P, Moeller J, Staal L, Salford LG, Gehl J. Electrochemotherapy for brain tumours investigated in vivo. Neurooncology. 2009;11:597. [Google Scholar]
- Aung W, Hasegawa S, Koshikawa-Yano M, Obata T, Ikehira H, Furukawa T, Aoki I, Saga T. Visualization of in vivo electroporation-mediated transgene expression in experimental tumors by optical and magnetic resonance imaging. Gene Ther. 2009;16:830–839. doi: 10.1038/gt.2009.55. [DOI] [PubMed] [Google Scholar]
- Callaghan PT. Principles of nuclear magnetic resonance microscopy. 1. Oxford: Oxford University Press; 1991. pp. 157–167. [Google Scholar]
- Campana LG, Mocellin S, Basso M, Puccetti O, Salvo GLD, Chiarion-Sileni V, Vecchiato A, Corti L, Rossi CR, Nitti D. Bleomycin-based electrochemotherapy: clinical outcome from a single institution’s experience with 52 patients. Ann Surg Oncol. 2009;16:191–199. doi: 10.1245/s10434-008-0204-8. [DOI] [PubMed] [Google Scholar]
- Choi SH, Na DL, Chung CS, Lee KH, Na DG, Adair JC. Diffusion-weighted MRI in vascular dementia. Neurology. 2000;54:83–90. doi: 10.1212/wnl.54.1.83. [DOI] [PubMed] [Google Scholar]
- Davalos RV, Rubinsky B, Otten BM. A feasibility study for electrical impedance tomography as a means to monitor tissue electroporation for molecular medicine. IEEE Trans Biomed Eng. 2002;49:400–403. doi: 10.1109/10.991168. [DOI] [PubMed] [Google Scholar]
- Garcia PA, Rossmeisl JH, Jr, Neal RE, II, Ellis TL, Olson JD, Henao-Guerrero N, Robertson J, Davalos RV. Intracranial nonthermal irreversible electroporation: in vivo analysis. J Membr Biol. 2010;236:127–136. doi: 10.1007/s00232-010-9284-z. [DOI] [PubMed] [Google Scholar]
- Gehl J, Skovsgaard T, Mir LM. Vascular reactions to in vivo electroporation: characterization and consequences for drug and gene delivery. Biochim Biophys Acta. 2002;1569:51–58. doi: 10.1016/s0304-4165(01)00233-1. [DOI] [PubMed] [Google Scholar]
- Granot Y, Ivorra A, Maor E, Rubinsky B. In vivo imaging of irreversible electroporation by means of electrical impedance tomography. Phys Med Biol. 2009;54:4927–4943. doi: 10.1088/0031-9155/54/16/006. [DOI] [PubMed] [Google Scholar]
- Heller R, Gilbert R, Jaroszeski MJ. Clinical applications of electrochemotherapy. Adv Drug Deliv Rev. 1999;35:119–129. doi: 10.1016/S0169-409X(98)00067-2. [DOI] [PubMed] [Google Scholar]
- Hjouj M, Rubinsky B. Magnetic resonance imaging characteristics of nonthermal irreversible electroporation in vegetable tissue. J Membr Biol. 2010;236:137–146. doi: 10.1007/s00232-010-9281-2. [DOI] [PubMed] [Google Scholar]
- Hojman P, Gissel H, Andre FM, Cournil-Henrionnet C, Eriksen J, Gehl J, Mir LM. Physiological effects of high- and low-voltage pulse combinations for gene electrotransferin muscle. Hum Gene Ther. 2008;19:1249–1260. doi: 10.1089/hum.2008.059. [DOI] [PubMed] [Google Scholar]
- Imae T, Shinohara H, Sekino M, Ueno S, Ohsaki H, Mima K, Ootomo K. Estimation of cell membrane permeability of the rat brain using diffusion magnetic resonance imaging. J Appl Phys. 2008;103:07A311-1–07A311-3. doi: 10.1063/1.2830534. [DOI] [PubMed] [Google Scholar]
- Ivorra A, Al-Sakere B, Rubinsky B, Mir LM. In vivo electrical conductivity measurements during and after tumor electroporation: conductivity changes reflect the treatment outcome. Phys Med Biol. 2009;54:5949–5963. doi: 10.1088/0031-9155/54/19/019. [DOI] [PubMed] [Google Scholar]
- Kinosita K, Jr, Tsong TY. Voltage-induced conductance in human-erythrocyte membranes. Biochim Biophys Acta. 1979;554:479–497. doi: 10.1016/0005-2736(79)90386-9. [DOI] [PubMed] [Google Scholar]
- Koh DM, Collins DJ. Diffusion-weighted MRI in the body: applications and challenges in oncology. AJR Am J Roentgenol. 2007;188:1622–1635. doi: 10.2214/AJR.06.1403. [DOI] [PubMed] [Google Scholar]
- Mahmood F, Gehl J (2011) New clinical electrode device for electroporation of intracranial tumors—semiempirical designoptimization and geometrical tolerance assessment. Bioelectrochemistry. doi:10.1016/j.bioelechem.2010.12.002 [DOI] [PubMed]
- Marty M, Sersa G, Garbay JR, Gehl J, Collins CG, Snoj M, Billard V, Geertsen PF, Larkin JO, Miklavcic D, Pavlovic I, Paulin-Kosir SM, Cemazar M, Morsli N, Soden DM, Rudolf Z, Robert C, O’Sullivan GC, Mir LM. Electrochemotherapy—an easy, highly effective and safe treatment of cutaneous and subcutaneous metastases: results of ESOPE (European Standard Operating Procedures of Electrochemotherapy) study. EJC Suppl. 2006;4:3–13. [Google Scholar]
- Matthiessen LW, Kamby C, Hendel HW, Johannesen HH, Gehl J. Electrochemotherapy as palliative treatment for chest wall recurrence of breast cancer—initial results. EJC Suppl. 2009;7:273. [Google Scholar]
- Miklavcic D, Snoj M, Zupanic A, Kos B, Cemazar M, Kropivnik M, Bracko M, Pecnik T, Gadzijev E, Sersa G (2010) Towards treatment planning and treatment of deep-seated solid tumors by electrochemotherapy. Biomed Eng Online 9:10, 1–12 [DOI] [PMC free article] [PubMed]
- Mir LM, Gehl J, Sersa G, Collins CG, Garbay JR, Billard V, Geertsen PF, Rudolf Z, O’Sullivan GC, Marty M. Standard operating procedures of the electrochemotherapy: instructions for the use of bleomycin or cisplatin administered either systemically or locally and electric pulses delivered by the CliniporatorTM by means of invasive or non-invasive electrodes. EJC Suppl. 2006;4:14–25. [Google Scholar]
- Neumann E, Schaeferridder M, Wand Y, Hofschneider PH. Gene transfer into mouse lyoma cell by electroporation in high electric fields. EMBO J. 1982;1:841–845. doi: 10.1002/j.1460-2075.1982.tb01257.x. [DOI] [PMC free article] [PubMed] [Google Scholar]
- Pavselj N, Miklavcic D. Numerical models of skin electropermeabilization taking into account conductivity changes and the presence of local transport regions. IEEE Trans Plasma Sci. 2008;36:1650–1658. doi: 10.1109/TPS.2008.928715. [DOI] [Google Scholar]
- Pavselj N, Bregar Z, Cukjati D, Batiuskaite D, Mir LM, Miklavcic D. The course of tissue permeabilization studied on a mathematical model of a subcutaneous tumor in small animals. IEEE Trans Biomed Eng. 2005;52:1373–1381. doi: 10.1109/TBME.2005.851524. [DOI] [PubMed] [Google Scholar]
- Pliquett U, Langer R, Weaver JC. Changes in the passive electrical properties of human stratum corneum due to electroporation. Biochim Biophys Acta. 1995;1239:111–121. doi: 10.1016/0005-2736(95)00139-T. [DOI] [PubMed] [Google Scholar]
- Rebersek M, Miklavcic D. Concepts of electroporation pulse generation and overview of electric pulse generators for cell and tissue electroporation. In: Pakhomov AG, Miklavcic D, Markov MS, editors. Advanced electroporation techniques in biology and medicine. Boca Raton: Taylor & Francis; 2010. pp. 323–339. [Google Scholar]
- Rols MP, Teissie J. Electropermeabilization of mammalian cells: quantitative analysis of the phenomenon. Biophys J. 1990;58:1089–1098. doi: 10.1016/S0006-3495(90)82451-6. [DOI] [PMC free article] [PubMed] [Google Scholar]
- Saulis G, Aulis G, Venslauskas MS, Naktinis J. Kinetics of pore resealing in cell-membranes after electroporation. Bioelectrochem Bioenerg. 1991;26:1–13. doi: 10.1016/0302-4598(91)87029-G. [DOI] [Google Scholar]
- Sekino M, Yamaguchi K, Iriguchi N, Ueno S. Conductivity tensor imaging of the brain using diffusion-weighted magnetic resonance imaging. J Appl Phys. 2003;93:6730–6732. doi: 10.1063/1.1544446. [DOI] [Google Scholar]
- Sel D, Cukjati D, Batiuskaite D, Slivnik T, Mir LM, Miklavcic D. Sequential finite element model of tissue electropermeabilization. IEEE Trans Biomed Eng. 2005;52:816–827. doi: 10.1109/TBME.2005.845212. [DOI] [PubMed] [Google Scholar]
- Stejskal EO, Tanner JE. Spin diffusion measurements: spin echoes in the presence of a time-dependent field gradient. J Chem Phys. 1965;42:288–292. doi: 10.1063/1.1695690. [DOI] [Google Scholar]
- Zhang Y, Guo Y, Ragin AB, Lewandowski RJ, Yang GY, Nijm GM, Sahakian AV, Omary RA, Larson AC. MR imaging to assess immediate response to irreversible electroporation for targeted ablation of liver tissues: preclinical feasibility studies in a rodent model. Radiology. 2010;256:424–432. doi: 10.1148/radiol.10091955. [DOI] [PMC free article] [PubMed] [Google Scholar]


