

Abstract
Stable isotope probing (SIP) has been used to track nutrient flows in microbial communities, but existing protein-based SIP methods capable of quantifying the degree of label incorporation into peptides and proteins have been demonstrated only by targeting usually less than 100 proteins per sample. Our method automatically (i) identifies the sequence of and (ii) quantifies the degree of heavy atom enrichment for thousands of proteins from microbial community proteome samples. These features make our method suitable for comparing isotopic differences between closely related protein sequences, and for detecting labeling patterns in low-abundance proteins or proteins derived from rare community members. The proteomic SIP method was validated using proteome samples of known stable isotope incorporation levels at 0.4%, ∼50%, and ∼98%. The method was then used to monitor incorporation of 15N into established and regrowing microbial biofilms. The results indicate organism-specific migration patterns from established communities into regrowing communities and provide insights into metabolism during biofilm formation. The proteomic SIP method can be extended to many systems to track fluxes of 13C or 15N in microbial communities.
Nitrogen or carbon flows from 15N- or 13C-enriched substrates into the biomass of a microbial community can be traced by measuring the incorporation of these stable isotopes into biomarkers such as lipids, nucleic acids, and proteins. This technique, called stable isotope probing (SIP)1, has been used to elucidate metabolic activities in microbial communities (1). The first example of SIP used lipids as the biomarker (2). A low level of 13C incorporation in lipids can be determined by gas chromatography-mass spectrometry, but it is generally difficult to link lipids to specific microorganisms. More commonly, DNAs or RNAs are used as the biomarkers for SIP analysis (3). Isotopically labeled nucleic acids are separated from unlabeled nucleic acids using buoyant density gradient centrifugation. Analysis of the separated nucleic acids provides direct information about which microorganisms have incorporated the label. However, gradient centrifugation can only resolve nucleic acids with large differences in the degree of label incorporation. Recently a protein-based SIP method was developed that uses mass spectrometry (MS) to determine the extent of 13C incorporation of peptides and proteins (4–9). Because the degree of label incorporation in proteins and peptides can be determined to high resolution by mass spectrometry, and as proteins and peptides contain sequence information that links each molecule to its organism of origin, protein-based SIP methods enable determination of low levels of isotope incorporation into microorganisms that can be resolved at the strain level.
Early protein SIP studies determined the 13C atom% of up to 38 proteins from a single organism in a pure culture or an enrichment culture. Organisms studied included Methylibium petroleiphilum (8) and Aromatoleum aromaticum (4). In both studies, proteins of unknown 13C atom% were identified by matching their gel spots from two-dimensional gel electrophoresis to spots from unlabeled proteomes. The 13C atom% was estimated using least-square fitting analysis of isotopic distributions of detected peptides. The measured 13C atom% of a limited number of proteins allowed tracking of 13C from a substrate into a species of interest, but this number of proteins is insufficient for intra-organismal, pathway-resolved comparisons of label incorporation dynamics. More recently, a new method based on peptide decimal place slope was developed for protein SIP (7, 8). This method requires aggregation of at least 100 peptides for precise 13C atom% estimation and allows estimation of aggregate 13C atom% in an organism's proteome. However, it cannot resolve individual proteins' atom% or pathway-specific differences.
Here, we report a proteomic SIP method that can determine 15N atom% of thousands of identified proteins from multiple strains and species in a model microbial community. Compared with the existing SIP methods, this new proteomic SIP method provides a deep coverage of strain-resolved data sets with variable extents of incorporation of 15N/13C. The approach provided new insights into the metabolic activity of established and regrowing multispecies biofilm communities.
MATERIALS AND METHODS
Cultivation of Standard Acid Mine Drainage (AMD) Cultures at Varying Known 15N atom%
Mixed species chemoautotrophic acid mine drainage biofilms were cultivated aerobically at ∼40 °C in laboratory bioreactors essentially as previously described (10), with the following modifications. The unlabeled standard culture was collected from a previously established biofilm grown in unlabeled medium. The ∼50% 15N-enriched standard culture was grown in a medium containing a mixture of 0.0677 g of >98 atom% (15NH4)2SO4 (Sigma-Aldrich) and 0.0638 g of unlabeled (NH4)2SO4 as the sole nitrogen source. The ∼98% 15N-enriched standard culture was grown in a medium containing >98 atom% (15NH4)2SO4 as the sole nitrogen source. Spent medium (50 ml) containing planktonic cells from previous, isotopically unlabeled bioreactors served as an inoculum. Biofilm developed in the bioreactors and iron(II) was depleted in the growth medium in 10 days. Then the medium supply to the bioreactors were changed to a single-pass configuration, where the medium continuously flowed through bioreactors in a single pass from the fresh-medium reservoir to the waste at a flow rate between 0.5 and 1 ml/min. Biofilms were collected following 10 further days of culture.
15N Stable Isotope Probing of the AMD Community's Development
An acid mine drainage (AMD) community culture was grown in a bioreactor for several months in unlabeled medium. A piece of the established but unlabeled biofilm was removed and the medium was switched to one containing ∼98% 15N (>98 atom% (15NH4)2SO4). One hundred five hours later, a piece of the original established biofilm (sample A1) was collected from a previously undisturbed area and a piece of the nascent regrowing biofilm (B1) was collected from the previously cleared area. Two hundred seventy four hours later, a second piece of the established biofilm (A2) and a second piece of the regrowing biofilm (B2) were sampled.
Proteome Sample Preparation
Whole-cell lysates were extracted from the biofilm samples as described previously (11). The proteins were denatured and reduced with 6 m guanidine and 10 mm dithiothreitol (Sigma Chemical Co.) at 60 °C for 1 h. The samples were then diluted sixfold with 50 mm Tris, 10 mm CaCl2 (pH 7.6), and sequencing grade trypsin was added at 1:100 (wt:wt). The first digestion was run overnight at 37 °C and following adding additional trypsin, the second digestion was run for 5 h at 37 °C. Finally, the samples were reduced with 20 mm dithiotreitol for 1 h at 60 °C and desalted using C18 solid-phase extraction (Sep-Pak Plus, Waters, Milford, MA).
Two-dimensional Liquid Chromatography (LC)-Tandem MS (MS/MS) Measurements
Samples were loaded offline onto a 5-cm-long 250-um-I.D. strong cation exchange back column (Luna, Phenomenex). The back column was connected to a 15-cm-long 100-um-I.D. C18 reverse-phase PicoFrit column (New Objective, Woburn, MA) and placed in-line with a U3000 quaternary HPLC (Dionex, San Francisco, CA). The two-dimensional LC separation was performed with 11 salt pulses. The first 10 salt pulses were followed by a 2-h reverse-phase elusion gradient from 0% solvent B to 50% and the last one by a 3-h gradient from 0% solvent B to 100%. The LC eluent was directly electrosprayed into the mass spectrometer with an ionization voltage of 4 kV. The AMD standard samples were analyzed using an LTQ-Orbitrap XL instrument in the following parameters: three data-dependent MS/MS scans following every full scan; MS/MS scans acquired in Orbitrap at resolution 7500 with two-microscan averaging; full scans acquired in Orbitrap at resolution 30,000 with two-microscan averaging; 35% normalized collision energy; ±2.5 Da isolation window; dynamic exclusion enabled with a ±3 Da exclusion window. The AMD standard samples were also analyzed using an LTQ-Orbitrap Velos instrument with identical configurations except for five data-dependent MS/MS scans following every full scan. The AMD regrowth SIP samples were analyzed using LTQ-Orbitrap Velos.
Peptide Identification and 15N atom% Estimation
All LC-MS/MS data sets were converted from the Xcalibur Raw file format to the FT2 flat file format (12) using the Raxport program (Freely available at http://code.google.com/p/raxport/). The Sipros algorithm v1.0 (Freely available at http://code.google.com/p/sipros) was used to identify peptide sequences and quantify their 15N atom%. The validation samples were searched against the core AMD database containing 15,983 protein sequences and their reverse sequences (11) (http://compbio.ornl.gov/biofilm_amd/). False discovery rates of peptide identification were calculated based on the hits to reverse sequences as described (13). The regrowth samples were searched against an updated and expanded AMD database containing 57,001 protein sequences that include actinobacterial, viral, and archaeal Richmond Mine acidophilic nanoorganisms (ARMAN)-derived proteins. The computation was performed on a 512-core Linux cluster (AMD Opteron processor, RAID protected NFS cluster storage and InfiniBand data network). Every LC-MS/MS data set was searched using 101 parallel threads spawned on a cluster. Each thread searched the database at a given 15N atom% ranging from 0% to 100% with a 1% interval. Peptides were predicted from protein sequences using the following trypsin cleavage rules: cleavage following residues K and R; up to two missed cleavage sites in a peptide; and specific tryptic cleavages at both termini. Candidate peptides for an MS/MS spectrum were found by using seven parent mass windows to filter predicted peptides based on their calculated most abundant masses. Let P be the parent mass of a spectrum and the seven parent mass windows of size ±0.04 Da were centered at P, P ± 1.0087 Da, P ± 2.0174 Da, and P ± 3.0261 Da to accommodate the so-called 1-Da ambiguity in correlating parent ion masses with calculated most abundant isotopic masses. A theoretical MS/MS spectrum was then reconstructed for every candidate peptide and matched to the experimental MS/MS spectrum. All residues in a peptide were assumed to have the same 15N atom% for calculating expected isotopic distributions of y and b ions. The observed y and b ions were scored by their mass accuracy and goodness of fit between their expected isotopic distributions and their observed ones (12) and the candidate peptide's score is the sum of its y and b ions' scores. The output from all 15N atom% searches was aggregated and peptide identifications were filtered using a score cutoff of 25.
Protein Identification and 15N Atom% Estimation
Identified peptides were assigned to proteins based on their amino acid sequences. Peptides belonging to a protein were then clustered by their 15N atom% into isotopologue groups using an agglomerative clustering algorithm. The clustering started by putting every peptide in a separate cluster and iterated between merging the two closest clusters into a new cluster and calculating new distances between every pair of clusters. The distance between two clusters was defined as the difference between the average peptide 15N atom% of the two clusters. The iteration continued until the distance between the closest clusters was above 20%. Clusters containing only one peptide were discarded as outliers because of the high false discovery rate for proteins identified based on a single peptide. The standard deviation of peptide 15N atom% in every cluster was calculated and clusters with a standard deviation greater than 10% were filtered out. Remaining clusters were considered to represent separate isotopologues of the protein at different protein 15N atom%. To identify redundant protein identifications, the peptide sets of every two proteins were compared. Protein isotopologues with identical sets of peptides were grouped together and proteins whose peptide sets are strict subsets of other proteins' peptide sets were removed. The resultant lists of proteins were referred to as nonredundant protein identifications.
Protein Quantification Using ProRata
For proteins identified with multiple 15N atom%, the abundance ratio between two isotopologues of a protein was estimated using the ProRata program that was originally developed for quantitative proteomics based on stable isotope labeling (14, 15). The ProRata program is freely available at http://code.google.com/p/prorata/. Although in quantitative proteomics samples proteins generally have two uniform 15N atom% (a natural 15N atom% and a known high 15N atom%), in SIP samples proteins may have a wide range of 15N atom%. As a result, the 15N atom% configuration of ProRata was customized for every two isotopologues of each protein. Selected ion chromatograms of identified peptides were extracted with the two 15N atom% of the two isotopologues under comparison. The selected ion chromatograms were used to estimate the peptides' abundance ratios with principal component analysis (15), which were used to estimate the abundance ratio and its confidence interval between the two isotopologues of a protein with maximum likelihood estimation (14).
Pathway-specific Analysis of Protein Isotopologue Abundance Patterns
The KEGG automated annotation server (http://www.genome.jp/tools/kaas/) (16) was used to place proteins in the AMD proteomics database into KEGG orthologies using the single-directional best-hit option. Abundance ratios of protein isotopologues with less than 15 atom% 15N label incorporation to isotopologues with greater than 85 atom% 15N incorporation were used to color the KEGG Pathway maps using the KEGG API and custom scripts with green representing proteins whose light isotopologue was more abundant than the heavy isotopologue, and red for the opposite case. Proteins for which only one isotopologue was detected were assumed to have log2 isotopologue abundance ratios of ± 10.
RESULTS
Validation of the Proteomic SIP Method Using Proteome Samples of Known 15N Atom%
The proteomic SIP method was validated using laboratory grown microbial communities derived from an acid mine drainage (AMD) system previously extensively studied by proteomics (10, 11, 17, 18). In the natural system, these extremophilic communities grow on the surface of highly acidic and metal-rich solutions (pH ∼0.8 and near-molar [Fe2+]) and harvest energy from pyrite oxidization. Despite the harsh conditions, the community has a primary productivity of ∼0.5 g C m2/day, comparable to many terrestrial and aquatic ecosystems (10). The AMD community has been established as a model microbial community for metagenomic (19), community proteomic, and ecological studies (18).
In the current study, three AMD biofilms were grown in laboratory bioreactors in which nitrogen was solely supplied as ammonium with either 0.4 atom% 15N (natural abundance), ∼50 atom% 15N, or ∼98 atom% 15N. For the latter two conditions, uncertainty in the 15N atoms% of ammonium supplied in the medium stems mostly from uncertainty in the isotopic purity of enriched (15NH4)2SO4) purchased from our supplier, which is rated as “>98” atom% 15N. (Medium with ∼50 atom% 15N was prepared by weighing labeled and unlabeled ammonium sulfate on an analytical balance and is precise to three decimal places.) Biofilms were grown over a 3-week period from an inoculum of low concentrations of planktonic cells with constant medium composition. All proteins in each biofilm should have approximately the same 15N atom% as the 15N atom% of the ammonium used in the growth medium as the nitrogen source.
Proteomes were digested by trypsin and analyzed using 24-hour two-dimensional liquid chromatography tandem mass spectrometry (two-dimensional-LC MS/MS) (20). In these validation experiments, we used both an LTQ Orbitrap XL instrument (21) and an LTQ Orbitrap Velos instrument (22) (Thermo Fisher Scientific) to investigate the effects of instrument types on the number and false discovery rate of protein identifications. High-resolution MS/MS scans were obtained from both instruments (Fig. 1A). The isolation window was set to be ±2.5 Da wide to include most of the high-intensity isotopic peaks of peptides at varying 15N atom%. A sample set of acquired MS/MS spectra are provided in Supplemental Fig. S1. A free open-source algorithm, Sipros, was developed to search the MS/MS data against a protein sequence database at a range of possible isotopic enrichment percentages. The algorithm was released at http://code.google.com/p/sipros/. Sipros built a theoretical spectrum for every tryptic peptide predicted from protein sequences at every 15N atom% from 0% to 100% at 1% intervals (Fig. 1B). Experimental spectra were searched against all these theoretical spectra to identify both peptides' sequences and their 15N atom%. On average it consumed ∼2000 processor hours (i.e. ∼20 h wall-clock time using 101 AMD Opteron processors) to process a 24-hour two-dimensional-LC MS/MS data set.
Fig. 1.
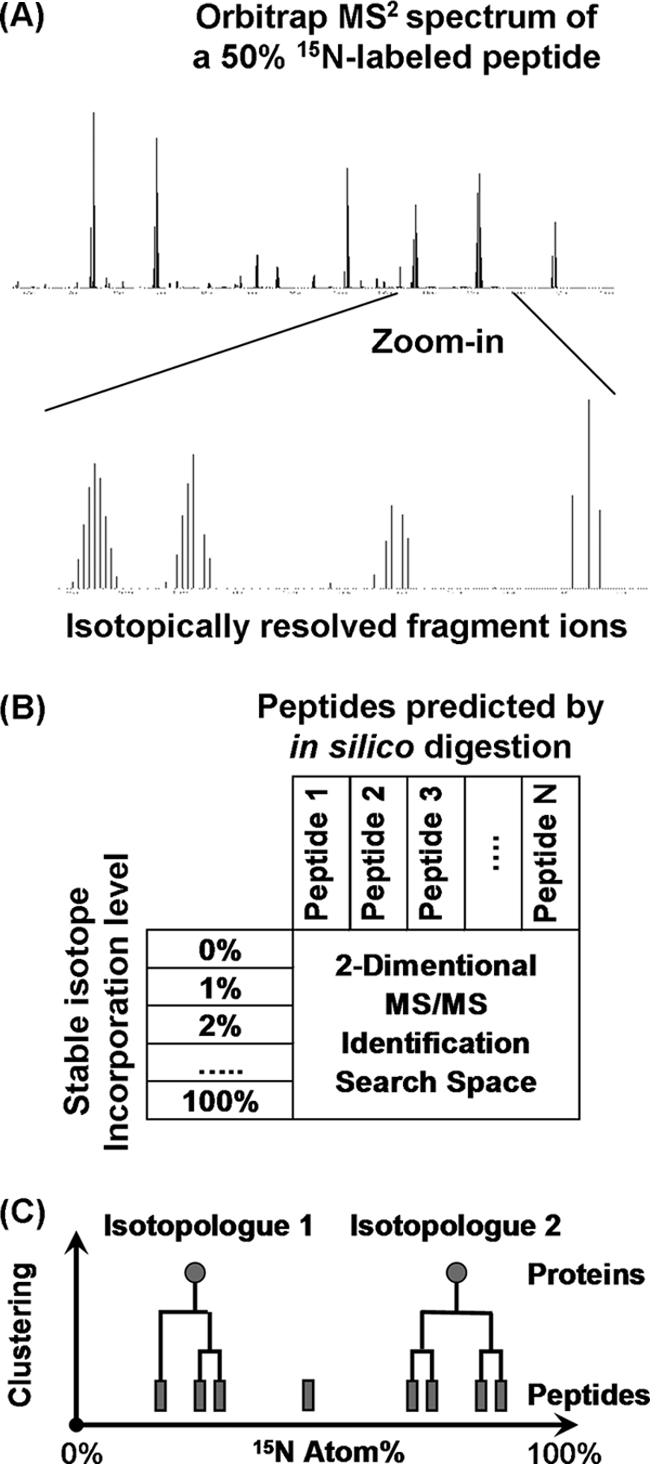
Overview of the proteomic SIP method. A, High-resolution MS2 spectrum from a shotgun proteomics measurement. The fragment ions have fully resolved isotopic distributions. B,The MS2 spectrum was matched to theoretical spectra reconstructed using predicted peptide sequences and varying 15N atom%. The optimum match to this spectrum was peptide MEGSNMTMTLAPATTQAK at 49% 15N atom%. C, 15N atom% of peptides belonging to a protein was clustered into two separate isotopologues of the protein. The abundance ratio between the two isotopologues was estimated from full-scan data using the ProRata program.
The 15N atom% values of proteins were estimated from the 15N atom% of their constituent peptides. In a SIP experiment, a protein may have multiple isotopologues at distinct 15N atom%. Peptides with similar 15N atom% were grouped together using a hierarchical clustering algorithm (Fig. 1C). A cluster containing more than two peptides of similar 15N atom% was considered representing an isotopologue of the protein. The unsupervised clustering method allowed automated identification of an unknown number of distinct 15N isotopologues of a protein in a proteome. To remove redundant protein identifications that share nonunique peptides, protein identifications with identical sets of peptides were grouped together and proteins whose peptide sets are strict subsets of another protein's peptide set were removed. The remaining identifications were called nonredundant protein identifications. Finally, if a protein had two distinct 15N isotopologues, the abundance ratios for isotopologue pairs were estimated from selected ion chromatograms of their constituent peptides using the ProRata program (14, 15).
Overall, many nonredundant proteins were identified at low false discovery rates (< 2%) from six members of the AMD community in all three validation samples (Fig. 2 and supplemental Table 1). Estimated 15N atom% of proteins agreed well with the experimentally imposed 15N abundances (Figs. 2A and 2B). Because the LTQ Orbitrap Velos scanned almost twice as fast as LTQ Orbitrap XL, many more proteins were identified with this instrument, and it was used exclusively for subsequent experiments. However, the data in supplemental Table 1 shows that the Sipros technique is still effective on an LTQ Orbitrap XL. Among the three validation samples, the 50% labeled sample had the lowest numbers of identified proteins, highest false discovery rates, and lowest 15N atom% precision (Fig. 2C). This was expected because peptides of 50% 15N atom% have more complex isotopic packets than packets for peptides at other 15N atom%. In summary, this analysis showed that the new method can confidently identify thousands of proteins of varying 15N atom% and accurately estimate their 15N atom%.
Fig. 2.

Validation of the proteomic SIP method. Three AMD validation samples of known 15N atom% were measured using two instruments: LTQ Orbitrap Velos and LTQ Orbitrap XL. A, Histograms of protein 15N atom% from LTQ Orbitrap Velos analysis. B, Histograms of protein 15N atom% from LTQ Orbitrap XL analysis. C, Summary of validation results. False discovery rate is defined as twice of the percentage of reverse identifications out of all protein identifications. 15N atom% estimation precision is defined as the percentage of proteins within ±5% of the median 15N% of a standard sample.
Proteomic SIP During Recolonization and Regrowth of Laboratory AMD Communities
Labeling Patterns Reveal Cell Migration
AMD biofilms grow on the surface of streams and pools and are periodically removed by floods or other natural events. The community then recolonizes the cleared space and develops into thick mature biofilms (11, 23). The proteomic SIP method was used to study the development of the AMD community to provide biological insight into the colonization process. This analysis used multispecies biofilms grown in laboratory bioreactors. Similar communities were shown previously to closely replicate natural communities, both in terms of membership and activity (10).
In the experiment, we grew the community in laboratory bioreactors supplied with natural abundance 15N, then removed a piece of unlabeled biofilm and simultaneously switched to a medium containing ∼98% 15N (Supplemental Fig. S2). One hundred five hours later we sampled both the original established (sample A1) and nascent regrowing (B1) biofilms. This procedure was repeated 274 h later (yielding sample A2 from the original biofilm, and sample B2 from the second regrowth of the biofilm). From 1814 to 2407 nonredundant proteins were identified from each of these samples using LTQ Orbitrap Velos (supplemental Table 2). The most highly represented organism in all samples was Leptospirillum group III, for which 1200 proteins were detected in one or more of the four samples (∼45% of the predicted proteins) (24). Fig. 3B shows the microorganism-resolved distributions of the unlabeled (<5% 15N atom %) and labeled proteins (>80% 15N atom %) in the four samples. Proteins uniquely assignable to 10 different Bacteria and Archaea and two virus populations were identified.
Fig. 3.

Proteomic SIP of the AMD community regrowth. A, Histograms of protein 15N atom%. B, Microorganism distributions of unlabeled and labeled proteins. Each sample is represented by two bars marked by “U” or “L” for unlabeled proteins (<5% 15N atom%) and labeled proteins (>80% 15N atom%), respectively. C, Box plots of microorganism-specific protein abundance ratio distributions. The whiskers extend to the lowest and highest values, to a maximum distance of 1.5 times the interquartile range. Box plots were shown only for microorganisms with more than five quantified proteins. Microorganisms are color-coded in Parts B and C.
Fig. 3A shows the extent of 15N atom% labeling in proteins across the proteomes. Most proteins in all four samples were either unlabeled (<5% 15N atom %) or highly labeled (>80% 15N atom %). Most proteins in the established biofilm samples remained unlabeled following the medium switch. In the regrowing biofilm samples, there were both labeled and unlabeled proteins.
It was intriguing that biofilm regrowing in a ∼98% 15N medium contained significant numbers and amounts of unlabeled proteins (Fig. 3). Three distinct scenarios could explain the presence of unlabeled proteins in the regrowing biofilm. First, the unlabeled proteins could have originated by carryover contamination, i.e. inadvertent inclusion of some established biofilm in the samples of regrowing biofilm. The data in Fig. 3B discount this scenario, as unlabeled proteins in regrowing biofilm (sample B1) had organismal distributions distinct from unlabeled proteins in established biofilm (sample A1). An alternate scenario is that small-molecule sources of organic nitrogen were trafficked between the established and regrowing biofilms, i.e. spatially separated isotopic recycling. The 14N would mix with 15N from the medium at the level of de novo amino acid biosynthesis, and the mixed nitrogen pool would result in the biosynthesis of proteins with intermediate labeling percentages. The data in Fig. 3A discounts this scenario; only highly unlabeled or highly labeled proteins were detected. The final scenario, consistent with Fig. 3, is that whole cells (and their unlabeled proteomes) migrated into the regrowing biofilm. The distinct organismal distributions of unlabeled proteins in regrowing versus established biofilms is indicative of selective migration of certain species into the regrowing biofilm. We cannot exclude the possibility subsequently to or in tandem with cell migration, isotope recycling processes such as protein turnover also contribute to the observed data, but as shown in Supplemental Fig. S2, near the time of 15N addition to the bioreactor, biofilm was completely excised from the region in which regrowing biofilm subsequently appeared.
Many proteins were identified as two distinct 15N isotopologues. The abundance ratios of the unlabeled and labeled isotopologues were estimated (supplemental Table 3). Fig. 3C shows the distributions of protein abundance ratios by microorganisms. Unlabeled isotopologues dominated in the established biofilm samples (Figs. 3A and 3C), demonstrating very slow rates of 15NH4+ incorporation into proteins. This finding demonstrates, for the first time, low de novo protein synthesis from NH4+ in these mature communities. In the regrowing biofilm samples, the labeled isotopologues of proteins were more abundant than the unlabeled isotopologues. The detection of labeled proteins indicated significant uptake of 15NH4+ for new protein biosynthesis.
Labeling Patterns of Dominant Community Members
As shown in Fig. 4, the majority of labeled proteins in the regrowing biofilm derive from Leptospirillum Group III, especially in Sample B1. 234 Leptospirillum Group III proteins were identified only in the early regrowth sample (B1), and all of these were completely 15N labeled (see proteins highlighted by a red bar in the first panel of Fig. 4). We attribute the identification of these proteins to a combination of the high abundance of this organism, which enabled deep proteome sampling, and broad metabolic activity associated with extensive cell division and growth. Of these 234 proteins, 28% (66 proteins) had no annotated function, but proteins with no annotated function comprised just 12% of Leptospirillum group III proteins identified across all samples. This difference is statistically significant (Fisher's two-tailed exact test, p = 2.6 × 10⁻⁸), and may indicate that biological processes required for early biofilm colonization are largely uncharacterized.
Fig. 4.

Heat maps of isotopologue abundance for the protein regrowth experiment for the four most dominant community members: three subtypes of Leptospirillum Bacteria (Group III, Group II UBA type, and Group II 5wayCG type), and one archaeon (G plasma of the Thermoplasmatales). The four panels report protein identification and labeling patterns for the each of the dominant organisms, although significant numbers of proteins from lower-abundance community members were detected (see text). Pale gray indicates proteins that were not identified in a specific sample. Within each panel, proteins are sorted such that those found in all samples appear at the top and those appearing in only one of the four samples appear at the bottom. The length of each panel is proportional to proteins identified. The red bar highlights a large group (234) of highly labeled proteins found only in the early regrowth sample that is enriched in proteins of no known function.
We mapped protein isotope composition information onto biochemical pathways to seek evidence for either rapid turnover of specific proteins or up-regulation of entire pathways. The analysis results are shown in Supplemental Appendix 1. In some pathways, such as the reductive TCA cycle (Fig. 5A), isotopologue abundance varied widely among member proteins, indicating 15N incorporation levels were determined primarily by protein-specific turnover rates. However, for other pathways, labeling patterns were broadly consistent among member proteins. Examples include large ribosomal subunit proteins (Fig. 5B), the pyruvate metabolic pathway and chemotaxis and heme and cobalamin biosynthesis during early regrowth (Sample B1, as shown in Supplemental Appendix 1). This suggests that these specific functionalities were up-regulated in the early regrowth biofilm (sample B1).
Fig. 5.

Examples of pathway-by-pathway analysis of isotopic labeling patterns as determined by proteomics analysis of dynamically 15N-labeled mixed-community biofilms. Each panel depicts protein isotopologue abundance in four different samples for proteins from a particular organism that belong to the shown pathway. The four most abundant community organisms are shown. Reductive tricarboxylic acid cycle proteins (a) show, in general, pronounced differences in labeling patterns even within the same organism; however, in contrast, large subunit ribosomal proteins (b) show more unified response within particular organisms.
Surprisingly, the later regrowth biofilm sample (B2) contained many unlabeled Leptospirillum Group III proteins. As noted above, this finding is attributed to immigration from the pre-existing biofilm. Proteins in sample B2 that are predominantly unlabeled must be expressed in migrating cells and must also not be highly expressed in cells involved in de novo biosynthesis and growth in the re-growing biofilm. For example, in Leptospirillum group III, aminoacyl tRNA synthetases were significantly overrepresented in unlabeled proteins in B2 as compared with labeled proteins in B2 (Fisher two-sided exact test, p = 2.8 × 10⁻⁶), indicating that large amounts of these proteins were carried into the sample by Leptospirillum Group III cells migrating from already-established, 14N-rich regions of the biofilm. A large role for late immigration could not have been predicted without dynamic labeling experiments, which are rarely conducted in studies of complex, multispecies microbial communities. Notably, despite evidence for migration, we do not identify both isotopologues for many abundant proteins. There are Leptospirillum Group III proteins in the late regrowth (B2) biofilm that are predominantly unlabeled for which strongly labeled versions were identified in the early regrowth stage. We suggest that these may be slow turnover proteins that are much more important to Leptospirillum living in mature biofilms and the high abundance of unlabeled isotopologues masks the signal from newly biosynthesized ones.
In contrast to Samples B1 and B2 of the regrowing biofilm, samples A1 and A2 from established biofilm had low numbers of 15N-enriched isotopologues and low abundance ratios of 15N isotopologues to natural isotopologues. These observations indicate that most proteins had not turned over on the time scale of the experiment, more than 300 h. However, a small subset of labeled proteins were detected in established biofilms, which (i) demonstrates that de novo amino acid biosynthesis was occurring in established biofilms, and (ii) suggests that these labeled proteins have unusually short half-lives. In the UBA and 5wayCG Leptospirillum Group II proteomes, a predicted cytochrome (UBA_LeptoII_Scaffold_8062_GENE_147 # Locus_tag: UBAL2_80620147 # Function: Probable cytochrome c, class I) was the sole protein for which the 15N-rich isotopologue was more abundant than its 14N-labeled counterpart in both A1 and A2. In Leptospirillum Group III, seven proteins of various functions and activities met this criterion. These proteins share no common function. We infer that their high level of labeling indicates rapid turnover because of exposure to the extracellular environment.
Notably, the Archaeal G-, A-, and E-plasma, Ferroplasma I and Ferroplasma II proteins were mostly unlabeled in samples A1, A2, and B2, and very few Archaeal proteins were identified in sample B1. The dearth of unlabeled Archaeal proteins in sample B1 and their presence in sample B2 (Fig. 3B) suggests that Archaea migrate into developmentally mature biofilms. Previous studies found a higher Archaeal species abundance in more mature compared with newly formed biofilms (18, 23, 25). The protein SIP results indicate this may be primarily because of immigration rather than in situ cell division following migration of a few colonists. Given results documenting both early and late Bacterial migration, the results also demonstrate that migration preferences of species changes as biofilms developed.
Labeling Patterns of Rare Community Members
Proteins encoded by viruses and unclassified genome fragments and other nonunique proteins were categorized as “Others” in Fig. 3B. It is interesting that this group includes 12 proteins from the bacteriophage AMDV1. This phage is known to replicate in Leptospirillum but has not been detected as a prophage. In both established biofilms samples all phage proteins were unlabeled whereas in sample B1 the viral proteins were either almost completely labeled or occurred exclusively as the labeled isotopologue. In sample B2, we detected a mixture of unlabeled and essentially completely labeled AMDV1 proteins. In contrast, the single protein from an Archaeal virus that was detected in A2 and B2 occurred exclusively in the unlabeled form. The observed labeling patterns are consistent with the labeling patterns of the hosts in which the viruses replicate (Fig. 3B). Thus, the labeling results indicate that detected viral proteins were synthesized in Bacterial and Archaeal host cells close to the time of sampling.
Actinobacteria are low-abundance members of acid mine drainage consortia from the Richmond Mine. We detected between 4 and 12 actinobacterial proteins in the four samples A1, A2, B1, and B2. In B2, both highly labeled and unlabeled isotopologues of an actinobacterial GroEL protein (UNLA1_11998005 # Function: COG0459 Chaperonin GroEL) were detected. Quantification by ProRata revealed that the 15N-labeled isotopologue was nine times more abundant than the unlabeled isotopologue, showing that actinobacteria were actively metabolizing nitrogen and/or synthesizing protein during our experiment. Several other 15N-labeled isotopologues of Actinobacterial proteins were also detected in samples B1 and B2, supporting this finding.
Nanoarchaea of the ARMAN lineage are recently discovered, low-abundance members of the AMD community (26). Detected ARMAN proteins were exclusively in the unlabeled state. Only 7 of the 33 proteins identified had no assigned function and those with functional annotations were largely associated with metabolism, growth, or defense mechanisms. ARMAN lineages are highly divergent relative to other Archaea and little is known about their physiology, despite the availability of three near-complete genome sequences (27). Some genome features suggest that they are heterotrophs. Three-dimensional cryogenic electron tomographic imaging has documented intimate cytoplasmic connections between the cells and coexisting Thermoplasmatales lineage Archaea (27), although the nature of the association is unknown. The finding that ARMAN nanoarchaea did not take up ammonium during the experiment indicates that either the cells are inactive at the time scales of our experiment or that they derive their nitrogen from unlabeled sources, probably coexisting Archaea. Importantly, however, ARMAN proteins detected in the 15N-enriched validation samples (Fig. 2) were labeled at enrichment ratios of 95.5 atom% (ARMAN proteins in the >98% 15N validation sample) and between 10 and 49 atom% (50 atom% 15N validation sample), showing that ARMAN can be metabolically active in laboratory-grown whole-community biofilms.
DISCUSSION
Comparison of Proteomic SIP to the Existing SIP Methods
The proteomic SIP method is enabled by a novel approach for peptide identification and 15N atom% estimation from high-resolution MS/MS spectra using the Sipros algorithm. Conventionally, the extent of stable isotope incorporation in a known peptide can be estimated by comparing its measured isotopic distribution to a series of expected isotopic distributions calculated at different atom% of a stable isotope (28). This has been used for protein turnover ratio analysis (29), protein assay prior to NMR analysis (30), and protein-based SIP (4). More recently, a new method based on decimal place slope was developed for 13C atom% estimation (7). Because the difference between 12C and 13C is 1.003355 Da, a peptide with higher 13C atom% has a higher slope for the digits in the third and fourth place following the decimal point. Because it is challenging to achieve such an accurate mass measurement on every peptide, at least 100 peptides were required for accurate 13C atom% estimation. Therefore, unlike the conventional method or our new method, the decimal place slope method cannot provide accurate 13C atom% estimation for individual proteins.
Our method based on the Sipros algorithm offers two advantages over the existing methods. First, existing methods require an offline procedure to identify the sequence of peptides with variable label incorporation. For example, the original protein-SIP method requires a parallel two-dimensional gel electrophoresis of an unlabeled proteome with the SIP proteome sample for protein identification. This limits the throughput of the analysis. Our method performs peptide identification and 13C/15N atom% estimation in a single measurement in a fully automated manner. Second, to estimate 13C/15N atom%, the existing methods use isotopic distributions of intact peptides in MS1 scans, whereas Sipros uses isotopic distribution of peptide fragments in MS2 scans. Because many peptides that are barely detectable in MS1 scans can yield high-quality MS2 scans, Sipros should be able to provide accurate estimations of 15N atom% for many low-abundance peptides. Because the 13C/15N atom% of a peptide is estimated based on isotopic distributions of multiple fragment ions rather than a single isotopic distribution of the parent ion, the estimation should be more robust to random noise interference. The two advantages of our method allowed identification of thousands of partially labeled proteins and quantification of their 15N atom% and relative abundances in a natural microbial community. This represents a significant methodology improvement from previous studies in which the 13C atom% of up to only 38 proteins were determined from a single organism in a pure culture or an enrichment culture (4–6, 9).
Although the existing SIP methods focus on tracking isotope flows between microorganisms based on the analysis of a small set of DNAs, RNAs, proteins, or lipids, the proteomic SIP method allows system-level functional analysis of microorganisms involved in the isotope transfer using a large number of identified proteins. In a perspective article on SIP (1), Dumont and Murrell envisioned the emergence of genomic SIP and transcriptomic SIP in which 13C enriched DNAs and RNAs are isolated and sequenced and the biological insights that these potential methods can provide. We believe proteomic SIP is the first method that demonstrated the potential of combining the high-throughput proteomics technology with the SIP technique.
Application of Proteomic SIP to Complex Communities
The study demonstrates that the proteomic SIP method is able to identify proteins from Bacteria, Archaea, and viruses in natural communities at the strain level and to characterize subpopulations that differ in the extent of their isotopic labeling. We unexpectedly observed labeling patterns indicative of cell migration into regrowing regions of biofilm, illustrating that our method is useful for the study of complex biological phenomena. In established biofilms, most proteins had very little 15N incorporation over the time scale of the experiment. We suspect this indicates very low protein turnover rates in the mature biofilms, but cannot exclude the possibility that proteins are recycled to their constitutent amino acids rapidly but de novo rates of amino acid biosynthesis from NH4+ are near-zero. Future studies over longer time periods and using additional isotopes, could lead to better assessment of protein turnover rates and further deconvolution of the mixed effects of protein turnover and cell migration that we observe here.
Using our SIP proteomic methods, it is possible to identify and assess the extent of labeling of proteins from rare members of microbial consortia, as was demonstrated for actinobacterial, ARMAN-derived, and viral proteins. Quantitative labeling information can be extracted even though proteomes are shallowly sampled and peptide coverage of individual proteins is very poor. Thus, the approach can be used to demonstrate activity of rare members and to quantify flows of nitrogen and, by extension, carbon in more complex communities.
The AMD community was studied here as a model system for proof of principle of the high-throughput proteomic SIP method. Several prerequisites are required before applying proteomic SIP to other systems. First, whole-community cultivation must be available so that significant levels of heavy isotope incorporation can be achieved in coexisting organisms under biologically relevant conditions. Second, high quality metagenomic databases should be available for the community of interest so that protein sequence databases can be constructed. Although protein identification can be achieved using isolate genome sequences, missing strain-specific candidate peptide sequences will lower protein identification rates and potentially introduce biases. With recent technology advances, more and more communities are now amenable to comprehensive proteogenomics analysis (31). Provided these challenges can be addressed, the proteomic SIP method will be broadly applicable to communities that comprise more member species than found in the AMD community.
A particular strength of the two-dimensional-LC MS/MS-based SIP method is that many proteins from closely related strains and species can be differentiated, so long as single-nucleotide polymorphisms (SNPs) that differentiate the proteins result in mass shifts in identified tryptic peptides. This is in contrast to approaches that rely on differences in gel migration rates that are unlikely to be sensitive to SNPs and strain-level variation. In the AMD community, approximately half of the protein identifications from the Leptospirillum Group II species can be uniquely attributed to one of the species' two substrains (0.3% difference in 16S rRNA gene sequences). Therefore, we expect that many identified proteins from a complex community could be uniquely assigned at the species or strain level. As community complexity increases, fewer pathways will be sampled sufficiently for detailed analysis at the strain level and most organisms may only be amenable to species-level analysis of overall activity levels.
Proteomic SIP is enabled by high-performance computing. More complex communities will require more computing time for Sipros data analysis. The computing time increases linearly with the number of MS/MS spectra and the number of proteins in the metagenomic database. In this study, it took ∼20 h using 101 processors in a cluster to search ∼105 MS/MS spectra in a validation data set against a protein database comprising 31,966 sequences. The data can also be processed using 101 virtual machines instantiated in a commercial cloud, which would cost approximately $340 using the Amazon Elastic Compute Cloud at the present unit price of $0.17 per hour for high-CPU on-demand instances. The computing time and cost for processing data from a complex community would increase in proportion to the size of the community metagenomic data set. However, the computing cost may still be a fraction of the experimental cost of a proteomic SIP study.
Acknowledgments
We thank S. Spaulding for technical assistance with cultivating AMD biofilms in laboratory bioreactors, M. Galloway for system administration of computer clusters, and N. Verberkmoes for helpful discussions. C. P., J. F. B, C. R. F., and R. L. H. designed the research plan. D. H. and C. P. developed the data analysis algorithms and processed the data on computer clusters. C. R. F. cultivated and sampled isotopically labeled AMD biofilms. C. P. and R. L. H. designed and performed the proteomics measurements. C. P., C. R. F., and J. F. B. interpreted the results. C. P., C. R. F., and J. F. B. drafted the paper. C. P. and C. R. F. contributed equally to this work.
Footnotes
* This work was funded by the US Department of Energy, Office of Biological and Environmental Research Carbon-Cycling Program (DE-SC0004665), Systems Biology Knowledgebase (DE-SC0004918) and Office of Advanced Scientific Computing Research SciDAC program. Oak Ridge National Laboratory is managed by University of Tennessee-Battelle LLC for the Department of Energy under contract DOE-AC05-00OR22725.
 This article contains supplemental Figs. S1 and S2, supplemental Appendix, and supplemental Tables S1, S2, S3.
1 The abbreviations used are:
- SIP
- stable isotope probing
- AMD
- acid mine drainage.
REFERENCES
- 1. Dumont M. G., Murrell J. C. (2005) Stable isotope probing - linking microbial identity to function. Nat. Rev. Microbiol. 3, 499–504 [DOI] [PubMed] [Google Scholar]
- 2. Boschker H. T. S., Nold S. C., Wellsbury P., Bos D., de Graaf W., Pel R., Parkes R. J., Cappenberg T. E. (1998) Direct linking of microbial populations to specific biogeochemical processes by 13C-labelling of biomarkers. Nature 392, 801–805 [Google Scholar]
- 3. Radajewski S., Ineson P., Parekh N. R., Murrell J. C. (2000) Stable-isotope probing as a tool in microbial ecology. Nature, 403, 646–649 [DOI] [PubMed] [Google Scholar]
- 4. Jehmlich N., Schmidt F., von Bergen M., Richnow H. H., Vogt C. (2008) Protein-based stable isotope probing (Protein-SIP) reveals active species within anoxic mixed cultures. Isme J. 2, 1122–1133 [DOI] [PubMed] [Google Scholar]
- 5. Jehmlich N., Schmidt F., Hartwich M., von Bergen M., Richnow H. H., Vogt C. (2008) Incorporation of carbon and nitrogen atoms into proteins measured by protein-based stable isotope probing (Protein-SIP). Rapid Commun. Mass Spectrom. 22, 2889–2897 [DOI] [PubMed] [Google Scholar]
- 6. Jehmlich N., Schmidt F., Taubert M., Seifert J., von Bergen M., Richnow H. H., Vogt C. (2009) Comparison of methods for simultaneous identification of bacterial species and determination of metabolic activity by protein-based stable isotope probing (Protein-SIP) experiments. Rapid Commun. Mass Spectrom. 23, 1871–1878 [DOI] [PubMed] [Google Scholar]
- 7. Jehmlich N., Fetzer I., Seifert J., Mattow J., Vogt C., Harms H., Thiede B., Richnow H. H., von Bergen M., Schmidt F. (2010) Decimal place slope, a fast and precise method for quantifying 13C incorporation levels for detecting the metabolic activity of microbial species. Mol. Cell Proteomics 9, 1221–1227 [DOI] [PMC free article] [PubMed] [Google Scholar]
- 8. Fetzer I., Jehmlich N., Vogt C., Richnow H. H., Seifert J., Harms H., von Bergen M., Schmidt F. (2010) Calculation of partial isotope incorporation into peptides measured by mass spectrometry. BMC Res Notes 3, 178. [DOI] [PMC free article] [PubMed] [Google Scholar]
- 9. Bastida F., Rosell M., Franchini A. G., Seifert J., Finsterbusch S., Jehmlich N., Jechalke S., von Bergen M., Richnow H. H. (2010) Elucidating MTBE degradation in a mixed consortium using a multidisciplinary approach. FEMS Microbiol. Ecol. 73, 370–384 [DOI] [PubMed] [Google Scholar]
- 10. Belnap C. P., Pan C., Verberkmoes N. C., Power M. E., Samatova N. F., Carver R. L., Hettich R. L., Banfield J. F. (2010) Cultivation and quantitative proteomic analyses of acidophilic microbial communities. Isme J. 4, 520–530 [DOI] [PubMed] [Google Scholar]
- 11. Ram R. J., Verberkmoes N. C., Thelen M. P., Tyson G. W., Baker B. J., Blake R. C., 2nd, Shah M., Hettich R. L., Banfield J. F. (2005) Community proteomics of a natural microbial biofilm. Science, 308, 1915–1920 [PubMed] [Google Scholar]
- 12. Pan C., Park B. H., McDonald W. H., Carey P. A., Banfield J. F., Verberkmoes N. C., Hettich R. L., Samatova N. F. A high-throughput de novo sequencing approach for shotgun proteomics using high-resolution tandem mass spectrometry. BMC Bioinformatics 11(1), 118. [DOI] [PMC free article] [PubMed] [Google Scholar]
- 13. Peng J., Elias J. E., Thoreen C. C., Licklider L. J., Gygi S. P. (2003) Evaluation of multidimensional chromatography coupled with tandem mass spectrometry (LC/LC-MS/MS) for large-scale protein analysis: the yeast proteome. J. Proteome Res. 2, 43–50 [DOI] [PubMed] [Google Scholar]
- 14. Pan C., Kora G., McDonald W. H., Tabb D. L., VerBerkmoes N. C., Hurst G. B., Pelletier D. A., Samatova N. F., Hettich R. L. (2006) ProRata: A quantitative proteomics program for accurate protein abundance ratio estimation with confidence interval evaluation. Anal. Chem. 78, 7121–7131 [DOI] [PubMed] [Google Scholar]
- 15. Pan C., Kora G., Tabb D. L., Pelletier D. A., McDonald W. H., Hurst G. B., Hettich R. L., Samatova N. F. (2006) Robust estimation of peptide abundance ratios and rigorous scoring of their variability and bias in quantitative shotgun proteomics. Anal. Chem. 78, 7110–7120 [DOI] [PubMed] [Google Scholar]
- 16. Moriya Y., Itoh M., Okuda S., Yoshizawa A. C., Kanehisa M. (2007) KAAS: an automatic genome annotation and pathway reconstruction server. Nucleic Acids Res. 35(Web Server issue), W182–185 [DOI] [PMC free article] [PubMed] [Google Scholar]
- 17. Lo I., Denef V. J., Verberkmoes N. C., Shah M. B., Goltsman D., DiBartolo G., Tyson G. W., Allen E. E., Ram R. J., Detter J. C., Richardson P., Thelen M. P., Hettich R. L., Banfield J. F. (2007) Strain-resolved community proteomics reveals recombining genomes of acidophilic bacteria. Nature 446, 537–541 [DOI] [PubMed] [Google Scholar]
- 18. Denef V. J., Mueller R. S., Banfield J. F. (2010) AMD biofilms: using model communities to study microbial evolution and ecological complexity in nature. Isme J. 4, 599–610 [DOI] [PubMed] [Google Scholar]
- 19. Tyson G. W., Chapman J., Hugenholtz P., Allen E. E., Ram R. J., Richardson P. M., Solovyev V. V., Rubin E. M., Rokhsar D. S., Banfield J. F. (2004) Community structure and metabolism through reconstruction of microbial genomes from the environment. Nature, 428, 37–43 [DOI] [PubMed] [Google Scholar]
- 20. Washburn M. P., Wolters D., Yates J. R., 3rd (2001) Large-scale analysis of the yeast proteome by multidimensional protein identification technology. Nat. Biotechnol. 19(3), 242–7 [DOI] [PubMed] [Google Scholar]
- 21. Makarov A., Denisov E., Kholomeev A., Balschun W., Lange O., Strupat K., Horning S. (2006) Performance evaluation of a hybrid linear ion trap/orbitrap mass spectrometer. Anal. Chem. 78, 2113–2120 [DOI] [PubMed] [Google Scholar]
- 22. Olsen J. V., Schwartz J. C., Griep-Raming J., Nielsen M. L., Damoc E., Denisov E., Lange O., Remes P., Taylor D., Splendore M., Wouters E. R., Senko M., Makarov A., Mann M., Horning S. (2009) A dual pressure linear ion trap Orbitrap instrument with very high sequencing speed. Mol. Cell Proteomics 8, 2759–2769 [DOI] [PMC free article] [PubMed] [Google Scholar]
- 23. Wilmes P., Remis J. P., Hwang M., Auer M., Thelen M. P., Banfield J. F. (2009) Natural acidophilic biofilm communities reflect distinct organismal and functional organization. Isme J. 3, 266–270 [DOI] [PubMed] [Google Scholar]
- 24. Goltsman D. S., Denef V. J., Singer S. W., VerBerkmoes N. C., Lefsrud M., Mueller R. S., Dick G. J., Sun C. L., Wheeler K. E., Zemla A., Baker B. J., Hauser L,., Land M., Shah M. B., Thelen M. P., Hettich R. L., Banfield J. F. (2009) Community genomic and proteomic analyses of chemoautotrophic iron-oxidizing “Leptospirillum rubarum” (Group II) and “Leptospirillum ferrodiazotrophum” (Group III) bacteria in acid mine drainage biofilms. Appl. Environ. Microbiol. 75, 4599–4615 [DOI] [PMC free article] [PubMed] [Google Scholar]
- 25. Edwards K. J., Bond P. L., Gihring T. M., Banfield J. F. (2000) An archaeal iron-oxidizing extreme acidophile important in acid mine drainage. Science 287, 1796–1799 [DOI] [PubMed] [Google Scholar]
- 26. Baker B. J., Tyson G. W., Webb R. I., Flanagan J., Hugenholtz P., Allen E. E., Banfield J. F. (2006) Lineages of acidophilic archaea revealed by community genomic analysis. Science 314, 1933–1935 [DOI] [PubMed] [Google Scholar]
- 27. Baker B. J., Comolli L. R., Dick G. J., Hauser L. J., Hyatt D., Dill B. D., Land M. L., Verberkmoes N. C., Hettich R. L., Banfield J. F. (2010) Enigmatic, ultrasmall, uncultivated Archaea. Proc. Natl. Acad. Sci. U.S.A. 107, 8806–8811 [DOI] [PMC free article] [PubMed] [Google Scholar]
- 28. Yergey J. A. A General-Approach to Calculating Isotopic Distributions for Mass-Spectrometry. International Journal of Mass Spectrometry and Ion Processes, 1983. 52 (2–3): p. 337–349 [DOI] [PubMed] [Google Scholar]
- 29. Cargile B. J., Bundy J. L., Grunden A. M., Stephenson J. L., Jr. Synthesis/degradation ratio mass spectrometry for measuring relative dynamic protein turnover. Anal Chem, 2004. 76(1): p. 86–97 [DOI] [PubMed] [Google Scholar]
- 30. Choudhary K., Spicer V. L., Donald L. J., Duckworth H. W., Ens W., Loewen P. C., Standing K. G. Method for estimating the isotopic distributions of metabolically labeled proteins by MALDI-TOFMS: Application to NMR samples. Analytical Chemistry, 2006. 78 (15): p. 5419–5423 [DOI] [PubMed] [Google Scholar]
- 31. VerBerkmoes N. C., Denef V. J., Hettich R. L., Banfield J. F. (2009) Systems biology: Functional analysis of natural microbial consortia using community proteomics. Nat. Rev. Microbiol. 7, 196–205 [DOI] [PubMed] [Google Scholar]