

Summary
Background and objectives
Extracellular volume (ECV) is the fluid contained in all noncellular compartments of the body and is a quantity tightly controlled by the kidney. Thus, there is a strong link between ECV and kidney function.
Design, setting, participants & measurements
The Chronic Kidney Disease in Children (CKiD) study uses injected iohexol to obtain direct measures of GFR. Direct calculation of ECV was viable from GFR studies using descriptors of the disappearance curves. Using linear regression methods on the log-transformed variables, markers of size (height and weight) and biomarkers of kidney disease (serum creatinine, blood urea nitrogen, and cystatin C) were assessed for their relationships with ECV normalized to body weight (ECV/wt). The relationship to hypertension (systolic BP >95th percentile for age, sex, and height) was also assessed.
Results
Data from 790 iohexol studies with medians for GFR = 43.4 ml/min per 1.73 m2, weight = 35 kg, and height = 1.4 m were used. The median ECV was 8.6 L, and the median ECV/wt was 0.23 L/kg. ECV was found to be a function of height (m) and weight (kg) according to the relationship ECV = × height. Biomarkers of kidney disease yielded significant relationships with ECV/wt, but the strength of association was small. No significant association between ECV/wt and hypertension was found.
Conclusions
ECV has relevance to studies of chronic kidney disease, is related to biomarkers, and can be easily estimated from the square root of weight and height.
Introduction
Chronic kidney disease (CKD) is often seen in conjunction with hypertension. A possible mediator of the relationship is extracellular volume (ECV), the fluid contained in all noncellular compartments. ECV is tightly controlled as a critical function of the kidney. However, kidney dysfunction and disease are associated with activation of the renin-angiotensin aldosterone system, the importance of which in the regulation of blood pressure (BP) and fluid balance has long been recognized (1). Renin-angiotensin aldosterone system activation and an accompanying positive sodium balance may lead to expanded ECV and hypertension (2).
Some evidence exists to support ECV as a link between CKD, hypertension, and cardiovascular disease. A reduction in ECV using loop diuretics has been observed to effectively lower BP in patients with CKD (3). Although kidney filtration plays a primary role in adjusting ECV, the dynamics of the relationship between glomerular filtration rate (GFR) and ECV are not entirely clear (4–12). Associations among expanded ECV, obesity, hypertension, and potentially albuminuria have been noted (13–15), suggesting that an increased ECV may also predict some CKD-associated comorbidities.
In addition to possible value as a predictor of disease progression and cardiovascular morbidity, ECV is also a metric of body size. Previous investigators have suggested that ECV may serve as a physiologically and theoretically more appropriate index variable for GFR (16,17), particularly for children in whom BSA is relatively high (18).
ECV can be estimated for an individual from the time taken to clear an injected marker from the body. After equilibration, the function describing the decline in serum concentration contains information concerning the distribution volume of the marker, which approximates ECV for most markers used to assess kidney function. The estimation of ECV is accomplished using the same measured parameters as for calculation of GFR. The National Institute of Health-funded cohort study of Chronic Kidney Disease in Children (CKiD) has used the plasma disappearance of iohexol to obtain a directly measured GFR with sampling at 10, 30, 120, and 300 minutes to describe the two-compartment model (19).
In this report, we describe the distribution of ECV in the CKiD cohort and its relationship to measures of body size and markers of disease progression. We assessed the strength of association of several biomarkers of CKD severity with ECV and examined whether expanded ECV was related to the presence of hypertension in children with CKD.
Materials and Methods
Study Participants and Design
The CKiD study has been described previously (20). Briefly, children were recruited with mild to moderate CKD (30 to 90 ml/min per 1.73 m2) on the basis of the original Schwartz formula (21–23) from 43 participating pediatric nephrology centers. Eligible subjects were those 1 to 16 years of age who had never been dialyzed or undergone organ transplant. GFR was determined from plasma iohexol disappearance curves at baseline, 1 year later, and every other year thereafter. Data from participants with four-point iohexol GFR measurements performed during visits 1 and 2 were used for the calculation of ECV.
Biomarker Assays
At the study visit, an intravenous line or butterfly needle was used to administer 5 ml of iohexol. A second intravenous line was saline locked and used for obtaining blood samples for measurement of serum creatinine (SCr) and blood urea nitrogen (BUN); an aliquot was also obtained for HPLC determination of an iohexol blank. SCr (enzymatic) and BUN were analyzed centrally at the CKiD laboratory at the University of Rochester (G. Schwartz) on an Advia 2400 (Siemens Diagnostics, Tarrytown, NY) system. Blood samples were collected at four time points (10, 30, 120, and 300 minutes) after infusion for GFR and ECV calculation. Body surface area (BSA) was determined using the formula of Haycock et al. (24). Serum albumin was determined by the bromocresol green binding method, and cystatin C was determined by nephelometry (Siemens Dade-Behring).
Calculation of GFR and ECV from Plasma Disappearance Curve
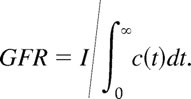
The volume VD in which a dose I of an injected marker is distributed is the product of the clearance rate (GFR) and the total clearance time (T). Expressions for GFR and T can be derived from the function c(t), which describes the concentration of the marker in a unit volume at time t after injection. Assuming a steady GFR (i.e., not dependent on t), the amount of the injected marker that is cleared at time t is given by I(t) = GFR × c(t). For a marker that is neither secreted nor absorbed, the entire injected dose I is eventually cleared and thus I = ∫0∞I(t) = GFR∫0∞c(t)dt. Hence, the clearance rate can be found from the ratio of the injected dose of the marker to the area under the concentration curve. That is,
 |
The proportional decrease in concentration at each time t is c(t)/∫0∞c(t)dt, which describes the proportion of the molecules of the marker that is cleared at time t. Averaging across all times results in an expression for the mean transit time,
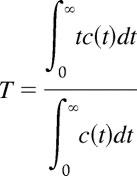 |
or, equivalently, the total clearance time.
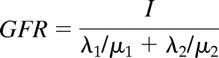
When describing kidney filtration, a two-compartment model is commonly used with the loss of the marker from the plasma characterized by a bi-exponential function. Thus c(t) is specified to be λ1e−μ1t + λ2e−μ2t, with μ1 and μ2 being the rate constants for the first (taken to represent exchange of the marker between plasma and the interstitial fluid of the whole body) and second (representing excretion by the kidneys) exponentials, respectively, and λ1 and λ2 describing the zero-time intercepts. From this representation, ∫0∞c(t)dt = λ1/μ1 + λ2/μ2 and ∫0∞tc(t)dt = λ1/μ12 + λ2/μ22. It follows that
 |
and the mean transit time corresponds to
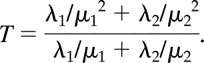 |
This equation can also be expressed as (1 − ω)/μ1 + ω/μ2, where ω = (λ2/μ2)(λ1/μ1 + λ2/μ2), which explicitly represents T as a weighted average of the mean times the marker resides in each of the two compartments. Given an expression for GFR, the clearance rate, and for T, the clearance time, the volume of distribution of the marker then follows from
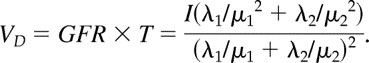 |
The calculation for the volume of distribution comes from the work of Nosslin (25), with the mathematical model detailed by Anderson (26). The ECV is assumed to be equal to the volume of distribution. It should be noted that the volume of distribution is a function of the marker used to measure it (27). Our analysis of the CKiD population permits examining ECV over a wide range of body size, BP, and kidney function.
Statistical Analyses
After calculation of ECV, ECV was normalized to weight (ECV/wt), yielding a volume expressed as a proportion of body weight. In addition, ECV was normalized to a function of weight and height (·ht), determined from regression analysis, to remove all assciation with body size (equivalent to the residuals after regression of ECV on height and weight). The relationship between the log of ECV in its unadjusted and adjusted forms was then regressed on the log of continuous markers of body size (age, weight, height, and BSA) as well as the indicator variables for sex and Tanner stage. The log of ECV was similarly regressed on the log of continuous markers of disease progression (SCr, cystatin C, and BUN) and the indicator for hypoalbuminemia (defined as albumin < 4 g/dl). The form of the regression equation was ECV = α × Xβ, where X was the continuous predictor value or ECV = α × γI, where I was the indicator for the dichotomous trait. Thus, β was a power that qualified the value of the continuous predictor and γ was a percent change from the reference value of 1.0. Standard errors were adjusted for repeated measurements from individual participants using a robust sandwich variance estimator. Similar regressions were performed with GFR (BSA adjusted) as the dependent variable to provide a comparison for the magnitude of association between ECV and the various markers. Regression coefficients were standardized according to the formula β* = β × σx/σy, where β was the unstandardized coefficient and σx/σy was the ratio of the independent variable SD to the dependent variable SD.
The relationship between adjusted ECV and hypertension was also assessed using regression analysis and a comparison of means. Hypertension was defined as greater than or equal to the 95th percentile by age, sex, and height of systolic BP.
Results
The calculated ECVs from the 790 four-point iohexol studies in 509 participants yielded a median ECV of 8.6 L (interquartile range: 5.9 to 12.2 L) and a median ECV/wt of 0.23 L/kg (interquartile range: 0.20 to 0.25 L/kg). The median age for the participant-visits was 11.3 years and the median GFR was 43.4 ml/min per 1.73 m2 (Table 1). ECV and GFR are functions of body size, such that larger individuals have larger ECVs and higher absolute GFRs. The extent to which ECV and GFR are also related to kidney disease can only be assessed after removing any relationship with body size. Thus, GFR is commonly normalized to BSA and ECV is often assessed as a proportion of body weight. The effects of adjustment are clearly seen in Table 2. In Table 2, unadjusted ECV was strongly related to markers of body size and some measures of kidney function (SCr and hypoalbuminemia). When ECV was assessed as a proportion of body weight, the magnitude of association with markers of body size was attenuated but relationships were still statistically significant. The relationships with age and Tanner stage indicated that ECV as a percentage of body weight declined with increasing physical development. This trend can be seen in Figure 1. The median values of ECV/wt across categories of age were 0.26, 0.24, 0.23, and 0.21 L/kg for <5, [5 to 10), [10 to 15) and ≥15 years, respectively. Similarly the median values across categories of Tanner stage were 0.24, 0.23, 0.23, 0.22, and 0.20 L/kg for stages 1 through 5, respectively. Normalizing ECV to weight attenuated the significant relationships with 1/SCr, height/SCr, and hypoalbuminemia noted in the unadjusted ECV data.
Table 1.
Characteristics of the baseline sample of participants from the CKiD cohort and from the participant-visits taken from visit 1 and visit 2
| Variable | Value |
|---|---|
| n = 509 participants, baseline assessment | |
| male gender (%) | 62.6 |
| white race (%) | 72.1 |
| Tanner stage 1 (%) | 58.0 |
| glomerular diagnosis (%) | 20.8 |
| n = 790 participant-visits, median (interquartile range) | |
| age (years) | 11.3 (7.9 to 14.8) |
| height (m) | 1.4 (1.2 to 1.6) |
| weight (kg) | 38.2 (24.4 to 55.6) |
| BSA (m2) | 1.2 (0.9 to 1.6) |
| BMI (kg/m2) | 18.5 (16.3 to 22.1) |
| SCr (mg/dl) | 1.3 (1.0 to 1.9) |
| height (m)/SCr (mg/dl) | 1.0 (0.8 to 1.4) |
| cystatin C (mg/L)a | 1.6 (1.3 to 2.2) |
| BUN (mg/dl) | 32.1 (23.1 to 42.9) |
| albumin (g/dl) | 4.3 (4.1 to 4.5) |
| iohexol GFR (ml/min per 1.73 m2) | 43.4 (32.6 to 55.7) |
| ECV (L) | 8.6 (5.9 to 12.2) |
| ECV (L)/weight (kg) | 0.2 (0.2 to 0.3) |
n = 267.
Table 2.
Results from regressing adjusted and unadjusted ECV on markers of body size and kidney function n = 790
| Variables | Regression Coefficient (β) ± SEM |
||
|---|---|---|---|
| Unadjusted ECV | Weight-Adjusted ECV | ·ht-Adjusted ECV | |
| Markers of body size | |||
| female gendera | 0.974 ± 0.035 | 0.959 ± 0.013 | 0.975 ± 0.010 |
| Tanner Stage 1 (reference)a | 1 | 1 | 1 |
| 2a | 1.650 ± 0.098 | 0.956 ± 0.020 | 1.010 ± 0.016 |
| 3a | 2.030 ± 0.093 | 0.921 ± 0.024 | 1.029 ± 0.021 |
| 4a | 2.258 ± 0.077 | 0.917 ± 0.018 | 1.052 ± 0.016 |
| 5a | 2.411 ± 0.087 | 0.847 ± 0.017 | 1.022 ± 0.016 |
| age (years) | 0.803 ± 0.016 | −0.132 ± 0.012 | −0.017 ± 0.009 |
| weight (kg) | 0.823 ± 0.010 | −0.177 ± 0.010 | >−0.001 ± 0.009 |
| height (m) | 2.333 ± 0.032 | −0.345 ± 0.031 | −0.006 ± 0.025 |
| BSA (m2) | 1.242 ± 0.014 | −0.251 ± 0.015 | −0.001 ± 0.013 |
| Markers of kidney function | |||
| 1/SCr (mg/dl) | −0.433 ± 0.032 | 0.062 ± 0.013 | 0.022 ± 0.010 |
| height (m)/SCr (mg/dl) | −0.097 ± 0.041 | 0.013 ± 0.015 | 0.030 ± 0.012 |
| 1.8/cystatin C (mg/L) | −0.001 ± 0.073 | <0.001 ± 0.029 | 0.052 ± 0.022 |
| 30/BUN (mg/dl) | 0.075 ± 0.039 | 0.033 ± 0.015 | 0.068 ± 0.011 |
| Albumin < 4 (g/dl)a | 1.324 ± 0.067 | 0.930 ± 0.018 | 1.004 ± 0.015 |
Except where indicated, regressions were of the form ECV = α × Xβ, with β interpreted as the power qualifying the value of the marker to describe its effect on ECV. Bold indicates P < 0.05.
Dichotomous and categorical variables for which the regression coefficient is a percentage of reference value (e.g., 1.1 is 10% higher than reference and 0.9 is 10% lower than reference).
Figure 1.

Distribution of ECV/wt by age (in the 788 person-visits) and Tanner stage(in the 756 person-visits) from the CKiD cohort visits 1 and 2. The median values of ECV/wt across categories of age (from left to right) were 0.26, 0.24, 0.23, and 0.21 L/kg and across categories of Tanner stage (from left to right) were 0.24, 0.23, 0.23, 0.22, and 0.20 L/kg.
Given indications that normalizing ECV/wt did not remove all variability associated with body size, we regressed ECV on weight and height specifying an equation analogous to Haycock et al. (24) (Y = a × weightb × heightc). Similar to the relationship between BSA and the measurements of height and weight, ECV was also well estimated from those variables (Figure 2). We found the estimated values of a, b, and c were 0.962, 0.511, and 0.963, respectively. Using this information, we removed all variability in ECV associated with height and weight using ECV/(·ht). This formulation resulted in the estimated regression coefficients approaching zero for all markers of body size except sex, which remained significant (Table 2). There was no longer a trend in ECV/(·ht) as a function of Tanner stage. However, ECV/(·ht) was associated with all markers of kidney function except hypoalbuminemia. The association appeared strongest with BUN, with an estimated effect of 0.068 L/(·m). When the regression coefficients were standardized and compared with those from regressing GFR on the biomarker values, the strength of association was much greater for the outcome of GFR as seen in Table 3.
Figure 2.

Plot of ECV versus BSA illustrating the correlation between the two measures of body size. ECV can be estimated from height and weight in a similar manner to BSA.
Table 3.
Standardized regression coefficients from regressing BSA-adjusted GFR and ·ht-adjusted ECV on markers of kidney function (n = 790)
| Markers of Kidney Function | Standardized Effect Estimate |
|
|---|---|---|
| BSA-Adjusted GFR | ·ht-Adjusted ECV | |
| 1/SCr (mg/dl) | 0.110 | 0.004 |
| Height (m)/Scr (mg/dl) | 0.145 | 0.005 |
| 1.8/cystatin C (mg/L) | 0.276 | 0.016 |
| 30/BUN (mg/dl) | 0.112 | 0.012 |
| Albumin < 4 (g/dl)a | 0.977 | 1.001 |
Except where indicated, regressions were of the form GFR = α × Xβ, with β interpreted as the power qualifying the value of the marker to describe its effect on GFR.
Dichotomous and categorical variables for which the regression coefficient is a percentage of reference value (e.g., 1.1 is 10% higher than reference and 0.9 is 10% lower than reference).
When the relationship between ECV and BP was assessed in this sample of children with CKD, we found no significant association in linear regression analysis. Comparing the median ECV/wt between hypertensives (systolic BP percentage ≥95%) and nonhypertensives (systolic BP percentage <95%) did not yield a statistically significant difference. Figure 3 compares these ECV/wt distributions for levels of hypertension. ECV/(·ht) was similarly unassociated with hypertension.
Figure 3.

Distribution of ECV/wt by categories of greater than the 95th percentile and less than or equal to the 95th percentile of systolic BP (normalized for height and age) in 756 person-visits from CKiD cohort visits 1 and 2.
Evaluating ECV as a marker of body size, ECV was found to be strongly correlated with BSA on the log scale (ρ = 0.95), as illustrated in Figure 2. Fitting a regression line through the data yielded a regression coefficient of 1.24 to describe the power that quantifies the predictive effect of a unit change in BSA on ECV. Using the regression equation to estimate the ECV equivalent to a BSA of 1.73 m2 (the value usually considered the size of a standard adult) yielded a value of 13.5 L.
Discussion
The primary function of the kidneys is to maintain fluid balance through tight control of the chemical composition of the ECV. As kidney function declines, a loss of regulatory function may lead to expanded ECV, which could in turn lead to cardiovascular sequelae as a result of the additional loading of the system. However, although such relationships have been noted in adults, particularly in the context of obesity (13,14), evidence that ECV is related to kidney disease and hypertension is lacking in this pediatric sample. Although there was an association between ECV and several markers of kidney disease after removing the variability associated with height and weight, the direction of the relationships indicated that expanded ECV was protective. Stratifying by glomerular diagnosis revealed differences in the inferences from biomarker associations that may hint at a differential effect on ECV in the two disease processes. However, children with a glomerular diagnosis comprised a minority in our sample (approximately 20%) and thus we did not have a sufficient sample size to fully explore differences in the biomarker associations with ECV. The participants in CKiD had few reported visits with edema (25 person-visits) and thus this cohort may not have had enough individuals with large deviations in ECV and resulting sequelae.
Although there is a plausible biologic mechanism whereby expanded ECV as a result of disease progression would increase cardiovascular risk, we did not find differences in the distribution of ECV between those with and without high systolic BP. Because the number of subjects taking diuretics was small, accounting for only 8 of the 790 person-visits, this therapy was not the explanation for the failure to see expanded ECV in hypertension. However, it is possible that expanded ECV produces a small upward shift in BP that acts over time to increase cardiovascular morbidity and mortality, an effect that would not be observed in this pediatric cohort with limited follow-up.
What is clear from this analysis is that ECV is strongly related to body size, as can be seen from Table 2, which illustrated the changing regression coefficients with improved body size standardization. ECV is related to an individual's height and weight and is highly correlated with BSA, a result found by several investigators (17,28,29). Previous work has explored the exact relationship between ECV and these other measures of body size. Friis-Hansen (30) in 1961 provided a formula to estimate ECV in children that was based on percentages of weight and height. The formula was of the form ECV = a × weightb × heightc, and he found ECV was best approximated using parameter estimates of 0.0682, 0.400, and 0.633 for a, b, and c, respectively. A similar equation was reported by Bird et al. (31) with estimates of 0.0215, 0.647,and 0.724, respectively, which the authors contrasted with the Haycock formula to estimate BSA (24). Haycock et al. found BSA best estimated using 0.024, 0.538, and 0.396 for a, b, and c, respectively. In this report, we found that height provided most of the information in the estimation of ECV, and ECV could be simply estimated from ECV = ( × height). Thus, although in the study presented here we utilized the iohexol plasma disappearance protocol from the four-point GFR studies to assess ECV, a good estimation of ECV can be obtained using only height and weight measurements.
Friis-Hansen (30) has shown that ECV as a percent of body weight decreases with maturation, rapidly during the first year of life and gradually thereafter until age 10 to 15 years. Our study shows a similar decrease as a function of Tanner stage (see Figure 1), which is a surrogate for age and maturation. Indeed, the measurement they obtained for the 10- to 15-year age group was 18.7% of body weight. They note that the thiosulfate method, which estimated ECV, neglects the contribution of water in the gastrointestinal tract and other transcellular sources of transcellular water and therefore underestimates ECV by 5% to 10% in terms of percent of body weight. Thus, their estimate is probably closer to 24%, which echoes the 24% we observed in Tanner 1 to 3 subjects using iohexol distribution. Additionally, our results indicating that girls have lower ECV than boys of the same weight (Table 2) agrees with the previous findings of Friis-Hansen (30), which follows from the higher average percentage of body fat for postpuberty girls versus boys.
In summary, in this pediatric cohort, ECV was related to the disease process but to a lesser degree than to GFR and was not a clear predictor of cardiovascular morbidity. However, ECV is a quantity that can be measured in a similar fashion to GFR, is a measure of body size, and as such has some relevance to studies of CKD. Indexation of GFR to ECV abolishes many of the differences between adults and young children with respect to scaling GFR to BSA (29). This advantage may be further exploited because it is technically simple to measure simply the renal slope (μ2), and this is equivalent to GFR per unit ECV. Further ECV may be estimated well from weight and height, yielding an easily attainable parameter. ECV may yet prove an important predictor of disease in a more edematous cohort and, should the strong relationship with height and weight found here persist in such a population, then it could be easily estimated for research or clinical purposes.
Disclosures
None.
Acknowledgments
Data in this manuscript were collected by the CKiD with clinical coordinating centers (principal investigators) at Children's Mercy Hospital and the University of Missouri–Kansas City (Bradley Warady, MD) and Johns Hopkins School of Medicine (Susan Furth, MD, PhD), the data coordinating center at the Johns Hopkins Bloomberg School of Public Health (Alvaro Muñoz, PhD), and the Central Biochemistry Laboratory at the University of Rochester (George J. Schwartz, MD). National Institute of Diabetes and Digestive and Kidney Diseases funds CKiD, with additional funding from the National Institute of Neurologic Disorders and Stroke; the National Institute of Child Health and Human Development; and the National Heart, Lung, and Blood Institute (U01 DK82194, U01-DK-66143, U01-DK-66174, and U01-DK-66116). The CKID website is http://www.statepi.jhsph.edu/ckid.
Footnotes
Published online ahead of print. Publication date available at www.cjasn.org.
See related editorial, “A Simple Estimate for Extracellular Volume: Too Simple?” on pages 695–696.
References
- 1. Siragy HM, Carey RM: Role of the intrarenal renin-angiotensin-aldosterone system in chronic kidney disease. Am J Nephrol 31: 541–550, 2010 [DOI] [PMC free article] [PubMed] [Google Scholar]
- 2. Bomback AS, Klemmer PJ: Interaction of aldosterone and extracellular volume in the pathogenesis of obesity-associated kidney disease: A narrative review. Am J Nephrol 30: 140–146, 2009 [DOI] [PMC free article] [PubMed] [Google Scholar]
- 3. Vasavada N, Agarwal R: Role of excess volume in the pathophysiology of hypertension in chronic kidney disease. Kidney Int 64: 1772–1779, 2003 [DOI] [PubMed] [Google Scholar]
- 4. Norgaard K, Jensen T, Skott P, Thorsteinsson B, Bruun NE, Giese J, Feldt-Rasmussen B: Effects of insulin on renal haemodynamics and sodium handling in normal subjects. Scand J Clin Lab Invest 51: 367–376, 1991 [DOI] [PubMed] [Google Scholar]
- 5. Elinder G, Aperia A, Herin P, Kallskog O: Effect of isotonic volume expansion on glomerular filtration rate and renal hemodynamics in the developing rat kidney. Acta Physiol Scand 108: 411–417, 1980 [DOI] [PubMed] [Google Scholar]
- 6. Rasmussen SN, Andersen JS, Nissen OI: Effects of Ringer fluid on regional blood flow and filtration rate in the cat kidney. Am J Physiol 248: F851–F857, 1985 [DOI] [PubMed] [Google Scholar]
- 7. Wesson DE: Glomerular filtration effects of acute volume expansion: Importance of chloride. Kidney Int 32: 238–245, 1987 [DOI] [PubMed] [Google Scholar]
- 8. Cervenka L, Mitchell KD, Navar LG: Renal function in mice: Effects of volume expansion and angiotensin II. J Am Soc Nephrol 10: 2631–2636, 1999 [DOI] [PubMed] [Google Scholar]
- 9. Tabaru H, Finco DR, Brown SA, Cooper T: Influence of hydration state on renal functions of dogs. Am J Vet Res 54: 1758–1764, 1993 [PubMed] [Google Scholar]
- 10. Kover G, Tost H, Darvasi A: The effect of Ringer solution induced extracellular volume expansion on kidney function. Acta Physiol Hung 74: 141–160, 1989 [PubMed] [Google Scholar]
- 11. Boberg U, Morsing P, Persson AE: Renal response to volume depletion and expansion in Milan hypertensive rats. Acta Physiol Scand 145: 261–265, 1992 [DOI] [PubMed] [Google Scholar]
- 12. Tost H, Kover G: Effect of volume expansion induced by Ringer's solution or plasma on the natriuretic response of the kidney. Acta Physiol Hung 83: 227–242, 1995 [PubMed] [Google Scholar]
- 13. Rasouli N, Kern PA: Adipocytokines and the metabolic complications of obesity. J Clin Endocrinol Metab 93: S64–S73, 2008 [DOI] [PMC free article] [PubMed] [Google Scholar]
- 14. Yano Y, Hoshide S, Ishikawa J, Hashimoto T, Eguchi K, Shimada K, Kario K: Differential impacts of adiponectin on low-grade albuminuria between obese and nonobese persons without diabetes. J Clin Hypertens (Greenwich) 9: 775–782, 2007 [DOI] [PMC free article] [PubMed] [Google Scholar]
- 15. Sharma K, Ramachandrarao S, Qiu G, Usui HK, Zhu Y, Dunn SR, Ouedraogo R, Hough K, McCue P, Chan L, Falkner B, Goldstein BJ: Adiponectin regulates albuminuria and podocyte function in mice. J Clin Invest 118: 1645–1656, 2008 [DOI] [PMC free article] [PubMed] [Google Scholar]
- 16. Brochner-Mortensen J: A simple single injection method for determination of the extracellular fluid volume. Scand J Clin Lab Invest 40: 567–573, 1980 [DOI] [PubMed] [Google Scholar]
- 17. White AJ, Strydom WJ: Normalisation of glomerular filtration rate measurements. Eur J Nucl Med 18: 385–390, 1991 [DOI] [PubMed] [Google Scholar]
- 18. Peters AM, Gordon I, Sixt R: Normalization of glomerular filtration rate in children: Body surface area, body weight or extracellular fluid volume? J Nucl Med 35: 438–444, 1994 [PubMed] [Google Scholar]
- 19. Schwartz GJ, Furth S, Cole SR, Warady B, Muñoz A: Glomerular filtration rate via plasma iohexol disappearance: Pilot study for chronic kidney disease in children. Kidney Int 69: 2070–2077, 2006 [DOI] [PubMed] [Google Scholar]
- 20. Furth SL, Cole SR, Moxey-Mims M, Kaskel F, Mak R, Schwartz G, Wong C, Muñoz A, Warady BA: Design and methods of the Chronic Kidney Disease in Children (CKiD) prospective cohort study. Clin J Am Soc Nephrol 1: 1006–1015, 2006 [DOI] [PMC free article] [PubMed] [Google Scholar]
- 21. Schwartz GJ, Haycock GB, Edelmann CM, Jr, Spitzer A: A simple estimate of glomerular filtration rate in children derived from body length and plasma creatinine. Pediatrics 58: 259–263, 1976 [PubMed] [Google Scholar]
- 22. Schwartz GJ, Gauthier B: A simple estimate of glomerular filtration rate in adolescent boys. J Pediatr 106: 522–526, 1985 [DOI] [PubMed] [Google Scholar]
- 23. Schwartz GJ, Brion LP, Spitzer A: The use of plasma creatinine concentration for estimating glomerular filtration rate in infants, children, and adolescents. Pediatr Clin North Am 34: 571–590, 1987 [DOI] [PubMed] [Google Scholar]
- 24. Haycock GB, Schwartz GJ, Wisotsky DH: Geometric method for measuring body surface area: A height-weight formula validated in infants, children, and adults. J Pediatr 93: 62–66, 1978 [DOI] [PubMed] [Google Scholar]
- 25. Nosslin B: Determination of clearance and distribution volume with the single injection technique. Acta Med Scand 442[Suppl]: 97–101, 1965 [Google Scholar]
- 26. Anderson SB: Metabolism of Human Gamma Globulin (ss-globulin), Oxford, Blackwell Scientific Publishers, 1964 [Google Scholar]
- 27. Gunasekera RD, Allison DJ, Peters AM: Glomerular filtration rate in relation to extracellular fluid volume: Similarity between 99mTc-DTPA and inulin. Eur J Nucl Med 23: 49–54, 1996 [DOI] [PubMed] [Google Scholar]
- 28. Newman EV, Bordley J, Winternitz J: The interrelationship of glomerular filtration rate (mannitol clearance), extracellular fluid volume, surface area of the body, and plasma concentration of mannitol. Johns Hopkins Hosp Bull 75: 253–268, 1944 [Google Scholar]
- 29. Peters AM: The kinetic basis of glomerular filtration rate measurement and new concepts of indexation to body size. Eur J Nucl Med Mol Imaging 31: 137–149, 2004 [DOI] [PubMed] [Google Scholar]
- 30. Friis-Hansen B: Body water compartments in children: Changes during growth and related changes in body composition. Pediatrics 28: 169–181, 1961 [PubMed] [Google Scholar]
- 31. Bird NJ, Henderson BL, Lui D, Ballinger JR, Peters AM: Indexing glomerular filtration rate to suit children. J Nucl Med 44: 1037–1043, 2003 [PubMed] [Google Scholar]