

Abstract
Snail1 and Zeb1 are E-cadherin-transcriptional repressors induced during epithelial mesenchymal transition (EMT). In this article we have analyzed the factors controlling Zeb1 expression during EMT. In NMuMG cells treated with TGF-β, Snail1 RNA and protein are induced 1 h after addition of the cytokine preceding Zeb1 up-regulation that requires 6–8 h. Zeb1 gene expression is caused by increased RNA levels but also by enhanced protein stability and is markedly dependent on Snail1 because depletion of this protein prevents Zeb1 protein and RNA up-regulation. In addition to Snail1, depletion of the Twist transcriptional factor retards Zeb1 stimulation by TGF-β or decreases Zeb1 expression in other cellular models indicating that this factor is also required for Zeb1 expression. Accordingly, Snail1 and Twist cooperate in the induction of Zeb1: co-transfection of both cDNAs is required for the maximal expression of ZEB1 mRNA. Unexpectedly, the expression of Snail1 and Twist shows a mutual dependence although to a different extent; whereas Twist depletion retards Snail1 up-regulation by TGF-β, Snail1 is necessary for the rapid increase in Twist protein and later up-regulation of Twist1 mRNA induced by the cytokine. Besides this effect on Twist, Snail1 also induces the nuclear translocation of Ets1, another factor required for Zeb1 expression. Both Twist and Ets1 bind to the ZEB1 promoter although to different elements: whereas Ets1 interacts with the proximal promoter, Twist does it with a 700-bp sequence upstream of the transcription start site. These results indicate that Snail1 controls Zeb1 expression at multiple levels and acts cooperatively with Twist in the ZEB1 gene transcription induction.
Keywords: Cell-Cell Interaction, Epithelial Cell, Transcription, Transcription Factors, Transcription Repressor, EMT, Snail1, TGF-β, Twist, Zeb1
Introduction
Epithelial to mesenchymal transition (EMT)5 defines a process during which cells lose their epithelial characteristics and acquire typical properties of mesenchymal cells. This transition requires complex changes in cell shape that happen concomitantly to gene expression reprogramming (1). The main hallmark of EMT is the down-regulation of the adherens junction protein E-cadherin due to transcriptional repression. Overexpression of Snail1 in epithelial cells causes a complete EMT and down-regulates E-cadherin through its binding to the E-cadherin promoter (2, 3); moreover, up-regulation of Snail1 RNA is observed in many cellular systems when EMT is induced (4). Besides Snail1, other cellular factors such as the Snail1-related Slug (Snail2) (5), the basic helix-loop-helix protein E12/E47 (6), or two members of the Zeb family, Zeb1/δEF-1 and Zeb2/Sip1 (7–9), are capable of repressing E-cadherin (CDH1) promoter activity and RNA levels. Curiously, all of these factors bind to the same elements in the CDH1 gene: three E-boxes with a core 5′-CACCTG-3′ sequence placed in the proximal promoter. Different results indicate that expression of some of these genes is interdependent; for instance, it has been shown that overexpression of Snail1 increases the levels of ZEB1 mRNA (10). A relevant role for Zeb1 in the definitive repression of the E-cadherin gene during EMT has been recently proposed, according to the results obtained by RNA interference experiments (4). In this article we have investigated the mechanism controlling Zeb1 expression in two EMT systems: NMuMG cells treated with TGF-β and RWP-1 cells after ectopic expression of Snail1.
EXPERIMENTAL PROCEDURES
Cell Culture and Transfections
Mouse breast epithelial NMuMG cells were routinely cultured in Dulbecco's modified Eagle's medium (Invitrogen) supplemented with 10% fetal bovine serum (Biological Industries), 10 μg/ml of insulin (Sigma), 100 units/ml of penicillin, and 50 μg/ml of streptomycin. Other cell lines (RWP-1, SW-480, MiaPaca-2, and SW-620) were grown in DMEM plus 10% FBS. As shown before (2, 10), the first two cell lines express E-cadherin, whereas MiaPaca-2 and SW-620 are more mesenchymal and express Zeb1 and Snail1. The generation of RWP1-Snail1 and SW-480-Snail1 cells has been previously reported (11, 12); upon Snail1 transfection these two cell lines lose E-cadherin expression and up-regulate mesenchymal cells markers. When indicated, cells were treated with TNFα (PrepoTech) (40 nm) for 4 h in DMEM, or with TGF-β (5 ng/ml) for the indicated times. For generation of the Twist1-, Ets1-, or Snail1-depleted cell populations, DNA from the 5 MISSION® short hairpin RNAs (shRNA) corresponding to the human or murine version of the two genes, either individually or in a combination of these (see supplemental Table S1), or Non-Target Control Vectors (Sigma), was transfected to RWP-1 Snail1, SW-620, MiaPaca-2, or NMuMG cells. Stable cell pools were generated by transfecting the indicated cells lines with Lipofectamine Plus Reagent according to the manufacturer's instructions (Invitrogen) and selecting with puromycin (4 μg/ml) for 5 days, or G418 (0.8 mg/ml) for 14 days. Down-regulation of Snail1 or Twist was alternatively performed in NMuMG cells transfecting specific synthetic siRNAs (see supplemental Table S1). RNA interference was always performed using two interference RNAs (shRNA or siRNA) in independent experiments targeting different sequences, with very similar results. Details of the sequences used for the interference experiments are provided under supplemental Table S1.
Analysis of Protein Expression
Cells were lysed in cold lysis buffer 1 (20 mm Hepes, pH 7.5, 25% glycerol, 420 mm NaCl, 1% Triton X-100, 1.5 mm MgCl2, and 0.2 EDTA) containing protease inhibitors (10 μg/ml of aprotinin, 2 mm Pefablock, 10 μg/ml of pepstatin, and 10 μg/ml of leupeptin). Alternatively, cells lysates were prepared with soft lysis buffer 2 (20 mm Hepes-KOH, pH 7.8, 1.5 mm MgCl2, 10 mm KCl, 0.5 mm DTT) to separate cytoplasmic from nucleic fractions. Cells were carefully resuspended with a micropipette and the integrity of the nuclei was verified by DAPI staining and visualizing in the microscope. After centrifuging at 300 × g for 10 min, the supernatant was considered to be the cytosolic fraction. The pellet was resuspended in buffer 3 (20 mm Hepes-KOH, pH 7.8, 25% glycerol, 420 mm NaCl, 1.5 mm MgCl2, 0.2 mm EDTA, 0.5 mm DTT), passed 10 times through a 20-gauge syringe and centrifuged at 15,000 × g for 15 min to obtain the nucleic fraction. Proteins were analyzed by Western blot using the following primary antibodies: mouse monoclonal anti-Snail (13), goat polyclonal anti-Zeb1 (from Santa Cruz, E-20), rabbit polyclonal anti-Twist and anti-lamin B1 (from Abcam), rabbit polyclonal anti-Ets1 (from Santa Cruz), mouse monoclonal anti-HA (Roche Applied Science); mouse monoclonal anti-poly(ADP-ribose) polymerase 1 (a kind gift of Dr. J. Yélamos, IMIM-Hospital del Mar), or goat polyclonal anti-pyruvate kinase (Chemicon).
RNA Analysis
Transcripts were analyzed by reverse transcription coupled to PCR (RT-PCR), using 0.25–0.5 μg of total RNA. Primers and conditions for the semi-quantitative analysis of ZEB1, SNAIL1, and hypoxanthine-guanine phosphoribosyltransferase have been previously reported (11). TWIST1 expression was analyzed using two oligonucleotides corresponding to sequences +416/+435 and +568/+549 with respect to the ATG. Transcript expression levels were also determined by real time RT-PCR using SYBR Green (Roche Diagnostics), as described (11). The same primers used for semi-quantitative analysis were used for TWIST1. miR-200 transcript was analyzed by RT-PCR using 1 μg of total RNA and primers 5′-TCGAAACTCTCCCAGAGACG-3′ (forward) and 5′-AGACCTGCAAGGGTGAGCTT-3′ (reverse) for human samples; as negative control a genomic amplicon was amplified with 5′-GGCCTGCGTCACCGTCACT-3′ (forward) and 5′-CTCGCCTTACAAGGAGCAGT-3′ (reverse) (14). Murine samples were analyzed with oligonucleotides 5′-AGTGCCTGGGTTCTGCATAC-3′ (forward) and 5′-CTAGGCGGAGACTTAGCCCT-3′ (reverse); in this case, the genomic negative control was amplified using the same primers without reverse transcription. Pumilio or hypoxanthine-guanine phosphoribosyltransferase were used as loading controls.
Vectors for Promoter Assays and Analysis of Activity
A fragment of human DNA located 5′-upstream of the ZEB1 coding sequence was amplified using the HT-29 M6 genomic DNA and oligonucleotides corresponding to sequences −1029/−1012 (with respect to the ATG) (sense oligo) and +6/−11 (antisense). This fragment was cloned in the MluI/HindIII sites of pGL3 (Promega). After determination of the transcription start site this promoter was named −1004/+29. The −147/+29 promoter fragment was obtained by cutting −1004/+29 with MluI and BstZI, filling it, and ligating.
Analysis of the promoter activity was carried out by transfecting the indicated cells lines with the promoter fragments inserted into the pGL3 plasmid and pRTK-Luc (Promega), to normalize transfection efficiency. Firefly (Luc) and Renilla luciferase activities were determined after 48 h as described (11). Luc activity was always normalized by Renilla luciferase activity. Triplicates were systematically included and experiments were repeated at least three times. Statistical analyses were carried out using SPSS software version 14. p values of <0.05 were considered to be significant in each case.
Chromatin Immunoprecipitation (ChIP) Assays
ChIP assays were performed essentially as described (11). 15 × 106 cells were cross-linked with 1% formaldehyde, lysates were prepared in SL buffer (50 mm Tris, pH 8, 2 mm EDTA, 0.1% Nonidet P-40, 10% glycerol) and centrifuged. The supernatant was discarded and the pellet was resuspended in SDS lysis buffer (1% SDS, 10 mm EDTA, 50 mm Tris, pH 8) for 10 min at room temperature. Cell lysates were sonicated to generate fragments of DNA from 200 to 1500 bp. 100 μl of SDS-lysis buffer extract (1 ml total) were diluted 1/10 with IP buffer (0.001% SDS, 1.1% Triton X-100, 16.7 mm Tris, pH 8, 2 mm EDTA, 1.2 mm EDTA, 167 mm NaCl). Immunoprecipitation was carried out with antibodies specific for Twist or Ets1, or mouse IgG (Dako) as a control. Samples were treated with elution buffer (100 mm Na2CO3, 1% SDS) and incubated at 65 °C overnight to reverse formaldehyde cross-linking. Samples were digested with proteinase K and RNase, and DNA was purified using the GFX PCR DNA and Gel Band Purification Kit (Amersham Biosciences). ZEB1 promoter regions were detected by PCR amplification using two pairs of specific primers corresponding to −832/−809 and −714/−693, and −173/−150 and −48/−28, always with respect to the transcription start site.
RESULTS
NMuMG cells have been used as a model of TGF-β-inducible EMT (15). Snail1 protein and RNA (Fig. 1A) were quickly induced upon TGF-β addition to these cells. Snail1 protein was detected 1 h after addition of the cytokine and remained up-regulated for 24 h diminishing afterward. Snail1 RNA presented a similar kinetics when compared with protein levels but with some differences: the maximal stimulation was observed at earlier time points (1 h instead 6 h for the protein) and elevated mRNA levels were observed after 24 h (Fig. 1A, middle and right panels). Zeb1 mRNA and protein were increased at later times; no changes were detected prior to 6 h and protein and RNA remained increased after 72 h (Fig. 1A). To determine the relevance of Snail1 in Zeb1 activation we blocked Snail1 up-regulation using specific shRNAs. As presented in Fig. 1B, Snail1 depletion significantly prevented the synthesis of Zeb1 RNA and protein. Similar results were obtained with a murine Snail1 siRNA that prevented Snail1 and Zeb1 RNA up-regulation at 12 h by 70 and 65%, respectively (not shown). These results suggest that Snail1 up-regulation is required for TGF-β-dependent Zeb1 expression.
FIGURE 1.

Snail1 expression is required for Zeb1 induction by TGF-β in NMuMG cells. Panel A, NMuMG cells were incubated with TGF-β (5 ng/ml) for the indicated times; protein extracts were prepared or RNA was isolated and analyzed by Western blot or qRT-PCR. The left panel shows a representative Western blot of three experiments; the central panel, the average ± S.D. of the results of the densitometric analysis of the results of the three experiments performed. Values are referred to the values obtained at 1 h (Snail1) or 6 h (Zeb1). The right panel presents the average ± S.D. of three independent experiments. Panel B, NMuMG cells, transfected with shRNA specific for Snail1 (mshRNA, see supplemental “Methods”) or a scrambled control were incubated with TGF-β and expression of the indicated genes were analyzed by Western blot or RT-PCR. The figure shows a representative Western blot or the average ± S.D. of three experiments (B). Panel C, NMuMG cells were transfected with pcDNA3-Zeb1 and pcDNA3-Snail1-HA or an empty plasmid when indicated. Cells were also incubated with TGF-β for 24 h previously to the CHX addition. Cell medium was supplemented with CHX to block protein synthesis and protein extracts were prepared after the indicated times and analyzed by Western blot. A 65% inhibition of Zeb1 RNA induction was obtained at 12 h using a murine siRNA against Snail1 instead of the shRNA presented in this figure.
The up-regulation of Zeb1 protein and RNA showed quantitative differences. For instance, whereas Zeb1 protein was considerably stimulated by TGF-β (∼20-fold at 24 h, see Fig. 1A), RNA induction was more modest (only a 3.5-fold increase). Therefore, we checked whether Zeb1 protein expression was controlled at additional levels. First, Zeb1 protein stability was analyzed. As shown in Fig. 1C, decay of ectopically expressed Zeb1 in cycloheximide (CHX)-treated cells was much slower in TGF-β-treated cells than in control NMuMG cells. Three hours after CHX addition very little Zeb1 remained in control cells, whereas in TGF-β-treated cells the levels of this protein were barely affected. A similar slower down-regulation was observed in cells co-transfected with Snail1 when compared with control cells (Fig. 1C). As expected, because Snail1 is a highly unstable protein, its protein levels were quickly down-regulated upon CHX addition. Therefore, these results suggest that Zeb1 up-regulation by Snail1 is not only due to enhanced RNA levels but of also to increased protein stability.
As an alternative to TGF-β, and to validate our conclusions in another cell system, EMT was also induced upon stable Snail1 ectopic transfection in RWP-1 or SW-480 cells. As reported (11, 12), in these cell lines Snail1 caused remarkable changes in the phenotype and also stimulated ZEB1 RNA levels (Fig. 2A) (see also Ref. 10). A similar Zeb1 up-regulation was obtained after ectopic expression of Snail1 in NMuMG cells (Fig. 2A). Conversely, elimination of SNAIL1 RNA in MiaPaca-2 and SW-620 cells, two cell lines with endogenous expression of Snail1 and Zeb1, down-regulated ZEB1 RNA (Fig. 2B), an effect that was accompanied with the acquisition of a more compact phenotype (not shown). These results were confirmed using another shRNA against human Snail1, which down-regulated ZEB1 RNA levels around 45 and 55%, in MiaPaca-2 and SW-620, respectively (not shown).
FIGURE 2.

Snail1 controls Zeb1 mRNA levels. Panels A and B, RNAs were prepared from the indicated cell lines stably transfected with Snail1-HA or infected with a retrovirus expressing human SNAIL1 shRNA (hshRNA1) or scrambled control shRNA. Expression of the indicated genes was determined by qRT-PCR. Values are presented as fold-stimulation by Snail1 with respect to control cells (transfected with the empty plasmid) (A) or as percentage of expression with respect to cells infected with the control shRNA (B). 45 and 55% inhibition of Zeb1 expression was obtained with another human SNAIL1 shRNA (hshRNA2) in MiaPaca-2 and SW-620, respectively. Panel C, activity of the 1004/+29 ZEB1 promoter was determined after transfection of the indicated cell lines stably expressing Snail1-HA or treated with TGF-β for 48 h. Triplicates were systematically included and experiments were repeated at least three times. The figure shows the average ± S.D. of 3–5 experiments. Values obtained for Snail1-expressing cells were different from the corresponding control with a p < 0.01 in RWP1 cells and p < 0.05 in SW-480 and NMuMG cells; differences between NMuMG and TGF-β-treated NMuMG cells were also statistically different (p < 0.05). Panels D and E, RNA was prepared from RWP1, RWP1-Snail1 (D), or NMuMG cells treated 1 or 24 h with TGF-β (E). When indicated, Snail1 expression was inhibited in NMuMG cells using a specific siRNA (msiRNA). Expression of miR-200 was determined as indicated under “Experimental Procedures.” Absence of amplification of DNA was verified as control. Analysis of Pumilio RNA was carried out to determine that equal amounts of RNA were used.
We also determined if Snail1-dependent up-regulation of Zeb1 mRNA was due to increased transcription. For this goal we isolated a 1-kb DNA fragment corresponding to the human promoter. The transcription start site was determined using amplification of 5′ cDNA ends (RACE) and RNA from SW-620 cells, and corresponded to an adenosine placed at −23 with respect to the A of the ATG (supplemental Fig. S1). Consequently, this construct corresponded to −1004/+29 with respect to the transcription start site.
This promoter fragment presented higher activity in Snail1 positive mesenchymal (SW-620, MiaPaca 2) than in epithelial cells (SW-480, RWP-1) (data not shown), mimicking the expression of the ZEB1 transcript. Stable Snail1 transfection up-regulated the activity of this ZEB1 promoter in RWP-1, SW-480, or NMUMG cells (Fig. 2C); a similar increase was observed after a 48-h treatment of NMuMG cells with TGF-β. In most of the cell lines the promoter activity stimulation (2–2.5-fold) was lower than the increase observed in ZEB1 RNA (3.5–4.5-fold, compare panels A and C). Therefore, these results suggest that the mechanism involved in ZEB1 RNA up-regulation only partially involves increased transcription.
It has been reported that Zeb1 expression is controlled by miRNAs of the miR-200 family (14, 16, 17). Therefore, we analyzed if the expression of this miRNA was down-regulated by TGF-β in NMuMG cells or by Snail1 in RWP-1 cells. As shown in Fig. 2, D and E, both factors down-modulated the levels of this RNA. The down-regulation in miR-200 caused by TGF-β was prevented by Snail1 depletion (Fig. 2E), further stressing the role of this factor in Zeb1 control.
Expression of the Twist transcriptional activator has also been related to EMT (18), although the precise mechanism by which Twist represses E-cadherin expression is still unknown. We used RNA interference to determine the relevance of Twist in Zeb1 expression. As shown in Fig. 3A, Twist down-regulation affected Zeb1 expression. Although TWIST1 RNA down-regulation was only partial in RWP-1-Snail1 cells, it was enough to decrease ZEB1 mRNA levels by 80%, as determined by quantitative RT-PCR (Fig. 3A). Similar results were obtained with another TWIST1 shRNA that inhibited ZEB1 expression by 55%. Zeb1 down-regulation by a TWIST1 shRNA was also detected in two other cell lines with constitutive expression of Zeb1, SW-620, and MiaPaca-2. Transfection of these cell lines with a TWIST1 shRNA promoted a severe down-regulation of ZEB1 RNA with respect to the control cells transfected with an irrelevant shRNA (Fig. 3B).
FIGURE 3.

Twist and Snail1 cooperate in Zeb1 expression. 5 μg of TWIST1 hshRNA1 or Non-Target Control Vectors were transfected to RWP-1 Snail1 (panel A), SW-620 or MiaPaca-2 cells (panel B). Transfected cell populations were selected with puromycin (2.5 μg/ml), and analyzed by quantitative (A) or semi-quantitative RT-PCR (B). Similar results were obtained with another TWIST1 shRNA (hshRNA2) in RWP-1 Snail1 cells that inhibited ZEB1 expression by 55%. Panel C, RWP-1 cells were transfected with expression plasmids containing Twist or Snail1 cDNAs; cell populations were selected with G418 and analyzed by RT-PCR for the expression of the indicated genes. Panel D, RWP-1 cells were transiently transfected with the indicated cDNAs and pGL3-ZEB1 promoter. Luciferase activity was determined after 48 h. The figure shows the average ± S.D. of the results (D) or a representative experiment of three performed (A, B, and C).
RWP-1 cells were also transfected with an expression plasmid for TWIST1 cDNA. Levels of ZEB1 RNA were only modestly increased by expression of this cDNA (Fig. 3C). Transfection of Snail1 caused a higher up-regulation of ZEB1, and the simultaneous expression of both genes enhanced this increase, indicating that Snail1 and Twist cooperate on Zeb1 expression (Fig. 3C). A similar effect of Snail1 and Twist on ZEB1 promoter activity was observed when both were transiently expressed in RWP-1 cells indicating that both factors coordinately increase ZEB1 transcription (Fig. 3D).
Twist expression was also analyzed in NMuMG cells upon TGF-β treatment. An up-regulation of the Twist protein was observed 1 h after addition of the cytokine (Fig. 4A). However, increases in Twist1 RNA were only detected after 24 h, with a maximal activation observed at 72 h (Fig. 4B). Both the early stimulation in Twist protein levels and the late activation of RNA expression were dependent on Snail1 because they were repressed in Snail1 shRNA-transfected cells (Fig. 4, A and B). As previously shown (see Fig. 1), Snail1 shRNA prevented Zeb1 protein up-regulation caused by TGF-β. The Twist1 shRNA also affected Zeb1 protein expression although to a lower extent than the Snail1 shRNA, because induction of Zeb1 was observed in these cells although at later times than in control cells (24 h instead of 8 h) (Fig. 4A).
FIGURE 4.

Snail1 and Twist mutually regulate their expression in NMuMG cells. Panels A and B, NMuMG cells expressing scrambled, or shRNAs specific for Snail1 or Twist1 were incubated with TGF-β for the indicated times; protein extracts were prepared or RNA was isolated and analyzed by Western blot (WB) (A) or qRT-PCR (B). Panels C and D, Twist1 RNA (C) and protein (D) were analyzed in RWP-1 or HT-29 M6 cells transfected with Snail1-HA or control plasmid. In panel E, NMuMG cells treated with TGF-β for 24 h when indicated, or RWP1 cells ectopically expressing Snail1 or control plasmid were supplemented with CHX to block protein synthesis. Protein extracts were prepared after the indicated times and analyzed by Western blot. The figure shows representative results (A and D) or the average ± range (B, C, and E) of two experiments performed.
We analyzed whether Snail1 affected Twist expression in other cellular systems. As seen in Fig. 4C, Snail1 transfection did not modify TWIST1 RNA levels in RWP-1 cells or HT-29 M6 cells. Other activators of TWIST1 gene expression, such as TNFα (19) increased mRNA levels about 5-fold (not shown). However, Snail1 expression increased Twist protein levels, as seen in Fig. 4D. The discordance between the up-regulation in Twist protein and RNA by Snail1 demonstrates that Snail1 increases Twist expression by a post-transcriptional mechanism. Accordingly, Twist down-regulation after CHX addition was much slower in TGF-β-treated NMuMG or in RWP-1-Snail1 cells than in their corresponding controls (Fig. 4E). Hence, Snail1 increases Twist protein stability.
Curiously, our results indicate that Twist also affects Snail1 levels, although to a lower extent than Snail1 on Twist expression. As shown in Fig. 4A, ablation of Twist retarded Snail1 protein up-regulation induced by TGF-β. The increase in Snail1 RNA levels were also lower and delayed (Fig. 4B). However, we did not detect enhanced Snail1 protein or RNA when Twist was transfected to RWP-1 or NMUMG cells (data not shown) indicating that Twist is required for the activation of Snail1 expression but not sufficient to induce it.
We further analyzed the mechanism leading to increased ZEB1 transcription by Snail1 and Twist. ChIP experiments indicated that Twist binds to the ZEB1 promoter. The Twist antibody co-immunoprecipitated an amplicon placed 700 bp upstream the transcription start site and not another one corresponding to the proximal promoter (Fig. 5A). The interaction was specific for RWP-1 Snail1 and was not observed in control RWP-1 cells. Binding to the same element was also detected in SW-620 and MiaPaca-2 cells (Fig. 5A). Instead, Snail1 did not associate to this sequence (not shown). Therefore, these ChIP assays demonstrate that Snail1 increases Twist binding to an element placed at −700 in the ZEB1 promoter.
FIGURE 5.

Twist and Ets1 interact with different elements in Zeb1 promoter. Panels A and E, analysis of Twist (A) or Ets1 (E) binding to the indicated elements in the ZEB1 promoter was performed by ChIP as described under “Experimental Procedures.” Panel B, promoter activity of −1004/+29 or −147/+29 DNA fragments was determined as before in SW-620, RWP-1 control, or RWP-1 transfected with Snail1. Differences between Snail1-transfected and Snail1 cells were statistically significant with a p < 0.01 for the −1004/+29 promoter and p < 0.05 for the −147/+29 promoter. The difference between the activity of the two promoters was also significant (p < 0.05) in both cell lines. Panel C, SW-620 or RWP-1 Snail1 cells were transfected with control of ETS1-specific shRNA (hshRNA1). Similar effects were obtained with another ETS1 shRNA (hshRNA2) in SW-620 cells that caused a 70% decrease in ETS1 RNA levels. After selection, RNA was obtained and levels of ETS1 and ZEB1 were determined by qRT-PCR. Panel D, nuclear and cytoslic fractions were prepared from NMuMG treated with TGF-β for the indicated times or RWP-1 control and transfected with Snail1. Levels of the indicated proteins were determined in the nuclear (NMuMG) or nuclear and cytosolic fractions (RWP1 cells). Poly(ADP-ribose) polymerase (PARP)-1 and Lamin B were used as controls for the nuclear fraction; pyruvate kinase (PyrK), for the cytosolic fraction. Results presented in this figure correspond to representative results (panel C) or the average ± S.D. of three experiments.
Snail1 acts on additional elements in the ZEB1 promoter. Although to a lesser extent than the −1004/+29 promoter, Snail1 also stimulated the activity of a −147/+29 DNA fragment (Fig. 5B), suggesting that Snail1 also stimulates another transcriptional activator binding to a more proximal element in this promoter.
It has been reported that Ets1 is required for Zeb1 expression (20). To determine whether Ets1 controls Zeb1 expression, ETS1 RNA levels were down-regulated in RWP1-Snail1 and SW-620 cells. Decreased ETS1 RNA levels were accompanied by a similar down-regulation in ZEB1 RNA (Fig. 5C). In NMuMG cells, Ets1 protein levels were up-regulated in the nuclear fraction upon TGF-β treatment (Fig. 5D), although total levels were not altered (not shown). The up-regulation was detected by 6 h, correlating with the increase in Zeb1 RNA and with the enhanced expression in this fraction of NF-κB and β-catenin, two transcriptional factors involved in transcription of mesenchymal genes (21). Snail1 ectopic expression in RWP-1 cells also stimulated translocation of Ets1 from the cytosol to the nucleus; Ets1 protein levels were up-regulated in the nuclear fraction in RWP-1 Snail1 cells when compared with RWP1 control cells (Fig. 5D).
Finally we analyzed Ets1 interaction with the ZEB1 promoter. ChIP assays indicated that Ets1 also binds to this promoter. However, contrarily to Twist, Ets1 interacted preferentially with the proximal promoter and not with the distal element. As shown (Fig. 5E), the Ets1 antibody immunoprecipitated with greater efficiency the −173/+28 amplicon than the −832/−693 amplicon. Ets1 binding to this sequence was detected in SW-620 cells or upon Snail1 transfection in RWP-1 cells, indicating that Snail1 increases Ets1 translocation to the nucleus and binding to ZEB1 promoter.
DISCUSSION
Zeb1 is a key protein in EMT being responsible for E-cadherin gene silencing in mesenchymal cells. In this report we have studied its regulation in the widely studied EMT model of NMuMG cells treated with TGF-β, and in RWP1 cells that undergo an EMT after Snail1 transfection. As we report, Zeb1 activation in these cellular models is a complex process involving an increase in RNA and stabilization of the protein. The RNA up-regulation is a consequence of both increased transcription and stabilized RNA because TGF-β also decreases the expression of miRNAs of the miR-200 family. These non-coding RNAs, which are specifically expressed by epithelial cells, bind to the ZEB1 3′-UTR and down-regulate the ZEB1 mRNA (16, 17).
Besides the effect on miR-200 expression, Zeb1 expression is controlled transcriptionally, by the coordinated action of Snail1 and Twist transcriptional factors. Twist is a basic helix-loop-helix protein that plays an essential role in gastrulation, mesoderm formation, and neural crest migration and that can behave as transcriptional repressor or activator (22). Expression of Twist is associated to the acquisition of invasive properties in a model of intravasation and metastasis of breast cancer cells to the lung (18). Moreover, ectopic expression of Twist, or induction of this factor by HIF-1α, promotes an EMT characterized by decreased expression of E-cadherin and activation of mesenchymal genes (23). However, the precise mechanism of E-cadherin repression by Twist has not been characterized so far. Although binding of Twist to the CDH1 promoter has been reported (24), for some other authors this association is still controversial (18, 25, 26). Recent results indicate that Twist binds to the CDH1 promoter in a complex with Bmi1, an association that requires PRC2 interaction (27), suggesting that Twist needs the previous action of other repressors on this promoter. In any case, we demonstrate in this article that Twist also participates in the expression of the CDH1 repressor Zeb1, cooperating with Snail1. It is possible that Twist acts on E-cadherin at two levels, binding directly through Bmi1 and also inducing the expression of the potent CDH1 repressor Zeb1.
We demonstrate that Zeb1 expression is dependent on Twist. This result might also be relevant in systems other than EMT. For instance, in mouse Twist inhibits myogenic differentiation (28), an effect also promoted by Zeb1 (29). It would be interesting to determine if the effect of Twist on this process is also dependent on Zeb1 induction.
Our results also present a new perspective of the signaling pathways involved in the activation of mesenchymal genes, such as ZEB1. As depicted in Fig. 6, the regulation is multiple because Zeb1 is controlled both transcriptionally and post-transcriptionally. At the latter, Snail1 and TGF-β: 1) decrease the miR-200 levels, therefore stabilizing ZEB1 RNA, and 2) stabilize Zeb1 protein. Accordingly, this protein presents a higher half-life in NMuMG cells treated with TGF-β or in RWP-1 cells transfected with Snail1 than in their corresponding controls (see Fig. 1). The ubiquitin ligase required for Zeb1 degradation and controlled by Snail1 and TGF-β is still unknown. Moreover, ZEB1 gene transcription is also stimulated upon EMT, an effect that is dependent on the activity of two transcriptional factors, Twist and Ets1. Snail1 stimulates the activity of these two factors in a different fashion because it enhances Twist protein levels, whereas it enables Ets1 translocation to the nucleus. As a consequence, binding of these two proteins to the ZEB1 promoter is increased.
FIGURE 6.
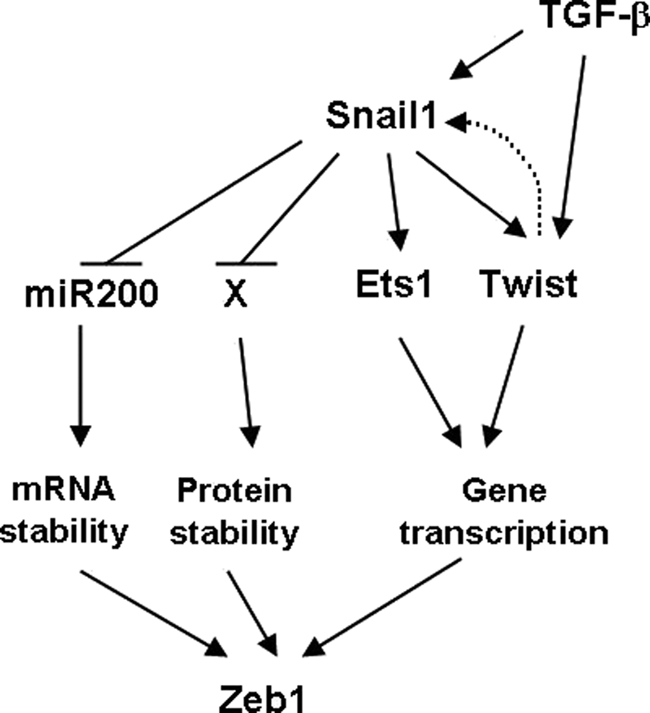
Scheme of the different regulation levels of Zeb1 expression by Snail1 and TGF-β. Up-regulation of Snail1 by TGF-β increases Zeb1 protein acting on different levels: 1) it decreases the expression of miRNA200 that destabilizes Zeb1 RNA; 2) it stimulates Zeb1 protein stability through the inhibition of the function of the still unidentified ubiquitin ligase involved in Zeb1 degradation; and 3) it activates Zeb1 gene transcription. This stimulation is mediated by the activation of two transcriptional factors, Twist and Ets1 that bind to different elements on the Zeb1 promoter. Snail1 also up-regulates Zeb1 transcription at several levels, because it promotes Ets1 translocation to the nucleus, increases Twist protein stability, and is required for the stimulation in Twist1 RNA caused by TGF-β. In addition, full Snail1 up-regulation by TGFβ also requires Twist expression (depicted by a dotted line).
This multiple up-regulation of Zeb1 expression has several possible consequences. One of them is that the precise contribution of the different mechanisms in Zeb1 up-regulation might be cell dependent. Thus, whereas in some cells the effect might be mainly transcriptional and in other cells the down-regulation of miRNA might be predominant.
Our results also show that Snail1 effects on gene expression are not exclusively dependent on up-regulated RNA levels but also to enhanced protein stability. As a result, protein and RNA do not necessarily correlate. For instance, Snail1 is capable to stabilize the Twist protein but is not sufficient to induce TWIST1 RNA, although it is required for up-regulation in this RNA caused by TGF-β in NMuMG cells. Therefore our results add new levels of complexity on the control of these transcriptional factors in EMT, a regulation that has been mainly studied analyzing RNA levels. Because RNA and protein levels do not always correlate, the determination of RNA levels can underestimate the contribution of transcriptional factors in the EMT. For instance, a recent report indicates that Snail1 protein stability is regulated by hypoxia (30), independently on RNA up-regulation.
Moreover, our results suggest that Snail1 and Twist do not show a totally hierarchical but a mutual dependence (Fig. 6). Elimination of Snail1 markedly affects Twist protein levels but also Twist depletion retards Snail1 induction by TGF-β. It is possible that these results explain the discrepant results obtained in different cellular systems where Twist has been placed upstream and downstream of Snail1. In any case, it would be more adequate to visualize the proteins controlling EMT as elements in a network than not in a linear signaling pathway.
Acknowledgment
We thank Dr. Gabriel Gil for providing Twist expression plasmid.
This work was supported in part by Grant SAF2006-00339 from Ministerio de Ciencia y Tecnología, grants from the La Fundación Científica de la Asociación Española contra el Cáncer and La Fundació La Marató de TV3 (081731) (to A. G. H.), Instituto Carlos III-Fondos FEDER (RTICCC, C03710, RD06/0020/0040), and Generalitat de Catalunya Grant 2009SGR867.

The on-line version of this article (available at http://www.jbc.org) contains supplemental “Methods,” Fig. S1, and Table S1.
- EMT
- epithelial-mesenchymal transition
- CHX
- cycloheximide
- qRT
- quantitative reverse transcriptase.
REFERENCES
- 1. Thiery J. P., Sleeman J. P. (2006) Nat. Rev. Mol. Cell Biol. 7, 131–142 [DOI] [PubMed] [Google Scholar]
- 2. Batlle E., Sancho E., Francí C., Domínguez D., Monfar M., Baulida J., García De Herreros A. (2000) Nat. Cell Biol. 2, 84–89 [DOI] [PubMed] [Google Scholar]
- 3. Cano A., Pérez-Moreno M. A., Rodrigo I., Locascio A., Blanco M. J., del Barrio M. G., Portillo F., Nieto M. A. (2000) Nat. Cell Biol. 2, 76–83 [DOI] [PubMed] [Google Scholar]
- 4. Peinado H., Olmeda D., Cano A. (2007) Nat. Rev. Cancer 7, 415–428 [DOI] [PubMed] [Google Scholar]
- 5. Hajra K. M., Chen D. Y., Fearon E. R. (2002) Cancer Res. 62, 1613–1618 [PubMed] [Google Scholar]
- 6. Perez-Moreno M. A., Locascio A., Rodrigo I., Dhondt G., Portillo F., Nieto M. A., Cano A. (2001) J. Biol. Chem. 276, 27424–27431 [DOI] [PubMed] [Google Scholar]
- 7. Grooteclaes M. L., Frisch S. M. (2000) Oncogene 19, 3823–3828 [DOI] [PubMed] [Google Scholar]
- 8. Comijn J., Berx G., Vermassen P., Verschueren K., van Grunsven L., Bruyneel E., Mareel M., Huylebroeck D., van Roy F. (2001) Mol. Cell 7, 1267–1278 [DOI] [PubMed] [Google Scholar]
- 9. Eger A., Aigner K., Sonderegger S., Dampier B., Oehler S., Schreiber M., Berx G., Cano A., Beug H., Foisner R. (2005) Oncogene 24, 2375–2385 [DOI] [PubMed] [Google Scholar]
- 10. Guaita S., Puig I., Franci C., Garrido M., Dominguez D., Batlle E., Sancho E., Dedhar S., de Herreros A. G., Baulida J. (2002) J. Biol. Chem. 277, 39209–39216 [DOI] [PubMed] [Google Scholar]
- 11. Peiró S., Escrivà M., Puig I., Barberà M. J., Dave N., Herranz N., Larriba M. J., Takkunen M., Francí C., Muñoz A., Virtanen I., Baulida J., García de Herreros A. (2006) Nucleic Acids Res. 34, 2077–2084 [DOI] [PMC free article] [PubMed] [Google Scholar]
- 12. Pálmer H. G., Larriba M. J., García J. M., Ordóñez-Morán P., Peña C., Peiró S., Puig I., Rodríguez R., de la Fuente R., Bernad A., Pollán M., Bonilla F., Gamallo C., de Herreros A. G., Muñoz A. (2004) Nat. Med. 10, 917–919 [DOI] [PubMed] [Google Scholar]
- 13. Francí C., Takkunen M., Dave N., Alameda F., Gómez S., Rodríguez R., Escrivà M., Montserrat-Sentís B., Baró T., Garrido M., Bonilla F., Virtanen I., García de Herreros A. (2006) Oncogene 25, 5134–5144 [DOI] [PubMed] [Google Scholar]
- 14. Bracken C. P., Gregory P. A., Kolesnikoff N., Bert A. G., Wang J., Shannon M. F., Goodall G. J. (2008) Cancer Res. 68, 7846–7854 [DOI] [PubMed] [Google Scholar]
- 15. Miettinen P. J., Ebner R., Lopez A. R., Derynck R. (1994) J. Cell Biol. 127, 2021–2036 [DOI] [PMC free article] [PubMed] [Google Scholar]
- 16. Gregory P. A., Bert A. G., Paterson E. L., Barry S. C., Tsykin A., Farshid G., Vadas M. A., Khew-Goodall Y., Goodall G. J. (2008) Nat. Cell Biol. 10, 593–601 [DOI] [PubMed] [Google Scholar]
- 17. Park S. M., Gaur A. B., Lengyel E., Peter M. E. (2008) Genes Dev. 22, 894–907 [DOI] [PMC free article] [PubMed] [Google Scholar]
- 18. Yang J., Mani S. A., Donaher J. L., Ramaswamy S., Itzykson R. A., Come C., Savagner P., Gitelman I., Richardson A., Weinberg R. A. (2004) Cell 117, 927–939 [DOI] [PubMed] [Google Scholar]
- 19. Pham C. G., Bubici C., Zazzeroni F., Knabb J. R., Papa S., Kuntzen C., Franzoso G. (2007) Mol. Cell. Biol. 27, 3920–3935 [DOI] [PMC free article] [PubMed] [Google Scholar]
- 20. Shirakihara T., Saitoh M., Miyazono K. (2007) Mol. Biol. Cell 18, 3533–3544 [DOI] [PMC free article] [PubMed] [Google Scholar]
- 21. Solanas G., Porta-de-la-Riva M., Agustí C., Casagolda D., Sánchez-Aguilera F., Larriba M. J., Pons F., Peiró S., Escrivà M., Muñoz A., Duñach M., de Herreros A. G., Baulida J. (2008) J. Cell Sci. 121, 2224–2234 [DOI] [PubMed] [Google Scholar]
- 22. Ansieau S., Morel A. P., Hinkal G., Bastid J., Puisieux A. (2010) Oncogene 29, 3173–3184 [DOI] [PubMed] [Google Scholar]
- 23. Yang M. H., Wu M. Z., Chiou S. H., Chen P. M., Chang S. Y., Liu C. J., Teng S. C., Wu K. J. (2008) Nat. Cell Biol. 10, 295–305 [DOI] [PubMed] [Google Scholar]
- 24. Vesuna F., van Diest P., Chen J. H., Raman V. (2008) Biochem. Biophys. Res. Commun. 367, 235–241 [DOI] [PMC free article] [PubMed] [Google Scholar]
- 25. Yang J., Weinberg R. A. (2008) Dev. Cell 14, 818–829 [DOI] [PubMed] [Google Scholar]
- 26. Foubert E., De Craene B., Berx G. (2010) Breast Cancer Res. 12, 206–216 [DOI] [PMC free article] [PubMed] [Google Scholar]
- 27. Yang M. H., Hsu D. S., Wang H. W., Wang H. J., Lan H. Y., Yang W. H., Huang C. H., Kao S. Y., Tzeng C. H., Tai S. K., Chang S. Y., Lee O. K., Wu K. J. (2010) Nat. Cell. Biol. 12, 982–992 [DOI] [PubMed] [Google Scholar]
- 28. Hebrok M., Wertz K., Füchtbauer E. M. (1994) Dev. Biol. 165, 537–544 [DOI] [PubMed] [Google Scholar]
- 29. Postigo A. A., Dean D. C. (1997) EMBO J. 16, 3935–3943 [DOI] [PMC free article] [PubMed] [Google Scholar]
- 30. Viñas-Castells R., Beltran M., Valls G., Gómez I., García J. M., Montserrat-Sentís B., Baulida J., Bonilla F., de Herreros A. G., Díaz V. M. (2010) J. Biol. Chem. 285, 3794–3805 [DOI] [PMC free article] [PubMed] [Google Scholar]