Abstract
Signaling through cAMP regulates most cellular functions. The spatiotemporal control of cAMP is, therefore, crucial for differential regulation of specific cellular targets. Here we investigated the consequences of PDE4B or PDE4D gene ablation on cAMP signaling at a subcellular level using mouse embryonic fibroblasts. PDE4B ablation had no effect on the global or bulk cytosol accumulation of cAMP but increased both basal and hormone-dependent cAMP in a near-membrane pool. Conversely, PDE4D ablation enhanced agonist-induced cAMP accumulation in the bulk cytosol as well as at the plasma membrane. Both PDE4B and PDE4D ablation significantly modified the time course and the level of isoproterenol-induced phosphorylation of vasodilator-stimulated phosphoprotein, a membrane cytoskeletal component. A second membrane response through Toll-like receptor signaling, however, was only affected by PDE4B ablation. PDE4D but not PDE4B ablation significantly prolonged cAMP-response element-binding protein-mediated transcription. These findings demonstrate that PDE4D and PDE4B have specialized functions in mouse embryonic fibroblasts with PDE4B controlling cAMP in a discrete subdomain near the plasma membrane.
Keywords: Adrenergic Receptor, Calcium Imaging, Cyclic AMP (cAMP), Fluorescence Resonance Energy Transfer (FRET), Phosphodiesterases, Prostaglandins, Exchange Protein Directly Activated by cAMP
Introduction
Cyclic adenosine monophosphate (cAMP) is a ubiquitous second messenger that plays a key role in the regulation of most cellular functions via the activation of one of three effectors: cAMP-dependent PKA,2 cyclic nucleotide-gated (CNG) ion channels, and GTP exchange proteins directly activated by cAMP (Epacs). Given the broad range of external cues and responses, cAMP signals are highly regulated in intensity, duration, and intracellular distribution. Several mechanisms have been proposed that may act in concert to affect cAMP compartmentalization, including physical barriers such as the endoplasmic reticulum (1) or plasma membrane, buffering by binding to PKA (2, 3), or an enzymatic boundary due to phosphodiesterase (PDE) activity (4–7). PDEs, the enzymes that degrade cyclic nucleotides, form an integral part of signal desensitization and have emerged as a major component contributing to signal specificity (for a review, see Ref. 8). Specific patterns of localization suggest that PDE isoenzymes do not have access to all cAMP produced in a cell. PDEs are classified into 11 families based on sequence homology, substrate specificity, and inhibitor sensitivity. PDE4s, characterized by their sensitivity to the inhibitor rolipram, are widely expressed and are a major component of cAMP hydrolytic activity in many cells (9). Four PDE4 genes, Pde4a, Pde4b, Pde4c, and Pde4d, are expressed in mammals, and alternative splicing and the use of multiple promoters account for different PDE4 variants (10, 11), which are composed of a highly conserved catalytic domain flanked by domains with variant-specific regulatory functions. The coexpression of multiple variants of PDE allows the cell to selectively control cAMP levels in response to a specific signal. PDE4s have been shown to form protein-protein and protein-lipid interactions that contribute to a unique subcellular distribution (9, 12).
Ablation of three of the four PDE4 genes (Pde4a, Pde4b, and Pde4d) in mice results in distinct phenotypes (13, 14). PDE4D−/− mice display a broad spectrum of pleiotropic phenotypes, including delayed growth, reduced viability, and impaired female fertility (14), whereas PDE4B-null mice display a deficit in tumor necrosis factor-α (TNFα) production and defects in inflammatory cell responses (13). Knockdown of PDE4D and PDE4B in cell lines with siRNAs has identified specific functions for PDE4D splicing variants, but no effect of PDE4B ablation was detected (15–17). Despite the specific phenotypes of the PDE4D and PDE4B ablation, the control of cAMP accumulation by these isoforms at a subcellular level remains unclear.
Here, we used an in vitro model of selective PDE4 gene ablation to investigate how two different PDEs expressed in the same cell affect cAMP signaling. Several different approaches were used to assess the properties of the cAMP responses in these cells. Global cyclic AMP concentration was measured by radioimmunoassay (RIA), and subcellular pools were measured by using FRET-based cytosolic Epac2 (cytEpac2) (18), plasma membrane-targeted Epac2 (pmEpac2) sensor (19), and the modified CNG channel (1). Additionally, we investigated how ablation of PDE4B or PDE4D affects several key downstream targets of cAMP signaling that are localized to the plasma membrane or within the cytosolic compartments. Our findings demonstrate that PDE4B functions in a confined compartment near the plasma membrane, and this local effect is not reflected in significant changes of global cAMP levels.
EXPERIMENTAL PROCEDURES
Reagents
Dulbecco's modified Eagle's medium (catalogue number 11965); fetal bovine serum; penicillin/streptomycin stock solution; 0.25% trypsin, EDTA solution; and l-glutamine were obtained from Invitrogen. Cyclic AMP, (±)-isoproterenol (1-(3′,4′-dihydroxyphenyl)-2-isopropylaminoethanol hemisulfate salt), rolipram (4-[3-(cyclopentyloxy)-4-methoxyphenyl]-2-pyrrolidinone), Polybrene, and 3-isobutyl-1-methylxanthine (IBMX) were purchased from Sigma. The PKA inhibitor H89 (N-[2-(p-bromocinnamylamino)ethyl]-5-isoquinolinesulfonamide dihydrochloride) was from Calbiochem (EMD Chemicals). Prostaglandin E2 was from Cayman Chemicals (Ann Arbor, MI). 125I-cAMP was from PerkinElmer Life Sciences, and anti-cAMP was from the National Hormone and Peptide Program, National Institute of Diabetes and Digestive and Kidney Diseases and Dr. A. F. Parlow. The Bright-Glo Luciferase Assay System was from Promega (Madison, WI).
Generation of MEF Cell Lines
The generation of mice deficient in PDE4B and PDE4D has been described previously (13, 14, 20). Briefly, the PDE4-null alleles were transferred to a pure C57Bl/6 background by backcrossing heterozygous mice of mixed C57Bl/6-129/Ola background over 13 generations. To derive MEF cells, embryos were retrieved from pregnant females 13.5 days postcoitum. The brain and internal organs of the embryos were removed, and the remaining carcasses were minced and incubated with 0.25% trypsin, EDTA for 10 min at 37 °C. Complete medium (consisting of Dulbecco's modified Eagle's medium supplemented with 10% fetal bovine serum, 5 mm l-glutamine, 30 μg/ml penicillin, and 100 μg/ml streptomycin) was added to the cell suspensions, cells were disaggregated, and tissue clumps were allowed to settle to the bottom of the tube. The remaining cell suspensions were then transferred onto cell culture dishes. Fibroblasts were grown at 37 °C under a 5% CO2 atmosphere to confluence. Cells were replated, grown to 80–90% confluence, and frozen in liquid nitrogen.
Adenoviral Constructs
Plasma membrane-localized pmEpac2 (19) and the cytosolic cytEpac2 (18) were cloned into the ViraPower Adenoviral Expression System (Invitrogen) according to the manufacturer's protocol. The adenovirus construct containing the modified olfactory CNGA2 channel (C460W/E583M) was obtained from Dr. T. C. Rich (Department of Pharmacology, University of South Alabama, Mobile, AL) (21). Large scale virus stocks generated in HEK293 cells were purified using two consecutive cesium chloride gradients, dialyzed overnight at 4 °C in formulation buffer (2.5% glycerol, 25 mm NaCl, 20 mm Tris/HCl, pH 8.0) using a Slide-A-Lyzer dialysis cassette (Thermo Scientific), and titered using the Adenoviral Rapid Titer kit (Clontech). Viral titers were as follows: 1.5 × 10¹¹ pfu/ml for pmEpac2, 2 × 10¹⁰ pfu/ml for cytEpac2, and 2.5 × 10¹¹ pfu/ml for CNGA2 C460W/E583M channel.
Measurement of Global cAMP Accumulation
MEFs were plated into 6-well culture dishes at a density of 2 × 10⁵ cells/well. After overnight culture, cells were serum-starved in Dulbecco's modified Eagle's medium supplemented with 5 mm l-glutamine, 30 μg/ml penicillin, 100 μg/ml streptomycin, and 25 mm HEPES for 16 h before cell treatment and harvest. After the appropriate treatment, the cell culture medium was aspirated, and the reactions were terminated by addition of 0.8 ml of 95% ice-cold ethanol containing 0.1% trichloroacetic acid (TCA) to each well. After a 30-min incubation of the plates on ice, the TCA solution containing cAMP was collected. The cells, which remained on the culture plates, were dissolved in 300 μl of 1 n NaOH/well and used for determination of protein content by the method of Lowry et al. (22) with bovine serum albumin as the standard. The cAMP-containing TCA solutions were dried in a spin vacuum and reconstituted in 500 μl of PBS, and cAMP concentrations were determined by RIA as described previously (23).
Adenoviral Transduction of MEFs
MEFs were infected while in suspension with the cytEpac2, pmEpac2, and CNGA2 (C460W/E583M) channel adenovirus constructs at a multiplicity of infection of 500 and plated at a density of 3 × 10⁵ cells/well onto 6-well culture plates containing Matrigel-coated (BD Biosciences) 25-mm glass coverslips. After 8 h of culture, cells were serum-starved in Dulbecco's modified Eagle's medium supplemented with 5 mm l-glutamine, 30 μg/ml penicillin, 100 μg/ml streptomycin, and 25 mm HEPES for 16 h prior to imaging experiments.
Epac cAMP FRET Measurements
Coverslips were placed in 300 μl of oxygenated Locke's medium (154 mm NaCl, 5.6 mm KCl, 2.2 mm CaCl2, 1 mm MgCl2, 6 mm NaHCO3, 10 mm glucose, 2 mm HEPES) containing 0.05% BSA in a temperature-controlled (37 °C), modified Sykes-Moore Chamber mounted on a Nikon TE2000 inverted fluorescence microscope. Cells were imaged under a 100× epifluorescence objective using a xenon light source (Lambda LS, Sutter Instrument Co., Novato, CA). Images were captured on a Hamamatsu Firewire Orca-ER digital camera (Hamamatsu Photonics, Hamamatsu, Japan). CFP (donor) fluorescence was viewed by exciting at 430–455 nm, and cyan fluorescence was measured at 470–490 nm. YFP (acceptor) fluorescence was viewed by exciting at 500–520 nm, and yellow fluorescence was measured at 535–565 nm. FRET was viewed by exciting at 430–455 nm (donor excitation) and measuring fluorescence at 535–565 nm (acceptor emission). Bleed-through contributions of the YFP to the donor (CFP) and FRET channels were determined from cells expressing only YFP plasmid. These bleed-through values are constants of 0.14 and 4.6%, respectively, of the amount of fluorescence in the acceptor channel. These constants depend on the physical properties of the fluorophore and the collection parameters, which remained constant throughout the study. Similarly, CFP only-expressing cells were used to quantify fluorescence that CFP emits into the FRET (62%) and acceptor channels (0.5%). Background and bleed-through were subtracted from FRET images pixel by pixel to obtain corrected FRET images using MetaMorph software. Average FRET intensity was measured directly in the corrected FRET images, and the decrease in FRET as a percentage of basal (%ΔF) was calculated.
Membrane cAMP Measurements Using Modified CNGA2 Channel
Intracellular Ca2+ concentration was measured using fluorescence ratio imaging with MetaFluor Imaging Software (Molecular Devices). MEFs were loaded with fura-2 (Invitrogen) by incubation in 5 μm fura-2/AM for 1 h at 37 °C in oxygenated Locke's medium supplemented with 0.05% BSA. The cells were then washed in fresh Locke's medium for 10 min. Coverslips were placed in a temperature-controlled modified Sykes-Moore chamber and imaged on a Nikon TE2000 microscope as described above. Cells were imaged under a 10× epifluorescence objective. Fura-2 fluorescence emission at 510 nm was measured using a wide band emission filter (510 ± 80 nm) (Chroma Technology Corp.) at 10-s intervals at excitation settings of 340 and 380 nm. The ratio of the emissions between 340-nm excitation and 380-nm excitation was calculated using MetaFluor software. Approximately 40–60 cells were imaged per coverslip. The intracellular Ca2+ concentration was estimated from the ratio of the fluorescence intensities and comparison with Ca2+ standards using the fura-2 Ca2+ calibration kit (Invitrogen).
TNFα Accumulation
MEFs plated in 96-well plates were cultured to 80–90% confluence and treated with 200 ng/ml LPS. The medium was assayed for levels of TNFα measured with a commercially available ELISA kit (eBioscience Inc., San Diego, CA). The sensitivity of the assay was 19.5 pg/ml. For protein extraction, MEFs plated in 6-well plates were harvested in radioimmune precipitation assay lysis buffer (25 mm Tris-HCl, pH 7.5, 150 mm NaCl, 1% Nonidet P-40, 0.1% SDS, 1 mm DTT, 10% glycerol containing 1× protease inhibitor mixture (Roche Diagnostics). Rabbit anti-PDE4B monoclonal antibody (1:1500) was used for Western blot analysis.
CRE-Luciferase Assays
6xCRE-Luc-GFP-pLL3.7 (a gift from Pfizer, New York, NY) packaged in lentivirus with a titer of 6.35 × 10⁷ inclusion-forming units/ml was transduced in MEFs (50,000 cells/well in 24-well plates) at a multiplicity of infection of 7.4. Cells were rinsed and serum-starved on the 3rd day and 24 h later were stimulated with 10 μm isoproterenol (Iso). The next day, cells were rinsed once with PBS, and 100 μl of Glo Lysis buffer (Promega) was added to each well. After 15 min, cells were scraped, transferred to Eppendorf microcentrifuge tubes, and stored at −20 °C. Luciferase activity was measured for 15 s on a Monolight 1500 luminometer (Analytical Luminescent Laboratory Inc., San Diego, CA) by adding 50 μl of Bright-Glo Luciferase Assay Substrate (Promega) to 50 μl of sample. Samples were normalized by measuring GFP activity. Experiments were performed in triplicate, and data represent the average of two separate experiments.
Western Blots
MEFs were plated onto 10-cm culture plates, cultured 24 h to 80–90% confluence, and then serum-starved overnight in Dulbecco's modified Eagle's medium supplemented with 5 mm l-glutamine, 30 μg/ml penicillin, 100 μg/ml streptomycin, and 25 mm HEPES. Cells were treated with 100 nm Iso and lysed in 50 mm Tris/HCl, pH 7.4 containing 150 mm NaCl, 5% glycerol, 1 mm EDTA, 0.2 mm EGTA, 1.4 mm β-mercaptoethanol, 0.5% Triton X-100, phosphatase inhibitors (10 mm NaF, 10 μm Na4P2O7, 1 mm Na3VO4, and 1 μg/ml microcystin), and complete protease inhibitor tablets (Roche Diagnostics) as described previously (24). Protein yield was determined by BCA assay (Thermo Scientific). Ten micrograms of protein in Laemmli sample buffer was resolved by SDS-PAGE and transferred to a PVDF membrane (Immobilon-P, Millipore). The immunoblots were probed for VASP phosphorylation (Ser-157) (1:1000; Cell Signaling Technology Inc.) and tubulin (1:100,000; Sigma) in TBS-T (10 mm Tris, pH 7.4, 150 mm NaCl, 0.2% Tween 20) containing 0.16% nonfat milk powder. Immunoreactive proteins were visualized with the ECL Plus Western Blotting Detection System (Amersham Biosciences, GE Healthcare). Band intensity was quantified and normalized for loading using Adobe Photoshop.
Immunofluoresence
MEFs (70,000 cells/well) were cultured overnight on Matrigel-coated 18-mm glass coverslips in 12-well plates. Cells were washed three times in PBS and fixed with 2% paraformaldehyde for 15 min. Cells were then washed three times with PBS, permeabilized with 0.5% Triton X-100, washed again with PBS, and then blocked for 1 h in 10% serum in PBS. Cells were then incubated at room temperature with anti-PDE4B, anti-PDE4D (ICOS), anti-calreticulin (Cell Signaling Technology Inc.), anti-syntaxin (Cell Signaling Technology Inc.), and/or phalloidin (Invitrogen). Staining was detected with FITC-conjugated anti-rabbit IgG and anti-mouse Cy3 (Jackson ImmunoResearch Laboratories, West Grove, PA). Nuclei were stained with Hoescht 33342 dye (5 μg/ml) (Invitrogen). Cells were imaged using a Zeiss Apotome Imager M2 with a 63× oil immersion objective, and images were acquired using Axioimager.
Data Analysis
Experimental data of cAMP accumulation were fitted with single or exponential decay equations using the GraphPad Prism program (GraphPad Inc.). Statistical significance was determined with Student's t test or analysis of variance as indicated using the Prism software.
RESULTS
Properties of Epac2 cAMP Biosensors
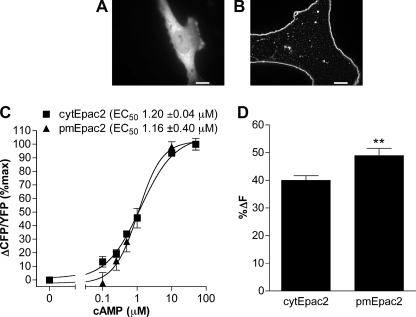
To characterize cAMP accumulation at the subcellular level, we made use of the previously characterized cytosolic and plasma membrane-localized unimolecular Epac2 cAMP biosensors (18, 19). The plasma membrane-localized Epac2 sensor (pmEpac2) was constructed by adding the SH4 motif of Lyn kinase, which is post-translationally modified with myristate and palmitate, leading to localization at the plasma membrane (25, 26). In MEFs, cytEpac2 showed homogenous distribution throughout the cytoplasm (Fig. 1A), whereas the pmEpac2 (Fig. 1B) was localized at the plasma membrane. Cell-free characterization of both constructs overexpressed in HEK293 cells revealed similar EC50 values (cytEpac2, 1.20 ± 0.04 μm; pmEpac2, 1.16 ± 0.40 μm) (Fig. 1C). Decreases in intramolecular FRET caused by conformational changes induced by cAMP binding were measured and expressed as a percent change relative to untreated cells (%ΔF) to normalize for differences in sensor expression. In intact cells treated with saturating concentrations of IBMX and forskolin, the membrane Epac2 sensor showed a larger maximal change in FRET (Fig. 1D). The ratio of FRET to CFP level (R0; FRET/CFP) showed no correlation to increasing amounts of the biosensor (YFP), suggesting no concentration dependence or overcrowding effects leading to intermolecular FRET for either biosensor (supplemental Fig. S1).
FIGURE 1.
Characterization of Epac2 cAMP sensors. A and B, WT MEFs were transduced with adenoviral constructs encoding either cytEpac2 (A) or pmEpac2 (B). Scale bar, 10 μm. C, in vitro dose-response curves of Epac2 sensors expressed in HEK293 cells. Changes in FRET (ΔCFP/YFP) responses to cAMP were measured using a SpectraMax fluorometer. Data represent the mean ± S.E., and normalized data were analyzed using sigmoidal dose response (variable slope) (n ≥ 9). D, WT MEFs transduced with cytEpac2 or pmEpac2 were incubated with IBMX (100 μm) and forskolin (50 μm), and the maximum decrease in FRET was calculated. Data represent mean ± S.E. from four or more experiments. Error bars, S.E.; **, p < 0.01.
Iso-stimulated Global and Cytosolic cAMP Accumulation Is Regulated by PDE4D but Not PDE4B
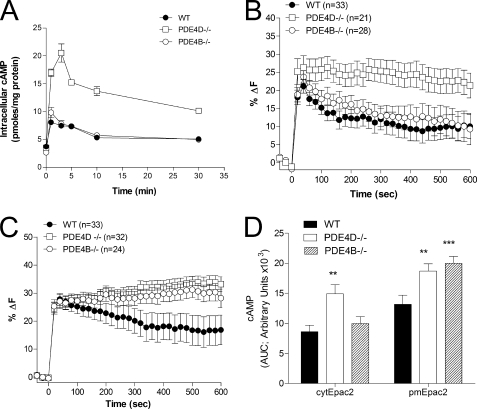
We have shown previously that MEFs deficient in PDE4D but not PDE4B display a major increase in global cAMP levels measured by RIA in response to 10 μm Iso (24). To investigate further the individual contributions of PDE4D and PDE4B, we measured cAMP accumulation in response to submaximal doses of Iso (10 nm), thereby increasing the differential cAMP accumulation in localized subcellular compartments. Even under these conditions of reduced stimulation, PDE4D but not PDE4B ablation caused a significant increase in global cAMP accumulation (Fig. 2A). Similarly, cytosolic cAMP measured with the cytEpac2 sensor showed an increase in cAMP in response to 10 nm Iso stimulation in the PDE4D-null MEFs, whereas the ablation of PDE4B had no detectable effect on cytosolic cAMP (Fig. 2, B and D).
FIGURE 2.
cAMP accumulation in wild type and PDE4 KO MEFs stimulated with Iso. A, MEFs deficient in PDE4B or PDE4D as well as wild type controls were incubated for the indicated times with 10 nm Iso. The cell culture medium was then aspirated, and incubations were terminated by the addition of 0.1% TCA in 95% ethanol. Cyclic AMP concentration in the resulting extracts was measured by RIA. B and C, MEFs transduced with cytEpac2 (B) or pmEpac2 (C) were incubated for the indicated times with 10 nm Iso. The percent decrease in FRET relative to basal (%ΔF) was determined. D, the cAMP response to 10 nm Iso treatment for MEFs expressing either cytEpac2 or pmEpac2 expressed as the area under the curve (AUC). Data were analyzed using the unpaired t test; **, p < 0.01; ***, p < 0.0001. Data represent mean ± S.E. In B and C, the number of cells analyzed (n) is given and summarizes data from four or more experiments. Error bars, S.E.
Iso-stimulated Plasma Membrane-localized cAMP Accumulation Is Controlled by Both PDE4D and PDE4B
To further characterize the effect of PDE4D and PDE4B ablation at a subcellular level, cAMP accumulation in the vicinity of the plasma membrane was measured using the pmEpac2 sensor (19). In agreement with the global and cytosolic cAMP measurements (Fig. 2, A, B, and D), ablation of PDE4D caused an increase in maximal cAMP accumulation measured at the plasma membrane (Fig. 2C). In contrast to global and cytosolic cAMP accumulation, however, PDE4B ablation also increased the maximal cAMP accumulation associated with the plasma membrane (Fig. 2, C and D). Under these latter conditions, the pmEpac2 sensor is not saturated because rolipram caused a further increase in the signal (supplemental Fig. S2).
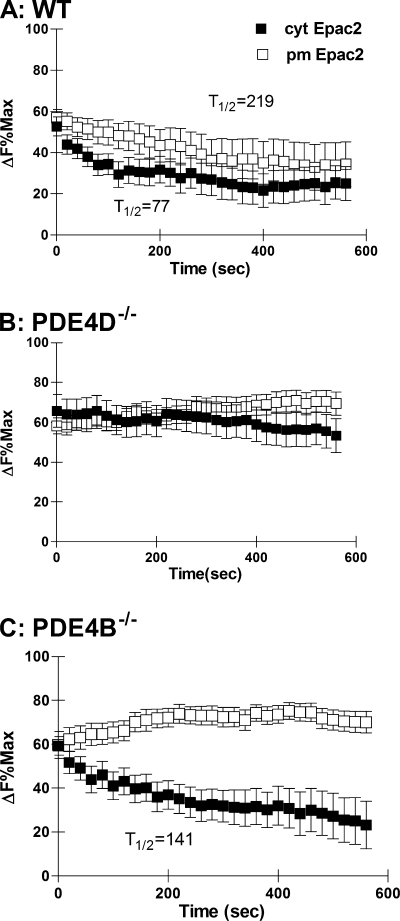
Substantial heterogeneity in the responses of individual cells was observed: some cells, termed desensitizing cells, displayed a rapid decrease in cAMP, whereas others had sustained elevated levels (see supplemental Fig. S3). With the cytosolic probe, 57.6% of the WT MEFs were desensitized with a 50% or greater reduction in cAMP levels compared with 31.8% near the plasma membrane (supplemental Table S1). In WT MEFs, the half-time to return from maximum cAMP accumulation to a new steady state level of cAMP was faster in the cytosol than in the membrane (Fig. 3A). This suggests that following stimulation of the β2-adrenergic receptor the cyclic AMP signal in the cytosol is more quickly dissipated than the response at the plasma membrane. When the data are plotted as a percentage of the maximal response for each sensor, no difference in the maximal cAMP accumulation between the plasma membrane and the cytosol was detected (Fig. 3A). The proportion of desensitized cells was affected by the genotype. In the PDE4D-null MEFs, only 23.8 and 11% of the cells were desensitized in the cytosol and plasma membrane, respectively (Table S1). The half-time to reach a new steady state cAMP level in the cytosol was delayed (Fig. 3B). Similar to the WT MEFs, 46.4% of the PDE4B deficient cells displayed a desensitizing behavior (supplemental Table S1) in the cytosol with a half-time to reach a new steady state of 141 s (Fig. 3C). At the plasma membrane, however, only 8.3% of the cells showed a significant cAMP decrease, and no rate of decay could be measured.
FIGURE 3.
Decay of cAMP response following Iso stimulation. A, B, and C, WT (A) and MEFs deficient in PDE4D (B) or PDE4B (C) expressing either cytEpac2 (■) or pmEpac2 (□) were incubated with 10 nm Iso. Data are expressed as a percentage of the maximum response for cytEpac2 and pmEpac2 in cells treated with IBMX and forskolin (see Fig. 1C). Where possible, the half-time (t½) to return to a new steady state level of cAMP concentration was calculated using exponential decay analysis from the maximal Iso response. Error bars, S.E.
Prostaglandin-induced Accumulation of Cytosolic and Plasma Membrane-localized cAMP
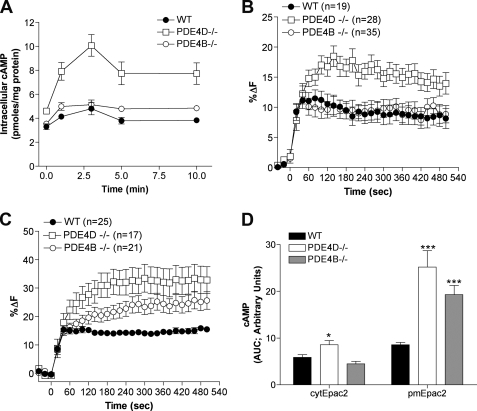
To determine whether the differential effects of PDE4D and PDE4B ablation in the two compartments are a receptor-specific phenomenon, we measured the cAMP accumulation in response to stimulation with 100 nm prostaglandin E2 (PGE2). Similar to β-adrenergic receptor stimulation, PGE2-dependent global and cytosolic cAMP accumulation was affected in PDE4D−/− MEFs but not in PDE4B−/− MEFs (Fig. 4, A, B, and D). Cyclic AMP accumulation associated with the plasma membrane, however, was affected by the ablation of both PDE4D and PDE4B (Fig. 4, C and D). Unlike the Iso response, which was transient during the 10-min time course, little desensitization was observed following stimulation with 100 nm PGE2.
FIGURE 4.
cAMP levels in PDE4B- and PDE4D-null MEFs stimulated with 100 nm PGE2. A, cells were incubated for the indicated times with 100 nm PGE2, and cAMP concentration in the cell extracts was measured by RIA. The graph reports the mean ± S.E. of three separate experiments. B and C, MEFs transduced with cytEpac2 (B) or pmEpac2 (C) were incubated for the indicated times with 100 nm PGE2, and the percent change in FRET (%ΔF) was calculated. In each case, the cell number (n) is given. D, the cAMP response to 100 nm PGE2 treatment for MEFs expressing either cytEpac2 or pmEpac2 expressed as the area under the curve (AUC). Data were analyzed using the unpaired t test; ***, p < 0.0001 (WT versus PDE4B−/− and PDE4D−/−; pmEpac2); *, p = 0.0113 (WT versus PDE4D−/−; cytEpac2) and p = 0.604 (WT versus PDE4B−/−; cytEpac2). Data represent mean ± S.E. Error bars, S.E.
Probing cAMP Levels at Plasma Membrane with Modified CNG Channel Confirms pmEpac2 Measurements
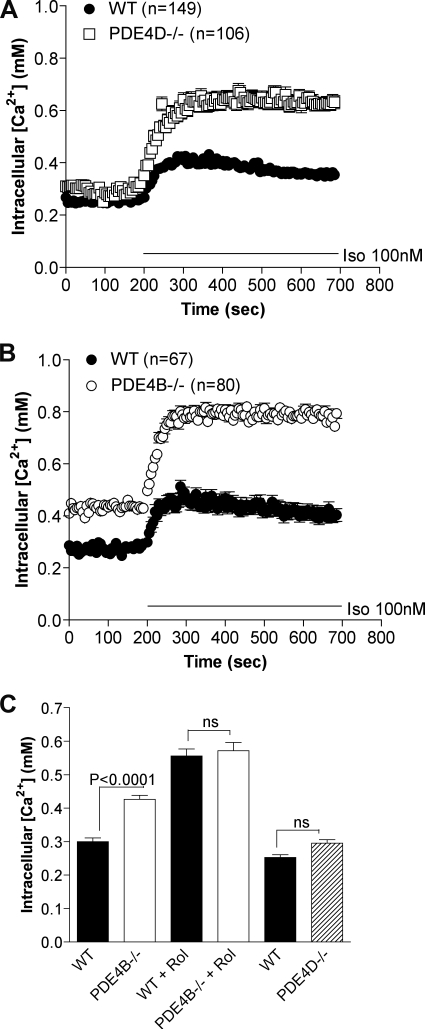
To confirm the local effect of PDE4 ablation in response to β2-adrenergic receptor signaling by an independent method, we infected MEFs deficient in PDE4D and PDE4B as well as matched wild type cells with an adenovirus encoding a modified olfactory CNG channel (CNGA2 C460W/E583M) biosensor (1). This channel is localized in the plasma membrane, and Ca2+ conductance increases in response to cAMP binding. Influx of Ca2+, therefore, reflects plasma membrane-associated cAMP concentration. MEFs deficient in PDE4B or PDE4D showed a 1.8- and 2-fold increase, respectively, in Ca2+ accumulation following treatment with 100 nm Iso compared with a 1.3-fold increase in WT MEFs (Fig. 5, A and B). Assuming that Ca2+ levels track cAMP changes under all conditions, a significant increase in basal cAMP (p < 0.0001) was detected in the plasma membrane compartment in MEFs deficient in PDE4B compared with WT MEFs (Fig. 5, B and C). The response measured with 10 μm rolipram was identical in WT and PDE4B−/− MEFs (Fig. 5C), excluding differences in steps in the cAMP cascade other than PDE activity in the two cell types.
FIGURE 5.
PDE4B and PDE4D control a pool of cAMP in vicinity of CNG channels. Calcium influx in MEFs expressing the modified olfactory CNG channel (C460W/E583M) was measured to determine the effect of PDE4 variant ablation on cAMP accumulation in response to 100 nm Iso treatment. Intracellular calcium ([Ca2+]i) concentration was measured by ratiometric fura-2 fluorescence and is proportional to the local concentration of cAMP. A and B, knock-out of either PDE4D (A) or PDE4B (B) caused an increase in the membrane-associated cAMP accumulation in response to Iso stimulation. The number of individual cells analyzed (n) is given for each MEF cell culture. C, cells were untreated for basal measurements or treated with rolipram (Rol) (10 μm) for 15 min. The graphs report the mean ± S.E. of at least four separate experiments. Error bars, S.E.
Increased Plasma Membrane-associated Basal cAMP Levels in PDE4B-null MEFs
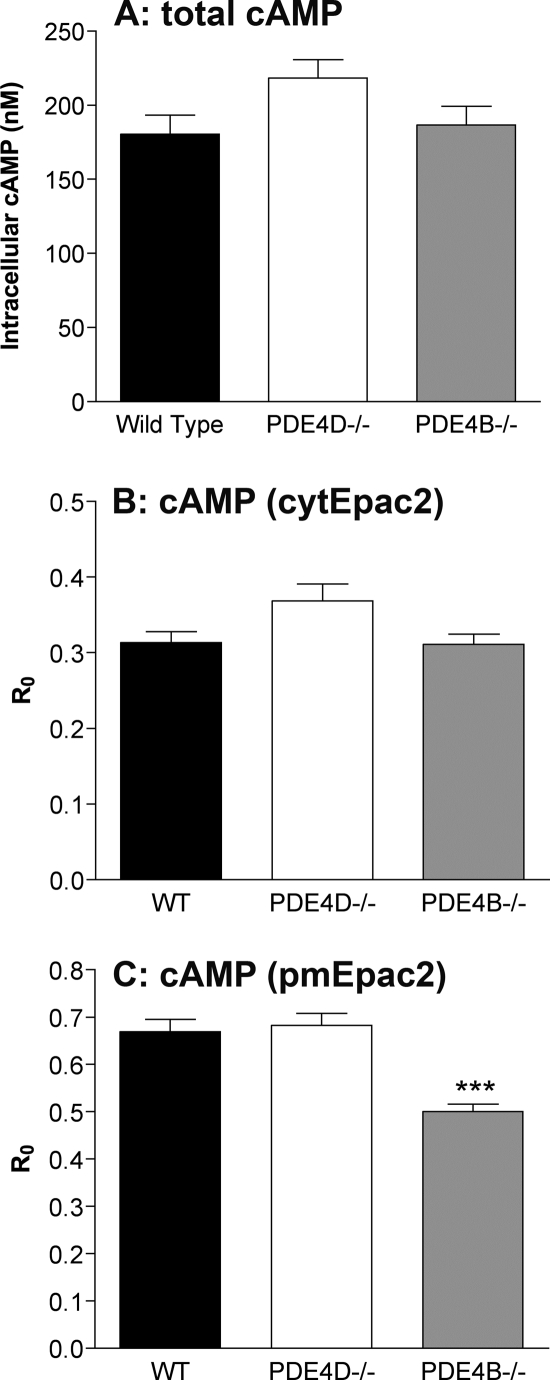
Because the CNG data suggest a higher basal level of cAMP associated with the plasma membrane in the PDE4B-null MEFs, we determined the relative basal cAMP levels by additional methods. The basal global cAMP concentrations measured by RIA were not significantly different in the three genotypes, although a trend for an increase in PDE4D−/− cells was observed (Fig. 6A and supplemental Table S2). The ratio of the basal FRET to CFP, referred to as R0,was plotted to determine whether basal cAMP concentrations as measured with the Epac2 biosensors were affected by PDE4 ablation (27). Cyclic AMP binding to the Epac2 FRET-based sensors induces a conformational change that decreases the FRET (18): an increase in basal cAMP levels is, therefore, reflected by a decrease in R0. Like global cAMP measurements, no differences in basal cAMP levels were observed with cytEpac2 (Fig. 6B) in the WT, PDE4D−/−, and PDE4B−/− MEFs; however, a significantly lower ratio was obtained in the PDE4B−/− MEFs with pmEpac2 (p < 0.0001) (Fig. 6C). These results provide evidence that the basal levels of cAMP in the near-membrane compartment are higher in the absence of PDE4B.
FIGURE 6.
Global, cytosolic, and plasma membrane-associated basal cAMP concentrations. A, comparison of basal global cAMP levels in the three cell types as measured by RIA. B and C, the basal FRET over donor ratio (R0) for cells transduced with cytEpac2 (B) or pmEpac2 (C) was calculated to determine the relative basal cAMP concentrations. A decrease in R0 reflects an increase in cAMP. Data were analyzed using the unpaired t test; ***, p < 0.0001. The graphs report the mean ± S.E. of three or more separate experiments. Error bars, S.E.
PDE4D Is Primarily Cytoplasmic, Whereas PDE4B Is Membrane-localized
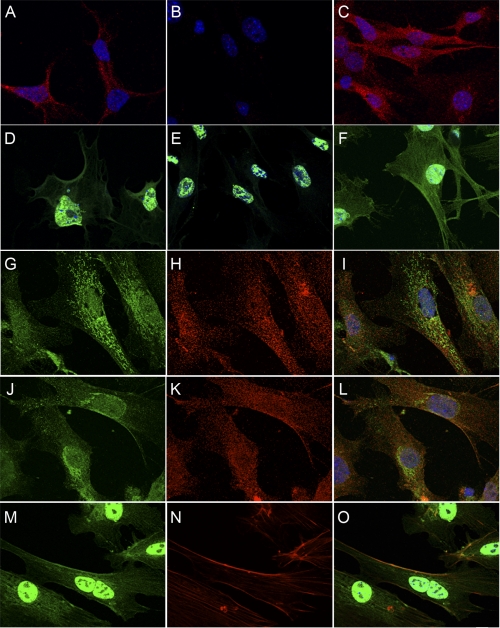
Immunofluorescent staining of PDE4D in MEFs resulted in a punctate cytoplasmic staining (Fig. 7A), which was absent in PDE4D-null MEFs (Fig. 7B). The PDE4D staining was unaffected by the ablation of PDE4B (Fig. 7C). PDE4D staining had limited overlap with either the endoplasmic reticulum marker calreticulin (Figs. 7, G, H, and I overlay) or with the Golgi-specific marker syntaxin (Figs. 7, J, K, and L overlay). Specific PDE4B staining in MEFs was localized at the plasma membrane (Fig. 7D) and colocalized with phalloidin, indicating colocalization to actin cortical filaments (Fig. 7, M, N, and O overlay). Nonspecific staining was also detected in the nucleus of the PDE4B-null MEFs (Fig. 7E). No effect on PDE4B staining was observed in the PDE4D-null MEFs (Fig. 7F).
FIGURE 7.
PDE4D staining is punctate and cytoplasmic, whereas PDE4B staining is cytoplasmic and membrane-localized with nonspecific staining in nucleus. A, B, and C, Aanti-PDE4D staining of WT (A) as well as PDE4D- (B) and PDE4B-deficient (C) MEFs. D, E, and F, anti-PDE4B staining of WT (D), PDE4B- (E), and PDE4D (F)-deficient MEFs. G, H, and I, anti-calreticulin (endoplasmic reticulum marker) staining (G) and anti-PDE4D staining (H) show minimal colocalization (I, overlay). J, K, and L, anti-syntaxin (Golgi marker) staining (J) and anti-PDE4D staining (K) show limited colocalization (L, overlay). M, N, and O, PDE4B (M) staining colocalizes with phalloidin (N) showing some localization to actin cortical filaments (O, overlay). Scale bar, 10 μm.
Differential Effect of PDE4s on Iso-dependent CREB Transcription
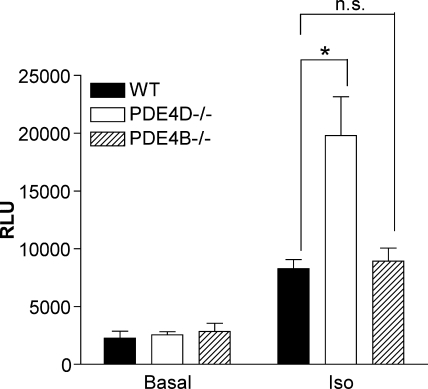
The impact of ablation of the two PDEs on downstream targets of cAMP signaling located in different subcellular compartments was then compared. Previously we showed that PDE4D but not PDE4B was involved in Iso-dependent phosphorylation of CREB (24). Because small changes in CREB phosphorylation may not be detectable by Western blot analysis, we used a more sensitive transcription reporter approach in which CRE regulates the expression of the luciferase reporter. The CRE-luciferase construct was transduced into MEFs, and cells were assayed for luciferase activity after 16 h of Iso treatment. Iso treatment elevated CRE-dependent luciferase activity 3.5-fold in WT MEFs (Fig. 8). A similar 3-fold increase was detected in PDE4B−/− MEFs, whereas luciferase activity increased 7.7-fold in PDE4D−/− MEFs.
FIGURE 8.
Ablation of PDE4D but not PDE4B increases CREB-dependent transcription. Wild type, PDE4D−/−, and PDE4B−/− MEFs were transduced with CRE-luciferase reporter lentivirus. After 72 h, the cells were treated with or without 10 μm Iso and lysed 20 h later, and luciferase activity was measured. The transduction was performed two times in triplicate. Activity was corrected for GFP expression. n.s., not significant; RLU, relative luciferase units. Error bars, S.E.; *, p < 0.05.
Iso-dependent VASP Phosphorylation Is Affected in Both PDE4D- and PDE4B-deficient MEFs
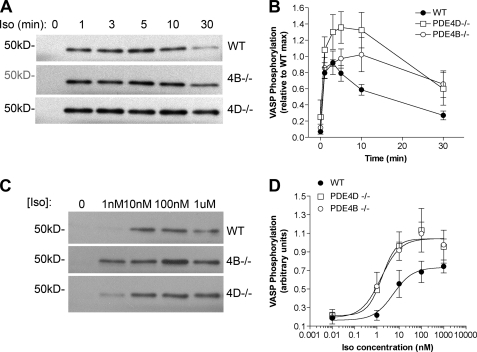
The effect of PDE4D and PDE4B ablation on Iso-induced VASP phosphorylation was investigated. VASP phosphorylation has been implicated in diverse cellular responses from platelet aggregation (28, 29), cellular adhesion, and motility to endothelial cell permeability and angiogenesis (30, 31). Because VASP is associated with focal adhesions, cell-cell contacts, microfilaments, and highly dynamic membrane regions, it can be used to probe cAMP-dependent PKA phosphorylation in this subcellular compartment. Phosphorylation at Ser-157 was measured by Western blot (Fig. 9A) and corrected for protein loading by β-tubulin content. Iso stimulation caused a transient increase in VASP phosphorylation that returned to basal levels after 30 min (Fig. 9B). PDE4D ablation caused an increase in VASP phosphorylation compared with the wild type MEFs, and both the maximal response and the return to basal levels were delayed. Consistent with the plasma membrane cAMP response, PDE4B ablation produced a delayed but significant increase in VASP phosphorylation and a slower return to basal levels. Dose-response studies also showed that both PDE4D and PDE4B ablation cause an increased sensitivity to Iso with maximal phosphorylation attained at 5-fold lower concentrations of the agonist (Fig. 9D).
FIGURE 9.
Iso-dependent VASP phosphorylation of PDE4-null MEFs. MEFs deficient in PDE4B (4B) and PDE4D (4D) along with wild type controls were stimulated with Iso for the times indicated and then harvested in SDS buffer containing phosphatase inhibitors. Equal amounts of protein were separated by SDS-PAGE, and Western blotting was performed using an antibody against phosphorylated Ser-157 of VASP. A, representative blot showing the time course of phosphorylated VASP detection in MEFs stimulated with 100 nm Iso in the indicated genotypes. B, quantification of VASP phosphorylation time course as a ratio of maximum wild type signal. C, representative blot showing the increased Ser-157 phosphorylation in response to increasing concentrations of Iso after 3 min of stimulation. D, quantification of the Iso dose response. Data were corrected for loading with tubulin and represent the mean ± S.E. of four experiments. EC50 values are as follows: WT, 5.57 ± 2.36 nm; PDE4B−/−, 1.54 ± 1.85 nm and PDE4D−/−, 1.74 ± 2.50 nm (mean ± S.E.; n = 4). Error bars, S.E.
Effects of PDE4 Ablation on LPS-induced TNFα Accumulation
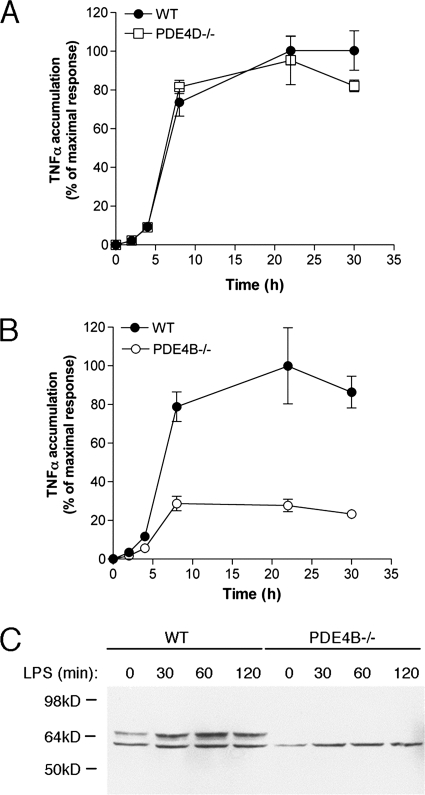
The above data show that PDE4D and PDE4B at the plasma membrane are largely overlapping but that only PDE4B regulates basal cAMP. To determine whether PDE4B and PDE4D effects can be dissociated under conditions of low cAMP, we measured their effect on another plasma membrane event. Activation of the transmembrane Toll-like receptors (TLRs) results in production of inflammatory cytokines and chemokines and induction of inflammation. LPS binds to and activates TLR4, which leads to an increase in TNFα production. LPS stimulation of mouse peripheral leukocytes induces PDE4B expression and increases PDE4 activity (13). We therefore investigated the LPS-induced activation of TLR signaling for plasma membrane-associated cAMP responses specific to PDE4 subtypes. LPS responses were blunted in MEFs deficient in PDE4B (Fig. 10A) but unaffected in PDE4D-null cells (Fig. 10B).
FIGURE 10.
PDE4B expression increases following LPS treatment and is required for LPS-induced TNFα accumulation. A and B, TNFα accumulation in response to LPS stimulation is unaffected in PDE4D-null MEFs (A) and reduced in PDE4B-null MEFs (B). C, Western blot with anti-PDE4B antibodies using whole cell extracts from LPS-treated wild type and PDE4B−/− MEFs. Error bars, S.E.
DISCUSSION
Any given cell is endowed with a defined and often unique set of components of cyclic nucleotide signaling, including PDEs. This cell-selective expression is thought to confer specificity to the cAMP signal emanating from different receptors. Here, we provide evidence that in primary cultures of MEFs PDE4B regulates cAMP concentration and access to its effectors in a restricted subcellular compartment proximal to the plasma membrane, whereas PDE4D is the primary enzyme responsible for cAMP degradation in the bulk cytosol. This conclusion is based on multiple experimental paradigms using different cAMP sensors and selective activation of steps downstream of cAMP. Together with the divergent phenotypes of PDE4 knock-out mice (13, 14) and knockdown experiments (15–17), these findings strongly indicate a specific function for each PDE4 subtype. They also imply that cAMP in the confined compartment under PDE4B control functions independently of the overall intracellular pool and is associated with unique biological effects.
Localization experiments show that PDE4D and PDE4B have distinct patterns of distribution in MEFs. The bulk of PDE4D, the major subtype of PDE expressed in MEFs, had an intracellular punctate pattern of localization. Limited colocalization was detected with calreticulin and syntaxin antibodies, markers for the endoplasmic reticulum and Golgi apparatus, respectively. This localization is consistent with previous observations in the endocrine FRTL-5 cells, HEK293 cells, and HEK293 cells stably expressing β2-adrenergic receptor (16, 32, 33). PDE4D subtypes are part of different macromolecular complexes, including those with β-arrestin (34, 35), myomegalin (36), Rack-1 (37), aquaporin 2 (38), and A-kinase anchoring protein (39–41). Although anchoring proteins must be present to target the majority of PDE4D to a specific compartment, these remain to be identified in MEFs. Specific PDE4B staining was localized predominantly to a near-membrane compartment that overlaps with the actin cortical cytoskeleton. PDE4B2 staining associated with the plasma membrane (16) and the nucleus (32) of HEK293 cells has been reported previously. PDE4B2 is localized to the plasma membrane in T cells (42). Some nuclear staining was observed in MEFs, but it persisted in the PDE4B−/− cells, suggesting a nonspecific signal. Little is known about the PDE4B2 interaction with anchoring proteins outside the CNS, although PDE4B2 interaction with β-arrestin in T cells has been reported (43). These distinct subcellular localizations of the two PDE4 subtypes strongly support the hypothesis that these isoenzymes control cAMP in different cellular subdomains.
The PDE4B and PDE4D splicing variants expressed in MEFs have distinct properties. The PDE4B2 variant is a short form lacking the PKA phosphorylation site and the dimerization domain (10). We have shown that β-adrenergic stimulation does not modify the activity of this form in MEFs (24). Conversely, two long splicing variants, PDE4D5 and PDE4D9, are detected in MEF extracts. Both forms are predicted to dimerize and are activated by PKA (44). We have shown previously that PDE4D and its phosphorylation play a primary role in shaping the β-adrenergic response and desensitization (24, 45). Here we confirm with single cell measurements that PDE4D is necessary for signal dissipation in all subcellular compartments studied. We also show that at the single cell level the number of cells displaying a desensitizing behavior is greatly reduced when PDE4D is ablated.
Significant heterogeneity in the behavior of the MEFs was observed with the Epac and CNG probes. In some cells, cAMP returned rapidly to basal levels, whereas in others, it remained stable. This divergent behavior has also been observed in HEK293 cell lines (16), thus excluding the possibility that our observation in primary cells is caused by heterogeneous cell populations. Because these are proliferating cells, it is possible that hormone responses are modulated during the cell cycle. Our finding also raises the possibility that cells are heterogeneous in terms of expression of different components of the cAMP signaling pathway. Differences in receptor desensitization and/or PDE expression may be at the basis of the divergent kinetics of dissipation of the cAMP signal. Immunocytochemical staining shows differences in expression patterns of the PDEs between individual cells, but no conclusions can be made without a more quantitative approach.
An increase in basal cAMP accumulation was detected in the near-membrane pool following PDE4B ablation. PDE4D ablation, however, did not significantly affect basal cAMP in the cytosol or near-membrane compartment, which suggests that basal PDE4D activity is not sufficient to impact cAMP homeostasis. This increase in basal cAMP accumulation was no longer evident when wild type and PDE4B-null cells were tested in the presence of rolipram, ruling out possible unrelated differences in the two cell types. A possible explanation for the different effects on basal cAMP lies in the regulation of the two PDEs. We propose that PDE4B2, the major PDE4B expressed in MEFs, is constitutively active, whereas the two PDE4D forms expressed, PDE4D5 and PDE4D9, are activated by cAMP-dependent, PKA-mediated phosphorylation (24). In the absence of G protein-coupled receptor activation, PDE4D activity is, therefore, not sufficient to impact basal cAMP, whereas it becomes the major active form during hormonal stimulation when cAMP levels are elevated. This conclusion is consistent with the divergent effect of PDE4B and PDE4D ablation on TLR signaling. Under conditions where cAMP remained at near basal concentrations, only PDE4B had an effect on TNFα accumulation.
Although PDE3s and PDE4A are present in MEFs, PDE4D removal had profound effects on the rate of decay of the cAMP signal in the cytosolic compartment. This finding is in agreement with the conclusion of Terrin et al. (16) that the PDE4D variants are the major forms hydrolyzing the pool of cAMP deep in the cytosol of a cell. The residual decay of the cAMP signal detected in the cytosol of PDE4D-null cells (Fig. 3B) is probably contributed by PDE4A activity because rolipram caused a further increase in cAMP. The contribution of PDE3 is unclear given the fact that we have shown that PDE3 inhibitors have no effect on Iso-stimulated cAMP levels (24).
Ablation of PDE4D had a major effect on cAMP levels measured at the plasma membrane using different probes as well as different ligands. This effect had not been observed previously by Terrin et al. (16) but was detected with the CNG probe in HEK293 cells (17). Given the absence of detectable PDE4D localization in this compartment, we speculate that PDE4D controls a pool of cAMP that rapidly equilibrates throughout the cell, and loss of activity in the cytosol affects the kinetics of cAMP decay in the cytosol and at the membrane. This conclusion would also account for the slight differences in rate of decay observed between the membrane and cytosol of wild type cells. PDE4D is more concentrated in the cytosol than at the membrane. Thus, cAMP is more rapidly degraded in the cytosol than at the membrane.
The effects of PDE4B were restricted to a pool of cAMP near the plasma membrane as demonstrated by the pmEpac2 and CNG channel measurements. Additionally, selective phosphorylation of a membrane cytoskeleton-associated protein (VASP) but not of a protein localized in the cytosol (CREB) implies that PDE4B has a localized function restricted to the membrane. The use of different readouts lessens the possibility of bias in the measurements due to unknown behaviors of the sensors in the intracellular environment. The concentration of cAMP in the membrane pool increased upon PDE4B ablation during Iso or PGE2 stimulation, indicating that this cAMP pool is not receptor-specific. As suggested by measurements in HEK293 cells (46), the cAMP pool in the proximity of the plasma membrane is likely small in size compared with the bulk cytosolic cAMP (<2%). This size may explain why no effects of PDE4B were observed at the global or cytosolic levels: the effects in a small compartment would be diluted in the much larger cytosolic pool. However, a more probable explanation of this latter finding is that this cAMP pool accessible to PDE4B does not equilibrate with the bulk cAMP. A slow equilibration between the plasma membrane and cytosolic pools has been reported by Rich et al. (46) and explains why PDE4B effects in a subcellular compartment can be detected. The physical boundaries of such a compartment remain to be determined. It has been suggested that either PDEs form an enzymatic barrier to cAMP diffusion (4, 5, 7, 47) or, alternatively, that compartmentalized PDEs may act as a sink to localized pools of cAMP (16, 48). However, if PDEs were to function as a barrier to diffusion, their ablation would cause an equilibration of the different pools as suggested by Terrin et al. (16). Our data on the PDE4B effects instead show that ablation of this enzyme magnifies the differences between the cytosol and the membrane compartments. This allows for the divergent kinetics of cAMP accumulation in the two compartments of the PDE4B-null cells. Whereas cAMP decreased in the cytosol, it was stable or increased in the compartment where PDE4B was removed. This finding underscores an important property of the cell: non-equilibrating pools of cAMP are present, and the temporal development of the cAMP signal can widely diverge in different cellular subdomains. A similar phenomenon has been observed by Wachten et al. (19) using adenylyl cyclases to target Epac probes where cAMP increases in one compartment but decreases in another. Our findings support the same conclusion and underscore the localized function of PDE4s as a component of compartmentalization.
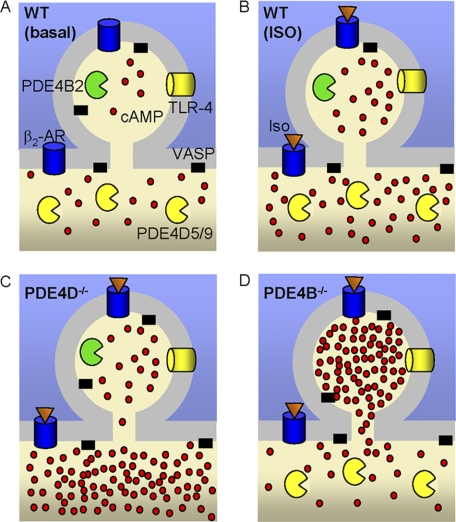
We assume that both plasma membrane probes utilized in this study are uniformly distributed at the plasma membrane and sense both pools of cAMP. Theoretically, the diffusible cytosolic probe is also able to sense these membrane pools. However, we were not able to detect an increase in cytosolic cAMP following PDE4B ablation. This may have occurred because the size of the near-membrane pool is small compared with that of the bulk cytosol. Does the membrane pool of cAMP under PDE4B control overlap with the membrane PDE4D-regulated pool? In a model that accommodates our findings, these pools are separate and have distinct properties (see Fig. 11). According to our model, the pool of cAMP regulated by PDE4B does not readily equilibrate with the bulk cytosol, whereas the rest of the plasma membrane pool is in equilibrium with the remainder of the cell. The TLR response is affected only by PDE4B ablation. This biological response supports the view that PDE4B is functioning in a sequestered compartment and is in agreement with the view that the pool of cAMP affected by PDE4D cannot invade the compartment where PDE4B is functioning. The effect on basal cAMP in the two compartments further supports our conclusion. An alternative view is that PDE4D and PDE4B control an overlapping membrane compartment. Cyclic AMP measurements with the cAMP plasma membrane Epac or CNG probe after stimulation with Iso or PGE2 do not unequivocally exclude this possibility because of the limited dynamic range of the probes at high cAMP concentrations. It is possible that the different cAMP pools characterized above are below the threshold for detection with light microscopy and correspond to large macromolecular complexes. Understanding the molecular mechanisms regulating PDE4B distribution to subplasma membrane domains should shed light on this possibility.
FIGURE 11.
Schematic model of PDE4B and PDE4D cellular distribution and resulting pattern of cAMP accumulation. A, B, C, and D, cyclic AMP distribution in WT MEFs with no stimulation (A) and following Iso stimulation in WT (B), PDE4D−/− (C), and PDE4B−/− (D) MEFs. PDE4B is localized to a small portion of the cell membrane (<2% of the total cell volume). This compartment has limited equilibration with the cytosol. AR, adrenergic receptor.
Measurements with two distinct sensors (CNG channel and pmEpac2) as well as the phosphorylation data demonstrate that PDE4B clearly plays a role at the level of the plasma membrane. However, a decrease in PDE4B expression by siRNA down-regulation has previously been reported to have no effect on either plasma membrane or cytosolic cAMP (16, 17). Because PDE4B and PDE4D comprise the majority of PDE4 activity in both HEK293 cells and MEFs, these different results cannot be explained by differences in PDE expression. The divergent findings may be reconciled by considering that the PDE4B knockdown reported by Willoughby et al. (17) reduced PDE4B expression by 50%, whereas in our studies, no residual PDE4B activity was detected. Alternatively, it may be possible that HEK293 cells and MEFs are endowed with different subcellular compartments or, more specifically, different anchoring molecules. Both knock-out and siRNA-mediated knockdown (49) approaches have limitations because of cellular compensation. In the case of MEFs, we have documented that the responses of cells from different PDE4 genotypes are identical when PDE inhibitors are included (24) (Fig. 5 and supplemental Fig. S2). Forskolin responses in the presence of rolipram or IBMX are also comparable. The effects of PDE4D ablation on global cAMP can be reversed by expressing a recombinant PDE4D (24). Additionally, immunocytochemical staining for PDE4D and PDE4B was unaffected in the PDE4B- and PDE4D-null MEFs, respectively. Together these findings indicate that the effects we report in MEFs are not due to compensatory changes at the level of cAMP synthesis; however, compensation likely occurs downstream of cAMP accumulation.
In summary, we have demonstrated that PDE4B has a restricted effect on cAMP signaling in a compartment close to the plasma membrane, whereas PDE4D has global effects on intracellular cAMP concentrations, thus providing a functional explanation for the expression of multiple PDE subtypes within a cell. The properties of the two PDEs are likely to affect different cellular functions as indicated by the PDE4B-selective suppression of TLR4 signaling and the differential effect on CREB-mediated transcription. Our data strongly suggest that only limited equilibration of cAMP occurs between different compartments. The limited diffusion of cAMP throughout the cell may be caused by physical barriers or by buffering of cAMP due to binding to intracellular receptors such as Epacs or PKA. Further characterization of these compartments will provide a better understanding of the mechanisms by which cAMP signaling shapes cellular responses.
Acknowledgments
We thank Dr. Viacheslav Nikolaev (Institute of Pharmacology and Toxicology, University of Würzburg, Würzburg, Germany) for the generous gift of the cytEpac2 and pmEpac2 constructs. We also thank Dr. Robin Kleiman (Pfizer, New York, NY) for the generous gift of the CRE-Luciferase construct and Dr. Fred Schaufele (University of California San Francisco) for discussion of the FRET data.
This work was supported, in whole or in part, by National Institutes of Health Grant HL092788. This work was also supported by a grant from the Leducq Foundation.

The on-line version of this article (available at http://www.jbc.org) contains supplemental Figs. S1–S3 and Tables S1 and S2.
- PKA
- protein kinase A
- PDE
- cyclic nucleotide phosphodiesterase
- CNG
- cyclic nucleotide-gated
- PGE2
- prostaglandin E2
- Epac
- exchange protein activated by cAMP
- VASP
- vasodilator-stimulated phosphoprotein
- Iso
- isoproterenol
- CREB
- cAMP-response element-binding protein
- RIA
- radioimmunoassay
- cytEpac2
- cytosolic Epac2
- pmEpac2
- plasma membrane-targeted Epac2
- IBMX
- 3-isobutyl-1-methylxanthine
- MEF
- mouse embryonic fibroblast
- CFP
- cyan fluorescent protein
- CRE
- cAMP-response element
- TLR
- Toll-like receptor.
REFERENCES
- 1. Rich T. C., Fagan K. A., Tse T. E., Schaack J., Cooper D. M., Karpen J. W. (2001) Proc. Natl. Acad. Sci. U.S.A. 98, 13049–13054 [DOI] [PMC free article] [PubMed] [Google Scholar]
- 2. Beavo J. A., Bechtel P. J., Krebs E. G. (1974) Proc. Natl. Acad. Sci. U.S.A. 71, 3580–3583 [DOI] [PMC free article] [PubMed] [Google Scholar]
- 3. Rich T. C., Xin W., Mehats C., Hassell K. A., Piggott L. A., Le X., Karpen J. W., Conti M. (2007) Am. J. Physiol. Cell Physiol. 292, C319–C331 [DOI] [PMC free article] [PubMed] [Google Scholar]
- 4. Barnes A. P., Livera G., Huang P., Sun C., O'Neal W. K., Conti M., Stutts M. J., Milgram S. L. (2005) J. Biol. Chem. 280, 7997–8003 [DOI] [PubMed] [Google Scholar]
- 5. Jurevicius J., Fischmeister R. (1996) Proc. Natl. Acad. Sci. U.S.A. 93, 295–299 [DOI] [PMC free article] [PubMed] [Google Scholar]
- 6. Saucerman J. J., Zhang J., Martin J. C., Peng L. X., Stenbit A. E., Tsien R. Y., McCulloch A. D. (2006) Proc. Natl. Acad. Sci. U.S.A. 103, 12923–12928 [DOI] [PMC free article] [PubMed] [Google Scholar]
- 7. Zaccolo M., Pozzan T. (2002) Science 295, 1711–1715 [DOI] [PubMed] [Google Scholar]
- 8. Conti M., Beavo J. (2007) Annu. Rev. Biochem. 76, 481–511 [DOI] [PubMed] [Google Scholar]
- 9. Conti M., Richter W., Mehats C., Livera G., Park J. Y., Jin C. (2003) J. Biol. Chem. 278, 5493–5496 [DOI] [PubMed] [Google Scholar]
- 10. Conti M., Jin S. L. (1999) Prog. Nucleic Acid Res. Mol. Biol. 63, 1–38 [DOI] [PubMed] [Google Scholar]
- 11. Houslay M. D. (2001) Prog. Nucleic Acid Res. Mol. Biol. 69, 249–315 [DOI] [PubMed] [Google Scholar]
- 12. Houslay M. D., Adams D. R. (2003) Biochem. J. 370, 1–18 [DOI] [PMC free article] [PubMed] [Google Scholar]
- 13. Jin S. L., Conti M. (2002) Proc. Natl. Acad. Sci. U.S.A. 99, 7628–7633 [DOI] [PMC free article] [PubMed] [Google Scholar]
- 14. Jin S. L., Richard F. J., Kuo W. P., D'Ercole A. J., Conti M. (1999) Proc. Natl. Acad. Sci. U.S.A. 96, 11998–12003 [DOI] [PMC free article] [PubMed] [Google Scholar]
- 15. Lynch M. J., Baillie G. S., Mohamed A., Li X., Maisonneuve C., Klussmann E., van Heeke G., Houslay M. D. (2005) J. Biol. Chem. 280, 33178–33189 [DOI] [PubMed] [Google Scholar]
- 16. Terrin A., Di Benedetto G., Pertegato V., Cheung Y. F., Baillie G., Lynch M. J., Elvassore N., Prinz A., Herberg F. W., Houslay M. D., Zaccolo M. (2006) J. Cell Biol. 175, 441–451 [DOI] [PMC free article] [PubMed] [Google Scholar]
- 17. Willoughby D., Baillie G. S., Lynch M. J., Ciruela A., Houslay M. D., Cooper D. M. (2007) J. Biol. Chem. 282, 34235–34249 [DOI] [PubMed] [Google Scholar]
- 18. Nikolaev V. O., Bünemann M., Hein L., Hannawacker A., Lohse M. J. (2004) J. Biol. Chem. 279, 37215–37218 [DOI] [PubMed] [Google Scholar]
- 19. Wachten S., Masada N., Ayling L. J., Ciruela A., Nikolaev V. O., Lohse M. J., Cooper D. M. (2010) J. Cell Sci. 123, 95–106 [DOI] [PMC free article] [PubMed] [Google Scholar]
- 20. Jin S. L., Lan L., Zoudilova M., Conti M. (2005) J. Immunol. 175, 1523–1531 [DOI] [PubMed] [Google Scholar]
- 21. Rich T. C., Tse T. E., Rohan J. G., Schaack J., Karpen J. W. (2001) J. Gen. Physiol. 118, 63–78 [DOI] [PMC free article] [PubMed] [Google Scholar]
- 22. Lowry O. H., Rosebrough N. J., Farr A. L., Randall R. J. (1951) J. Biol. Chem. 193, 265–275 [PubMed] [Google Scholar]
- 23. Harper J. F., Brooker G. (1975) J. Cyclic Nucleotide Res. 1, 207–218 [PubMed] [Google Scholar]
- 24. Bruss M. D., Richter W., Horner K., Jin S. L., Conti M. (2008) J. Biol. Chem. 283, 22430–22442 [DOI] [PMC free article] [PubMed] [Google Scholar]
- 25. Resh M. D. (2006) Nat. Chem. Biol. 2, 584–590 [DOI] [PubMed] [Google Scholar]
- 26. Zacharias D. A., Violin J. D., Newton A. C., Tsien R. Y. (2002) Science 296, 913–916 [DOI] [PubMed] [Google Scholar]
- 27. Padron A., Li L., Kofoed E. M., Schaufele F. (2007) Mol. Endocrinol. 21, 49–61 [DOI] [PubMed] [Google Scholar]
- 28. An D., Rodrigues B. (2006) Am. J. Physiol. Heart Circ. Physiol. 291, H1489–H1506 [DOI] [PubMed] [Google Scholar]
- 29. Aszódi A., Pfeifer A., Ahmad M., Glauner M., Zhou X. H., Ny L., Andersson K. E., Kehrel B., Offermanns S., Fässler R. (1999) EMBO J. 18, 37–48 [DOI] [PMC free article] [PubMed] [Google Scholar]
- 30. Chen H., Levine Y. C., Golan D. E., Michel T., Lin A. J. (2008) J. Biol. Chem. 283, 4439–4447 [DOI] [PubMed] [Google Scholar]
- 31. Comerford K. M., Lawrence D. W., Synnestvedt K., Levi B. P., Colgan S. P. (2002) FASEB J. 16, 583–585 [DOI] [PubMed] [Google Scholar]
- 32. Huston E., Lynch M. J., Mohamed A., Collins D. M., Hill E. V., MacLeod R., Krause E., Baillie G. S., Houslay M. D. (2008) Proc. Natl. Acad. Sci. U.S.A. 105, 12791–12796 [DOI] [PMC free article] [PubMed] [Google Scholar]
- 33. Jin S. L., Bushnik T., Lan L., Conti M. (1998) J. Biol. Chem. 273, 19672–19678 [DOI] [PubMed] [Google Scholar]
- 34. Baillie G. S., Sood A., McPhee I., Gall I., Perry S. J., Lefkowitz R. J., Houslay M. D. (2003) Proc. Natl. Acad. Sci. U.S.A. 100, 940–945 [DOI] [PMC free article] [PubMed] [Google Scholar] [Retracted]
- 35. Perry S. J., Baillie G. S., Kohout T. A., McPhee I., Magiera M. M., Ang K. L., Miller W. E., McLean A. J., Conti M., Houslay M. D., Lefkowitz R. J. (2002) Science 298, 834–836 [DOI] [PubMed] [Google Scholar]
- 36. Verde I., Pahlke G., Salanova M., Zhang G., Wang S., Coletti D., Onuffer J., Jin S. L., Conti M. (2001) J. Biol. Chem. 276, 11189–11198 [DOI] [PubMed] [Google Scholar]
- 37. Bolger G. B., Baillie G. S., Li X., Lynch M. J., Herzyk P., Mohamed A., Mitchell L. H., McCahill A., Hundsrucker C., Klussmann E., Adams D. R., Houslay M. D. (2006) Biochem. J. 398, 23–36 [DOI] [PMC free article] [PubMed] [Google Scholar]
- 38. Stefan E., Wiesner B., Baillie G. S., Mollajew R., Henn V., Lorenz D., Furkert J., Santamaria K., Nedvetsky P., Hundsrucker C., Beyermann M., Krause E., Pohl P., Gall I., MacIntyre A. N., Bachmann S., Houslay M. D., Rosenthal W., Klussmann E. (2007) J. Am. Soc. Nephrol. 18, 199–212 [DOI] [PubMed] [Google Scholar]
- 39. Dodge K. L., Khouangsathiene S., Kapiloff M. S., Mouton R., Hill E. V., Houslay M. D., Langeberg L. K., Scott J. D. (2001) EMBO J. 20, 1921–1930 [DOI] [PMC free article] [PubMed] [Google Scholar]
- 40. Taskén K. A., Collas P., Kemmner W. A., Witczak O., Conti M., Taskén K. (2001) J. Biol. Chem. 276, 21999–22002 [DOI] [PubMed] [Google Scholar]
- 41. Willoughby D., Wong W., Schaack J., Scott J. D., Cooper D. M. (2006) EMBO J. 25, 2051–2061 [DOI] [PMC free article] [PubMed] [Google Scholar]
- 42. Arp J., Kirchhof M. G., Baroja M. L., Nazarian S. H., Chau T. A., Strathdee C. A., Ball E. H., Madrenas J. (2003) Mol. Cell. Biol. 23, 8042–8057 [DOI] [PMC free article] [PubMed] [Google Scholar]
- 43. Abrahamsen H., Baillie G., Ngai J., Vang T., Nika K., Ruppelt A., Mustelin T., Zaccolo M., Houslay M., Taskén K. (2004) J. Immunol. 173, 4847–4858 [DOI] [PubMed] [Google Scholar]
- 44. Richter W., Conti M. (2002) J. Biol. Chem. 277, 40212–40221 [DOI] [PubMed] [Google Scholar]
- 45. Richter W., Day P., Agrawal R., Bruss M. D., Granier S., Wang Y. L., Rasmussen S. G., Horner K., Wang P., Lei T., Patterson A. J., Kobilka B., Conti M. (2008) EMBO J. 27, 384–393 [DOI] [PMC free article] [PubMed] [Google Scholar]
- 46. Rich T. C., Fagan K. A., Nakata H., Schaack J., Cooper D. M., Karpen J. W. (2000) J. Gen. Physiol. 116, 147–161 [DOI] [PMC free article] [PubMed] [Google Scholar]
- 47. Zaccolo M., Di Benedetto G., Lissandron V., Mancuso L., Terrin A., Zamparo I. (2006) Biochem. Soc. Trans. 34, 495–497 [DOI] [PubMed] [Google Scholar]
- 48. Oliveira R. F., Terrin A., Di Benedetto G., Cannon R. C., Koh W., Kim M., Zaccolo M., Blackwell K. T. (2010) PLoS One 5, e11725. [DOI] [PMC free article] [PubMed] [Google Scholar]
- 49. Krumins A. M., Gilman A. G. (2006) J. Biol. Chem. 281, 10250–10262 [DOI] [PubMed] [Google Scholar]


