Abstract
A new role of G protein-coupled receptor (GPCR) phosphorylation was demonstrated in the current studies by using the μ-opioid receptor (OPRM1) as a model. Morphine induces a low level of receptor phosphorylation and uses the PKCϵ pathway to induce ERK phosphorylation and receptor desensitization, whereas etorphine, fentanyl, and [d-Ala2,N-Me-Phe4,Gly5-ol]-enkephalin (DAMGO) induce extensive receptor phosphorylation and use the β-arrestin2 pathway. Blocking OPRM1 phosphorylation (by mutating Ser363, Thr370 and Ser375 to Ala) enabled etorphine, fentanyl, and DAMGO to use the PKCϵ pathway. This was not due to the decreased recruitment of β-arrestin2 to the receptor signaling complex, because these agonists were unable to use the PKCϵ pathway when β-arrestin2 was absent. In addition, overexpressing G protein-coupled receptor kinase 2 (GRK2) decreased the ability of morphine to activate PKCϵ, whereas overexpressing dominant-negative GRK2 enabled etorphine, fentanyl, and DAMGO to activate PKCϵ. Furthermore, by overexpressing wild-type OPRM1 and a phosphorylation-deficient mutant in primary cultures of hippocampal neurons, we demonstrated that receptor phosphorylation contributes to the differential effects of agonists on dendritic spine stability. Phosphorylation blockage made etorphine, fentanyl, and DAMGO function as morphine in the primary cultures. Therefore, agonist-dependent phosphorylation of GPCR regulates the activation of the PKC pathway and the subsequent responses.
Keywords: MicroRNA, Neuron, Receptor Desensitization, Receptor Modification, Signal Transduction, Biased Agonism, Phosphorylation, Spine Stability
Introduction
Agonist-dependent or agonist-biased signaling is a new concept in understanding the signaling of the G protein-coupled receptor (GPCR)4 (1). It suggests that GPCR agonists activate the downstream signaling pathways in a selective manner. In agonist-biased signaling, some agonists activate one set of pathways and other agonists activate a different set of pathways. A well studied example is GPCR-mediated ERK phosphorylation (2, 3). Generally, two distinct pathways, the PKC and β-arrestin pathways, mediate ERK phosphorylation in the GPCR system. Although both pathways can be observed with nearly all GPCRs, agonists do have preference. Some agonists can use only the PKC pathway to induce ERK phosphorylation, whereas some other agonists can use only the β-arrestin pathway (3). ERK phosphorylated via the PKC pathway stays in the cytosol and activates p90 ribosomal S6 kinase, whereas ERK phosphorylated via the β-arrestin pathway translocates into the nucleus and activates Elk1 (4, 5).
The binding of an agonist to a GPCR leads to receptor phosphorylation, which subsequently increases the affinity of the agonist-receptor complex for the cytosolic protein β-arrestin. Translocation of β-arrestin to the receptor complex disrupts receptor-G protein coupling, ceases G protein-mediated signaling, and initiates β-arrestin-mediated signaling (6). Because the activation of the PKC pathway requires G protein activation, it has been suggested that the affinity of the agonist-receptor complex for β-arrestin determines the selection between the PKC and β-arrestin pathways (7). However, this interpretation cannot explain why agonists that normally use the β-arrestin pathway do not use the PKC pathway when β-arrestin is removed (4, 7, 8). Thus we propose that receptor phosphorylation, rather than increased affinity for β-arrestin after phosphorylation, determines the selection between the PKC and β-arrestin pathways.
To prove this hypothesis, the μ-opioid receptor (OPRM1), of which agonist-dependent signaling has been reported, was used as a model. Unlike agonists such as etorphine, fentanyl, and [d-Ala2,N-Me-Phe4,Gly5-ol]-enkephalin (DAMGO), morphine has lower abilities to induce receptor phosphorylation, β-arrestin2 recruitment, and receptor internalization (9–11). In addition, morphine uses the PKC pathway to induce ERK phosphorylation, whereas etorphine, fentanyl, and DAMGO utilize the β-arrestin pathway (4). Agonist-dependent signaling was also observed with the desensitization of intracellular calcium ([Ca2+]i) release: morphine via the PKC pathway and the other three agonists via the β-arrestin pathway (8, 12).
In addition, chronic morphine treatment decreases dendritic spine density in primary hippocampal cultures (13). Agonists that initiate high receptor phosphorylation, such as etorphine, fentanyl, and DAMGO, do not decrease spine density (14, 15). Because β-arrestin and ERK mediate this difference (16–18), whether receptor phosphorylation also contributes to these differential responses was tested.
Hence, HEK cells stably expressing HA-tagged wild type OPRM1 (HEKOPRM1) and the phosphorylation-deficient OPRM1 mutant (3A, which has the Ser363, Thr370, and Ser375 residues mutated to Ala) (HEK3A) were used to determine the contribution of receptor phosphorylation to the selection between the PKC and β-arrestin pathways.
EXPERIMENTAL PROCEDURES
Cell Culture and Materials
HEKOPRM1, HEK3A, and mouse embryonic fibroblast cells (MEF, wild type, and β-arrestin2−/− from Dr. Lefkowitz, Duke University) were cultured in MEM supplied with 10% FBS and 200 ng/ml G418. Primary cultures of hippocampus neurons were generated from wild-type C57BL/J6 mice (Charles River Laboratories, Portage, MI) and β-arrestin2−/− mice (C57B/J6 background, from Dr. Lefkowitz's Laboratory) as described previously (13). Experiments started 21 days after plating.
PKC subtype-specific inhibitors were ordered from Biomatik Corporation (Cambridge, Ontario, Canada): PKCαi (Myr-FARKGALRQ-OH), PKCγi (Myr-EAVSLKPT-OH), and PKCϵi (Myr-CRLVLASC-OH). The peptides were myristoylated on the N-terminal for penetration across the cell membrane. Adenoviruses were titrated precisely to reach a receptor level of ∼0.5 pmol/mg protein in MEF cells and primary cultures. The antibodies against phosphorylated ERK, total ERK, phosphorylated Ser375 of OPRM1, and β-actin were purchased from Cell Signaling (Danvers, MA). PKC subtype antibodies were from Santa Cruz Biotechnology, Inc. (Santa Cruz, CA). The antibody against phosphorylated amino acids was from Sigma. The antibody against HA was from Covance Research Products (Emeryville, CA). The AP-conjugated secondary antibodies were from Bio-Rad. Gαi2 antibodies were generated as described previously (19).
Intracellular Calcium Measurement
Intracellular calcium was measured using the FLIPR® calcium assay kit (Molecular Devices Corp.) as described previously (8). Briefly, FLEXstation (Molecular Devices Corp.) was used to monitor intracellular calcium levels. The [Ca2+]i release in 10 to 12 wells were averaged. For desensitization, the potentiation of ADP-induced [Ca2+]i released after agonist pretreatment was normalized to that without pretreatment. The percentage decrease in potentiation intensity reflected the percentage of desensitization of OPRM1.
PKC Subtype Activity Assay
Activity of the PKC subtypes was determined by using the PKC activity assay kit from Cell Signaling as described previously (12). PKCϵ, PKRα, or PKCγ was immunoprecipitated from the supernatant from total cell lysate by subtype-specific antibodies and protein G-agarose beads. Reaction solution (Cell Signaling) containing biotin-linked PKC substrate was added to the beads. Reaction lasted 15 min at 37 °C with rotation, and was stopped by adding an equal volume of EDTA (50 mm, pH 8.0). Then the substrates in supernatant were precipitated with 30 μl of streptavidin-linked beads. The phosphorylated substrates were identified by specific antibodies and Alexa 488-conjugated goat-anti-rabbit antibody (Invitrogen). The PKC subtype activity was determined by measuring the fluorescence intensity using a α-Fusion plate reader (PerkinElmer Life Sciences, Boston, MA).
Lipid Raft Separation and Continuous Sucrose Gradient
Continuous sucrose gradient was used to separate the microdomains on the cell membrane according to their densities as described previously (20). Briefly, the samples were placed at the bottom of a 5–30% continuous sucrose gradient, which was centrifuged at 32,000 rpm for 16 h in a SW41 rotor at 4 °C. Twelve fractions (1 ml volume each) were further concentrated to 100 μl with trichloroacetic acid precipitation and analyzed with immunoblotting.
Immunoblotting and Immunoprecipitation
ERK phosphorylation was determined by immunoblotting (4). Immunoblotting and immunoprecipitation were performed as reported previously (18). Immunofluorescence was performed with a BD CARV IITM Confocal Imager (including Leica DMIRE2 fluorescence microscope), Hamamatsu EM-CCD C9100 camera, and IPlab 4.0 (BD Biosciences, San Jose, CA) (16).
Statistical Analysis
Experiments were repeated at least four times, and at least eight individual cells were used for images analyses. The results were analyzed by using the two-tailed Student's t test and ANOVA test, except for data depicted in Figs. 1, 2, D and E, and 7, which were analyzed by the one-way ANOVA test with the Dunnett-test as a post-hoc test for comparisons. The error bars present the standard derivations and * indicates a significant difference between the marked result and the basal or control result (indicated in the legends of the x-axis).
FIGURE 1.
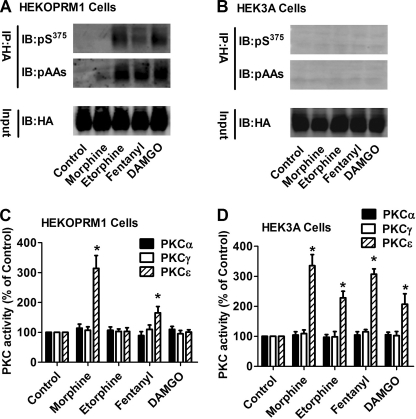
Receptor phosphorylation attenuates PKCϵ activation. HEKOPRM1 (A and C) and HEK3A cells (B and D) were treated with PBS (Control), 1 μm morphine, 10 nm etorphine, 10 nm fentanyl and 1 μm DAMGO for 5 min. A and B, receptors were immunoprecipitated with HA antibody. The phosphorylated Ser375 on OPRM1 (pS375) and phosphorylated amino acid (pAAs) were determined in the immunoprecipitated receptor. C and D, activities of three PKC subtypes were determined as described under “Experimental Procedures.” The results were normalized against that in the control in each group.
FIGURE 2.
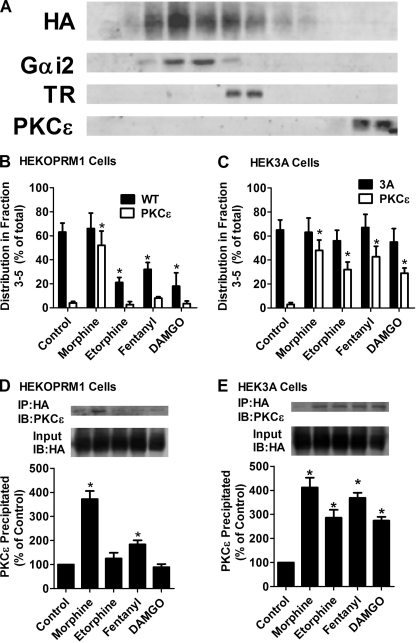
Receptor phosphorylation attenuates the recruitment of PKCϵ. A, distributions of OPRM1, Gαi2, transferrin receptor (TR), and PKCϵ in continuous sucrose gradient in untreated HEKOPRM1 cells. B–E, HEKOPRM1 (A and C) and HEK3A cells (B and D) were treated as in Fig. 1. B and C, cells were subjected to continuous sucrose gradient and immunoblotting as described. The amounts of receptor and PKCϵ from fraction 3 to fraction 5 were normalized to the total amounts (from fraction 1 to fraction 12). C and D, receptors were immunoprecipitated with HA antibody. The amounts of PKCϵ co-immunoprecipitated with receptor were determined. The results were normalized against that in the control.
FIGURE 7.
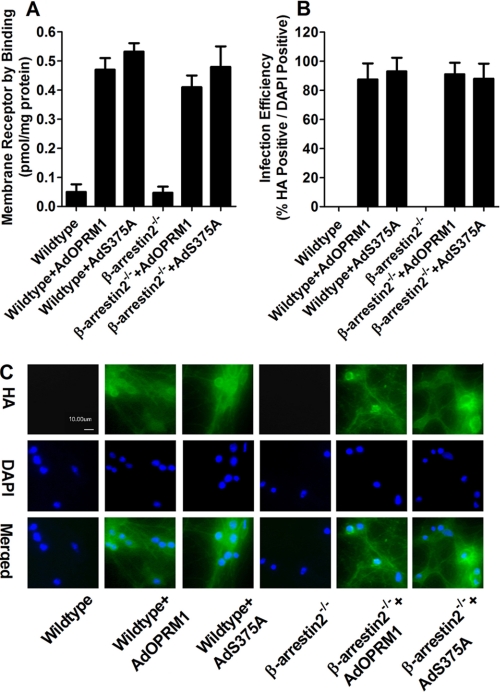
High efficiency of virus infection leads to high receptor expression. Primary cultures of hippocampal neurons from wild-type or β-arrestin2−/− mice were infected with AdOPRM1 or AdS375A for 3 days. The receptor expression was determined with binding assay after infection (A). The efficiency of the infection was indicated by the percentage of HA-positive (green in C) cells in DAPI-positive (blue in C) cells (B and C).
RESULTS
Receptor Phosphorylation Attenuates PKCϵ Activation
To determine the roles played by receptor phosphorylation in activating the PKC pathway, two cell lines (HEKOPRM1 and HEK3A) and four agonists (morphine, etorphine, fentanyl, and DAMGO) were used. HEK3A cells express a phosphorylation-deficient mutant of OPRM1 with S363A, T370A, and S375A mutations. For consistency, “OPRM1” will be used for wild-type OPRM1, “3A” will be used for the phosphorylation-deficient mutant, and “receptor” will indicate both the wild-type and mutants in this discussion. HEKOPRM1 and HEK3A cells have similar receptor expression levels: 6.3 ± 0.4 and 5.8 ± 0.2 pmol/mg protein. In addition, there is no significant difference between the binding affinities of the agonists for OPRM1 and 3A (21).
Morphine induces maximum ERK phosphorylation and adenylyl cyclase inhibition at 1 μm (20). Considering the relative affinity of the four agonists for OPRM1 and their abilities to induce maximum ERK phosphorylation and adenylyl cyclase inhibition (4, 22), DAMGO was used at 1 μm, whereas etorphine and fentanyl were used at 10 nm, to achieved equivalent concentrations. At these concentrations, the agonists induce ERK phosphorylation and adenylyl cyclase inhibition to similar levels.
Because the phosphorylation sites of OPRM1 have been demonstrated to be the Ser363, Thr370, and Ser375 residues of the C terminus (21), antibodies against phosphorylated Ser375 (pS375) and phosphorylated amino acids (pAAs) were used to monitor receptor phosphorylation. In HEKOPRM1 cells, all the agonists except for morphine induced significant receptor phosphorylation as detected with the pS375 and pAAs antibodies (Fig. 1A). Fentanyl-induced Ser375 phosphorylation was lower than that induced by etorphine or DAMGO. In HEK3A cells, none of the four agonists induced receptor phosphorylation (Fig. 1B), confirming the ability of 3A to serve as a phosphorylation-deficient mutant.
PKC is a large kinase family and is divided into three subfamilies, conventional, atypical, and novel, depending on their activation mechanisms (23). PKCα, PKCγ, and PKCϵ contribute to morphine-induced tolerance (24). Thus, the activities of PKCα, PKCγ, and PKCϵ were determined after agonist treatment. Morphine induced PKCϵ activation (314 ± 43% of control, n = 4) in HEKOPRM1 cells. Fentanyl induced a much lower activation of PKCϵ (158 ± 21%, n = 4). Neither etorphine (103 ± 12%, n = 4) nor DAMGO (101 ± 8%, n = 4) induced activation of PKCϵ (Fig. 1C). In the HEK3A cells, all four agonists activated PKCϵ (Fig. 1D). Etorphine and DAMGO induced lower activation of PKCϵ (228 ± 22% and 207 ± 35% of control, n = 4) than did morphine and fentanyl (335 ± 37% and 307 ± 18%, respectively, n = 4).
In HEKOPRM1 cells, the intensity of agonist-induced PKCϵ activation was such that morphine was greater than fentanyl, which was greater than etorphine or DAMGO. Intensity of receptor phosphorylation, on the other hand, was such that etorphine and DAMGO were greater than fentanyl, which was greater than morphine. In HEK3A cells, all four agonists activated PKCϵ but did not induce receptor phosphorylation. Thus, the ability of the agonists to activate PKCϵ inversely correlates with their ability to induce receptor phosphorylation. Therefore, it is reasonable to suggest that receptor phosphorylation attenuates PKCϵ activation.
Receptor Phosphorylation Attenuates the Recruitment of PKCϵ
After being activated, PKCs translocate from cytosol to the cell membrane (23). Therefore, we measured the translocation of PKCϵ to the cell membrane to confirm the influence of receptor phosphorylation on PKCϵ activation. Continuous sucrose gradient was used to separate the microdomains on the cell membrane as described previously (20). The distribution of lipid raft microdomains was marked by Gαi2 (25) and that of non-raft microdomains was marked by transferrin receptor (26). The amounts of Gαi2, transferrin receptor, and PKCϵ peaked at fraction 4, 6, and 12, respectively (Fig. 2A). The percentage amounts of target proteins in fractions 3–5 were used to indicate their distribution in the lipid raft microdomains.
In the absence of an agonist, the majority of the receptor was in the lipid raft microdomains in both HEKOPRM1 and HEK3A cells (Fig. 2, B and C). PKCϵ was enriched in fractions 11 and 12, suggesting the cytosolic location of PKCϵ under the control condition. In HEKOPRM1 cells, morphine induced translocation of PKCϵ from the cytosol to the lipid raft microdomains (Fig. 2B). Fentanyl also induced translocation, but the percentage of PKCϵ translocated to fractions 3–5 totalled only 8.1 ± 1% (n = 4), which is much less than that (52 ± 12%, n = 4) induced by morphine. Etorphine and DAMGO did not affect the location of PKCϵ (2.7 ± 2% (n = 4) and 3.4 ± 2% (n = 4), respectively). In HEK3A cells, all four agonists induced translocation of PKCϵ: morphine (48 ± 9%, n = 4), etorphine (32 ± 6%, n = 4), fentanyl (43 ± 9%, n = 4), and DAMGO (29 ± 4%, n = 4) (Fig. 2C).
Because PKCϵ translocated to the lipid raft microdomains after receptor activation, the interaction between the receptor signaling complex and PKCϵ was monitored by immunoprecipitation. In HEKOPRM1 cells, the interaction between the OPRM1 complex and PKCϵ was identified only after morphine or fentanyl treatment. The morphine-OPRM1 complex precipitated more PKCϵ (372 ± 34% of control, n = 4) than did the fentanyl-OPRM1 receptor complex (184 ± 17% of control, n = 4) (Fig. 2D). However, all four agonists induced significant recruitment of PKCϵ to the receptor signaling complex in HEK3A cells (Fig. 2E).
Blocking Receptor Phosphorylation Switches Agonists from the β-Arrestin2 Pathway to the PKCϵ Pathway
Morphine-induced ERK phosphorylation and receptor desensitization of [Ca2+]i release require PKCϵ activation, whereas etorphine and DAMGO use the β-arrestin2 pathway to initiate these two signaling events (4, 12). Because etorphine and DAMGO activated and recruited PKCϵ in HEK3A cells, whether phosphorylation blockage could switch these agonists from the β-arrestin2 pathway to the PKCϵ pathway was investigated. To distinguish the signaling mediated by PKCϵ from that mediated by β-arrestin2, a PKCϵ-specific inhibitor (PKCϵi) was used.
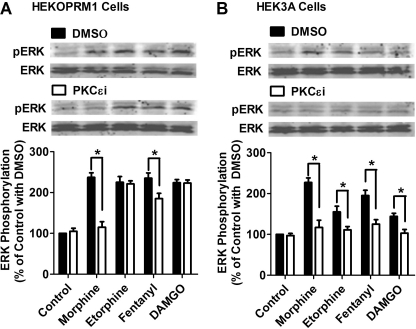
As predicted, PKCϵi attenuated ERK phosphorylation induced by morphine in HEKOPRM1 cells, from 237 ± 11% to 115 ± 14% (n = 4) of basal level (Fig. 3A). In addition, PKCϵi slightly attenuated fentanyl-induced ERK phosphorylation, but did not affect that induced by either etorphine or DAMGO. In HEK3A cells, all four agonists induced ERK phosphorylation (Fig. 3B). Because of the low affinity of 3A for β-arrestin2, another pathway is likely involved that mediates ERK phosphorylation, presumably the PKCϵ pathway. PKCϵi reduced the ability of all four agonists to induce ERK phosphorylation in HEK3A cells: morphine from 227 ± 11% to 117 ± 18%; etorphine from 155 ± 14% to 111 ± 8%; fentanyl from 195 ± 13% to 125 ± 11%; DAMGO from 144 ± 8% to 103 ± 9% (n = 4) (Fig. 3B).
FIGURE 3.
Phosphorylation blockage enables agonists to use PKCϵ for ERK phosphorylation. Cells were treated with DMSO or 50 μm PKCϵ-specific inhibitor (PKCϵi) for 3 h. HEKOPRM1 (A) and HEK3A cells (B) were then treated with agonists as in Fig. 1. ERK phosphorylation was determined by normalizing the immunoreactivities of phosphorylated ERK against the immunoreactivities of total ERK. The results were further normalized against that in the control with DMSO.
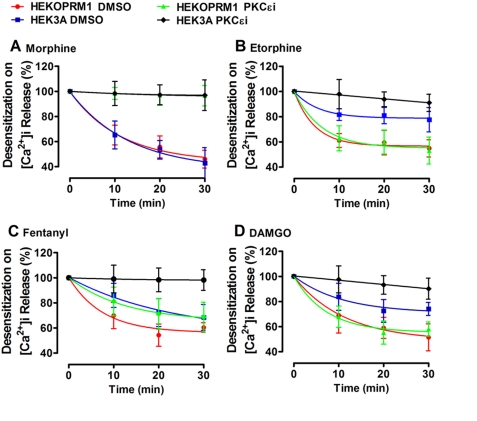
Receptor desensitization of [Ca2+]i release also was monitored after agonist treatment to further establish the relationship between receptor phosphorylation and PKCϵ-related signaling. Because the concentrations of agonists used above induce desensitization quickly, morphine and DAMGO were used at 100 nm, and the other two agonists at 1 nm. PKCϵi was used to distinguish PKCϵ-mediated desensitization from β-arrestin2-mediated desensitization. Morphine-induced receptor desensitization was PKCϵ-mediated in both cell lines (Fig. 4A). Etorphine and DAMGO induced less desensitization in HEK3A cells than in HEKOPRM1 cells. Desensitization induced by etorphine and DAMGO in HEKOPRM1 cells was not mediated by PKCϵ, because PKCϵi did not affect the desensitization. However, receptor desensitization induced by etorphine and DAMGO in HEK3A cells was PKCϵ-mediated (Fig. 4, B and D). Fentanyl functioned as a combination of morphine and etorphine, although more similarly to etorphine (Fig. 4C). Thus, blocking receptor phosphorylation enables etorphine and DAMGO to use the PKCϵ pathway, although not as efficiently as morphine.
FIGURE 4.
Phosphorylation blockage enables agonists to use PKCϵ for receptor desensitization. HEKOPRM1 and HEK3A were treated with DMSO or 50 μm PKCϵi for 3 h and were then pretreated with 100 nm morphine (A), 1 nm etorphine (B), 1 nm fentanyl (C), and 100 nm DAMGO (D) for the times indicated on the x axis. ADP was added after agonist pretreatment. The percentage decrease in the agonist-induced potentiation on the ADP-induced [Ca2+]i release was used to indicate the receptor desensitization. The decreases were calculated by using the formula: 100% − potentiation on ADP-induced [Ca2+]i release with pretreatment/potentiation on ADP-induced [Ca2+]i release without pretreatment.
Attenuation of PKCϵ Activation Is Independent of the Increased Affinity of the Receptor Complex for β-Arrestin2
Receptor phosphorylation increases the affinity of an agonist-receptor complex for β-arrestin2 (6). However, this increased affinity of an agonist-receptor complex for β-arrestin2 is not the reason why receptor phosphorylation prevents PKCϵ activation. MEF cells from wild-type (WTMEF) and β-arrestin2−/− (BKOMEF) mice were used. The adenoviruses encoding the wild type OPRM1 (AdOPRM1) and 3A mutant (Ad3A) were used to express the receptor in the MEF cells. In order to compare the results from these two types of MEF cells, the amounts of adenoviruses were titrated precisely to express the receptor at 0.5 pmol/mg. The results obtained in the WTMEF cells infected with AdOPRM1 and Ad3A were similar to those observed in HEKOPRM1 and HEK3A cells. The blockage of receptor phosphorylation increased the ability of etorphine, fentanyl, and DAMGO to use the PKCϵ-pathway, although less efficiently than morphine (Table 1).
TABLE 1.
Receptor phosphorylation but not β-arrestin2 contributes to PKCϵ activation
WTMEF and BKOMEF cells were used. The AdOPRM1 and Ad3A were used to express receptor to about 0.5 pmol/mg protein. For ERK activation, cells were treated with 1 μm morphine, 10 nm etorphine, 10 nm fentanyl, and 1 μm DAMGO for 5 min. The amounts of phosphorylated ERK were normalized against those of total ERK. The results were further normalized against those under control condition. For receptor desensitization, cells were treated with 100 nm morphine, 1 nm etorphine, 1 nm fentanyl, and 100 nm DAMGO for 30 min. Normally ADP, but not the agonists, can induce [Ca2+]i release. However, the agonists can potentiate the [Ca2+]i release induced by ADP. Thus the abilities of agonists to induce this potentiation were used to indicate their abilities to activate receptor, and the percentage decrease in the potentiation was used to indicate the desensitization. The “% inh.” was calculated by using the formula: 100% - result in DMSO-treated cells/result in PKCϵi-treated cells. N/S suggests the effect of PKCϵi was not significant. N/A suggests the agonist did not induce signaling in DMSO group, therefore no decrease can be calculated.
| ERK phosphorylation (% of basal level) | ||||
|---|---|---|---|---|
| WTMEF cells |
BKOMEF cells |
|||
| AdOPRM1 | Ad3A | AdOPRM1 | Ad3A | |
| Morphine | ||||
| DMSO | 178 ± 13 | 183 ± 7 | 176 ± 12 | 173 ± 8 |
| PKCϵi | 111 ± 7 | 97 ± 15 | 105 ± 9 | 103 ± 11 |
| % Inh. | 86 | 104 | 93 | 96 |
| Etorphine | ||||
| DMSO | 183 ± 12 | 154 ± 13 | 113 ± 14 | 181 ± 16 |
| PKCϵi | 175 ± 14 | 116 ± 8 | 105 ± 12 | 118 ± 12 |
| % Inh. | N/S | 70 | N/A | 78 |
| Fentanyl | ||||
| DMSO | 174 ± 8 | 184 ± 11 | 138 ± 10 | 174 ± 9 |
| PKCϵi | 185 ± 11 | 108 ± 13 | 123 ± 17 | 104 ± 7 |
| % Inh. | N/S | 90 | N/A | 95 |
| DAMGO | ||||
| DMSO | 181 ± 10 | 153 ± 8 | 111 ± 7 | 183 ± 7 |
| PKCϵi | 174 ± 8 | 119 ± 6 | 109 ± 11 | 106 ± 11 |
| % Inh. | N/S | 64 | N/A | 93 |
| Receptor Desensitization on[Ca2+]i (% decrease in basal activity) | ||||
|---|---|---|---|---|
| WTMEF cells |
BKOMEF cells |
|||
| AdOPRM1 | Ad3A | AdOPRM1 | Ad3A | |
| Morphine | ||||
| DMSO | 36 ± 12 | 43 ± 7 | 43 ± 7 | 38 ± 11 |
| PKCϵi | 6 ± 5 | 3 ± 4 | 2 ± 6 | 2 ± 7 |
| % Inh. | 83 | 93 | 95 | 95 |
| Etorphine | ||||
| DMSO | 49 ± 7 | 26 ± 6 | 1 ± 7 | 45 ± 6 |
| PKCϵi | 42 ± 12 | 9 ± 7 | 9 ± 10 | 7 ± 3 |
| % Inh. | N/S | 65 | N/A | 84 |
| Fentanyl | ||||
| DMSO | 45 ± 6 | 33 ± 12 | 17 ± 11 | 44 ± 5 |
| PKCϵi | 34 ± 10 | 11 ± 6 | 2 ± 5 | 5 ± 8 |
| % Inh. | N/S | 67 | N/A | 89 |
| DAMGO | ||||
| DMSO | 37 ± 11 | 29 ± 12 | 6 ± 3 | 41 ± 14 |
| PKCϵi | 41 ± 9 | 9 ± 8 | 5 ± 9 | 8 ± 10 |
| % Inh. | N/S | 69 | N/A | 80 |
In the BKOMEF infected with AdOPRM1, etorphine and DAMGO did not induce ERK phosphorylation or receptor desensitization, indicating they did not activate PKCϵ pathway (Table 1). Receptor phosphorylation therefore prevents agonists from using the PKCϵ pathway directly rather than by increasing the affinity of agonist-receptor for β-arrestin2. In addition, etorphine and DAMGO activated the PKCϵ pathway in BKOMEF infected with Ad3A as efficiently as morphine. Considering that etorphine and DAMGO activate the PKCϵ pathway less efficiently than morphine in WTMEF infected with Ad3A, the existence of β-arrestin2 limited the activation of PKCϵ pathway, presumably through the basal affinity of β-arrestin2 for the non-phosphorylated receptor.
Phosphorylation on Ser375 Is the Major Inhibitor of PKCϵ Activation
Three residues were mutated in the 3A to prevent receptor phosphorylation. Because Ser375 has been suggested to be the major site for agonist-induced receptor phosphorylation (8, 21), the contribution of phosphorylation on these three residues to PKCϵ activation was investigated. Ser363, Thr370, and Ser375 were mutated to Ala individually and stably expressed in HEK293 cells. The activity of PKCϵ was determined in these cells lines after agonist treatment.
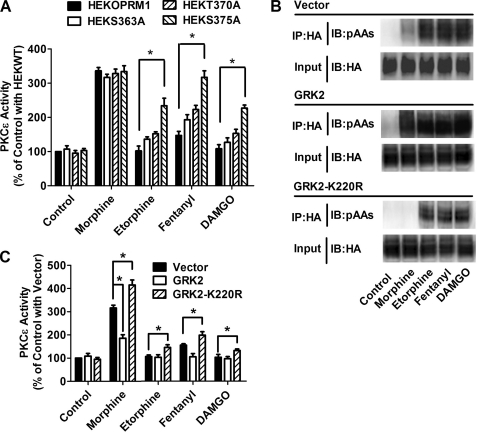
Etorphine and DAMGO induced PKCϵ activation in HEKS363A and HEKT370A cells, but the activation was much less than in HEKS375A cells. Etorphine activated PKCϵ to 102 ± 14% in HEKOPRM1 cells, while to 136 ± 7%, 152 ± 7%, and 234 ± 22% of basal level in HEKS363A, HEKT370A, and HEKS375A cells, respectively (Fig. 5A). DAMGO activated PKCϵ to 108 ± 12%, 127 ± 13%, 153 ± 12%, and 227 ± 9% of basal level in HEKOPRM1, HEKS363A, HEKT370A, and HEKS375A cells, respectively. In addition, fentanyl-induced PKCϵ activation was potentiated much more in HEKS375A than in HEKS363A or HEKT370A cells.
FIGURE 5.
GRK2 phosphorylation on Ser375 attenuates PKCϵ activation. A, HEKOPRM1, HEKS363A, HEKT370A, and HEKS375A cells were treated with PBS (Control), 1 μm morphine, 10 nm etorphine, 10 nm fentanyl, and 1 μm DAMGO for 5min. The activity of PKCϵ was determined. B and C, HEKOPRM1 was transfected with a vector, GRK2, and GRK2-K220R. One day after transfection, cells were treated with agonists as in A. Receptor phosphorylation on Ser375 was determined in B. PKCϵ activities were normalized against that in “Control with Vector” in C.
Ser375 in OPRM1 has been suggested to be the phosphorylation site of G protein-coupled receptor kinase 2 (GRK2) (8, 21), thus wild-type GRK2 and a dominant-negative mutant of GRK2 (GRK2-K220R) were overexpressed in HEKOPRM1 cells to modulate the ability of the agonists to induce receptor phosphorylation. As indicated in Fig. 5B, wild-type GRK2 overexpression increased the ability of all four agonists to induce receptor phosphorylation, whereas GRK2-K220R overexpression resulted in the opposite effect. The activities of PKCϵ were measured after overexpression. Morphine-induced activation of PKCϵ was potentiated by GRK2-K220R, but impaired by GRK2 (Fig. 5C). Although GRK2 overexpression could not reduced PKCϵ activity to below basal level, GRK2-K220R overexpression did increase the ability of etorphine, fentanyl, and DAMGO to activate PKCϵ. Because Ser375 is the major functional site, an adenovirus expressing a S375A mutant of OPRM1 (AdS375A) was used in further studies.
S375A Mutation Switches Agonists to the PKCϵ Pathway in Primary Cultures
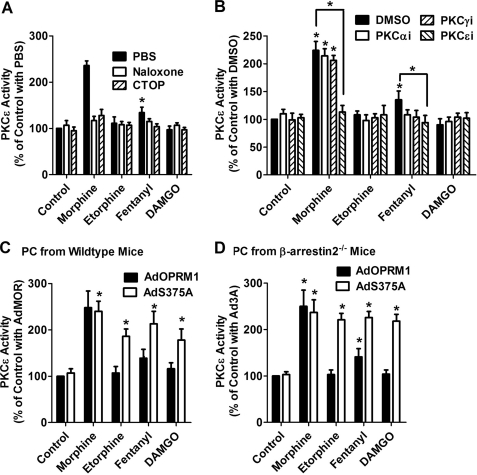
HEK cells have different characteristics from neuronal cells in which OPRM1 is expressed endogenously. Hence, primary cultures of mouse hippocampal neurons were used to confirm the ability of receptor phosphorylation to impair the activation of the PKCϵ pathway. As predicted, morphine, but not etorphine or DAMGO, activated PKCϵ in the primary cultures, whereas fentanyl activated PKCϵ to a lower level than morphine (Fig. 6A). When the primary cultures were pretreated with the general opioid receptor antagonist naloxone and the OPRM1 specific antagonist Cys2-Tyr3-Orn5-Pen7-amide, PKCϵ activation was attenuated, indicating that agonist-induced PKCϵ activation is through OPRM1. In addition, pretreatment with PKC subtype-specific inhibitors demonstrated that PKCϵ, but not PKCα or PKCγ, is activated by OPRM1 in the primary cultures (Fig. 6B).
FIGURE 6.
Receptor phosphorylation attenuates PKCϵ activation in primary cultures. A and B, primary cultures of hippocampal neurons from wild-type mice were pretreated with PBS, 10 μm naloxone, or 10 μm CTOP for 10 min (A). The cultures were pretreated with DMSO or 50 μm PKC subtype-specific inhibitors (PKCαi, PKCγI, and PKCϵi) for 3 h (B). Then the primary cultures were incubated with 1 μm morphine, 10 nm etorphine, 10 nm fentanyl, or 1 μm DAMGO for 5 min, and the activities of PKC subtypes were determined as described under “Experimental Procedures.” The results were normalized against that of the control with PBS (A) and the control with DMSO (B). C, primary hippocampal neurons from wild-type mice were infected with AdOPRM1 or AdS375A for 3 days. Then the primary cultures were incubated with 1 μm morphine, 10 nm etorphine, 10 nm fentanyl, or 1 μm DAMGO for 5 min, and the activity of PKCϵ was determined. The results were normalized against that of the control with AdOPRM1. D, primary hippocampal neurons from βarrestin2−/− mice were prepared as in C, and PKCϵ activity was determined.
Hippocampal primary cultures from wild type mice and β-arrestin2−/− mice were prepared as described under “Experimental Procedures.” AdOPRM1 and AdS375A were used to express exogenous receptors and to determine the effect of phosphorylation blockage on PKCϵ activation. In both primary cultures, phosphorylation blockage increased the ability of etorphine, DAMGO, and fentanyl to activate PKCϵ (Fig. 6, C and D). Therefore, receptor phosphorylation also directly prevented the agonists from using the PKCϵ pathway in primary cultures.
The adenoviruses generated a receptor expression level at about 0.45 pmol/mg protein, which is much higher than the endogenous OPRM1 level (about 0.048 pmol/mg protein) (Fig. 7A). Infection efficiency is indicated in Fig. 7, B and C, and the percentage of the infected primary cultures (HA-positive) in DAPI-positive cells was close to 90%. Therefore, after adenovirus infection, the primary cultures express much more exogenous receptor than endogenous OPRM1, resulting in for the ability to determine agonist-dependent signaling in primary cultures.
S375A Mutation Reversed the Effects of Agonists on Dendritic Spine Stability
It has been reported that agonist-dependent activation of ERK resulted in differential regulation of miR-190, NeuroD, and dendritic spines stability (16–18). Primary cultures from wild-type mice were infected with AdOPRM1 or AdS375A for 3 days, and the dendritic spine stability was monitored during the next 3 days with agonist incubation. In addition, the level of miR-190 and NeuroD mRNA was quantified in the infected primary cultures.
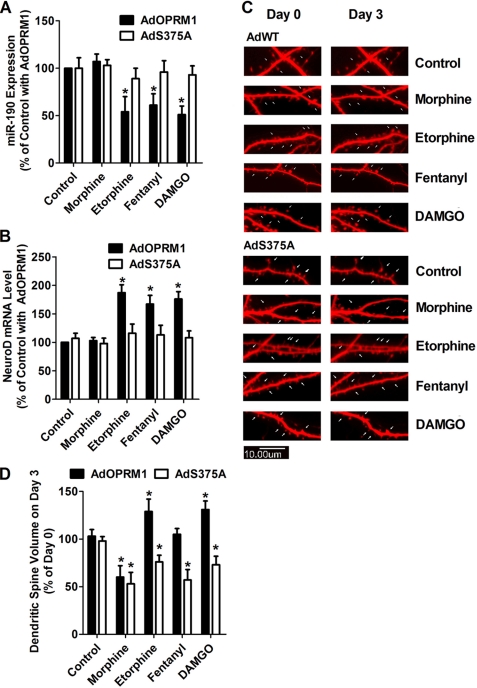
In AdOPRM1-infected primary cultures, etorphine, fentanyl, and DAMGO induced decreases in miR-190 expression (54 ± 16%, 61 ± 12%, and 51 ± 9%, respectively, n = 4) (Fig. 8A). However, in AdS375A-infected primary cultures, the effects of these three agonists on miR-190 were attenuated. In addition, etorphine, fentanyl, and DAMGO increased NeuroD mRNA level in AdOPRM1-infected, but not in AdS375A-infected, primary cultures.
FIGURE 8.
Phosphorylation blockage switches the effects of agonist on spine stability. A and B, primary hippocampal neurons from wild-type mice were infected with AdOPRM1 or AdS373A for 3 days. Then the primary cultures were incubated with 1 μm morphine, 10 nm etorphine, 10 nm fentanyl, or 1 μm DAMGO for additional 3 days. The levels of miR-190 (A) and NeuroD mRNA (B) were determined. The results were normalized against that of the control with AdOPRM1. C and D, primary hippocampal neurons from wild-type mice were transfected with DsRed in pRK5 7 days after plating. Two weeks later, the cultures were infected with AdOPRM1 or AdS375A for 3 days. Then the primary cultures were incubated with 1 μm morphine, 10 nm etorphine, 10 nm fentanyl, or 1 μm DAMGO for additional 3 days. At Day 0 and Day 3 of agonist treatment, dendritic spine stability was examined in confocal images as described under “Experimental Procedures.” The spine densities (spine volume) on Day 3 were normalized against that on Day 0 and summarized (C). The images indicate the changes on spine morphology (D).
In AdOPRM1-infected primary cultures, similar observations were obtained as reported previously. A three-day morphine treatment decreased the volume of dendritic spines by 40 ± 12%, where as treatments with etorphine, fentanyl, and DAMGO did not decrease spine volume (Fig. 8, C and D).
When used to treat the AdS375A-infected primary cultures, all four agonists significantly decreased spine volume during the three-day treatments. Morphine, etorphine, fentanyl, and DAMGO decreased spine volume by 47 ± 12%, 24 ± 7%, 23 ± 11%, and 27 ± 9% from that on Day 0, respectively (Fig. 8, C and D). Thus, phosphorylation blockage can regulate the effects of agonists, such as etorphine, fentanyl, and DAMGO, on dendritic spine stability.
DISCUSSION
Four agonists (morphine, fentanyl, etorphine, and DAMGO) and two signaling events (ERK phosphorylation and desensitization) were examined in the current studies. In summary, three types of agonists were represented. Morphine activated the PKCϵ pathway and used only the PKCϵ pathway for ERK phosphorylation. Etorphine and DMAGO did not activate the PKCϵ pathway and used only the β-arrestin2 pathway for ERK phosphorylation. Fentanyl acted more like etorphine and DAMGO, but it could activate the PKCϵ pathway. Thus it represented agonists that can use both pathways for ERK phosphorylation.
Etorphine and DAMGO used the β-arrestin2 pathway for signaling in the presence of both receptor phosphorylation and β-arrestin2. If β-arrestin2 was removed from the system, no activation of ERK was observed. In contrast, if receptor phosphorylation was blocked, the two agonists utilize the PKCϵ pathway for signaling. Thus, receptor phosphorylation, rather than the increased affinity of the receptor complex for β-arrestin2, attenuates activation of the PKCϵ pathway. These observations were consistent with the report that phosphorylation of the δ-opioid receptor regulates agonist-dependent signaling (27). However, the basal affinity between a non-phosphorylated receptor and β-arrestin2 should still limit activation of the PKCϵ pathway. Morphine induces little receptor phosphorylation and no receptor internalization under normal conditions (9), but overexpression of β-arrestin2 enables morphine to induce significant receptor internalization (28). In addition, morphine induces significant receptor internalization in striatal neurons, but not in hippocampal neurons, probably due to the differential amounts and basal activities of β-arrestin in these systems (29). This hypothesis about the basal affinity was also confirmed in the current study. Blocking receptor phosphorylation made etorphine and DAMGO utilize the PKCϵ pathway, but not as efficiently as morphine. Removing β-arrestin2 additionally enabled etorphine and DAMGO to activate the PKCϵ pathway to levels similar to that induced by morphine. Therefore, although not the major blocker of PKCϵ activation, the existence of β-arrestin2 and its affinity for non-phosphorylated receptor also prevents agonists from using the PKCϵ pathway.
GRK2 overexpression increased the ability of morphine to induce receptor phosphorylation, but decreased morphine ability to use the PKCϵ pathway (Fig. 5, B and C). These observations are consistent with the fact that β-arrestin2 overexpression makes morphine switch from the PKC pathway to the β-arrestin2 pathway (4, 8). These results also provide a possible mechanism for morphine to use the β-arrestin pathway. In addition, the agonists switching from one pathway to another provides a useful tool in controlling the downstream responses to the agonists. On the one hand, the most critical regions on GPCRs for G protein coupling are the second intracellular loop (IL), the N terminus, and the C terminus of IL3 (30). On the other hand, in addition to the C terminus facilitating the binding of β-arrestin by mediating phosphorylation (31), the IL2, the N terminus, and the C terminus of the IL3 are also essential for the binding of β-arrestin (32–36). Due to this overlap of binding sites, receptor phosphorylation can be suggested as regulating the competition between G proteins and β-arrestin for the binding site on GPCRs (7).
Although the inhibitory effects of receptor phosphorylation on PKCϵ activation were demonstrated in the current studies, the detailed mechanism has not been elucidated completely. One possible mechanism is that conformational changes of the receptor during phosphorylation prevent activation of PKCϵ. The different affinities between phosphorylated and non-phosphorylated receptors for β-arrestin support the existence of conformational differences. In addition, GRK2 is recruited to the cell membrane and binds with the receptor after activation by free Gβγ subunits (37–39). The binding of GRK2 to the receptor signaling complex also may be the reason that activation of PKCϵ is prevented.
As reported previously, the different abilities of morphine and fentanyl to affect miR-190, NeuroD, and subsequent dendritic spine stability are due to the different pathways used by them to induce ERK phosphorylation (18). Thus, phosphorylation blockage enabled etorphine, fentanyl, and DAMGO to activate PKCϵ and to function like morphine. In addition, since NeuroD plays an essential role in hippocampus development, adult neurogenesis, and maintaining dendritic spine stability (40–42), the effects of agonists on NeuroD should have board implications. Controlling agonist-dependent signaling by altering GRK activities or the receptor phosphorylation stage not only implicates controlling ERK phosphorylation, receptor desensitization, and dendritic spine stability, but also may be useful in other aspects, such asadult neurogenesis, long-term potentiation and learning, and overall adaptational responses to chronic drug treatment.
This work was supported, in whole or in part, by National Institutes of Health Grants DA007339, DA016674, DA000564, and DA011806.
- GPCR
- G protein-coupled receptors
- [Ca2+]i
- intracellular calcium
- DAMGO
- [d-Ala2,N-Me-Phe4,Gly5-ol]-enkephalin
- HEK3A
- HEK cells stably expressing a phosphorylation-deficient mutant of OPRM1
- HEKOPRM1
- HEK cells stably expressing the HA-tagged wild-type OPRM1
- IL
- intracellular loop
- MEF
- mouse embryonic fibroblast
- miR-190
- microRNA-190
- OPRM1
- μ-opioid receptor.
REFERENCES
- 1. Urban J. D., Clarke W. P., von Zastrow M., Nichols D. E., Kobilka B., Weinstein H., Javitch J. A., Roth B. L., Christopoulos A., Sexton P. M., Miller K. J., Spedding M., Mailman R. B. (2007) J. Pharmacol. Exp. Ther. 320, 1–13 [DOI] [PubMed] [Google Scholar]
- 2. Violin J. D., Lefkowitz R. J. (2007) Trends Pharmacol. Sci. 28, 416–422 [DOI] [PubMed] [Google Scholar]
- 3. DeWire S. M., Ahn S., Lefkowitz R. J., Shenoy S. K. (2007) Annu. Rev. Physiol. 69, 483–510 [DOI] [PubMed] [Google Scholar]
- 4. Zheng H., Loh H. H., Law P. Y. (2008) Mol. Pharmacol. 73, 178–190 [DOI] [PMC free article] [PubMed] [Google Scholar]
- 5. Kobayashi H., Narita Y., Nishida M., Kurose H. (2005) Cell Signal. 17, 1248–1253 [DOI] [PubMed] [Google Scholar]
- 6. Lefkowitz R. J. (1998) J. Biol. Chem. 273, 18677–18680 [DOI] [PubMed] [Google Scholar]
- 7. Zheng H., Loh H. H., Law P. Y. (2010) IUBMB Life 62, 112–119 [DOI] [PMC free article] [PubMed] [Google Scholar]
- 8. Chu J., Zheng H., Loh H. H., Law P. Y. (2008) Cell Signal. 20, 1616–1624 [DOI] [PMC free article] [PubMed] [Google Scholar]
- 9. Keith D. E., Murray S. R., Zaki P. A., Chu P. C., Lissin D. V., Kang L., Evans C. J., von Zastrow M. (1996) J. Biol. Chem. 271, 19021–19024 [DOI] [PubMed] [Google Scholar]
- 10. Zhang J., Ferguson S. S., Barak L. S., Bodduluri S. R., Laporte S. A., Law P. Y., Caron M. G. (1998) Proc. Natl. Acad. Sci. U.S.A. 95, 7157–7162 [DOI] [PMC free article] [PubMed] [Google Scholar]
- 11. Koch T., Widera A., Bartzsch K., Schulz S., Brandenburg L. O., Wundrack N., Beyer A., Grecksch G., Höllt V. (2005) Mol. Pharmacol. 67, 280–287 [DOI] [PubMed] [Google Scholar]
- 12. Chu J., Zheng H., Zhang Y., Loh H. H., Law P. Y. (2010) Cell Signal. 22, 684–696 [DOI] [PMC free article] [PubMed] [Google Scholar]
- 13. Liao D., Lin H., Law P. Y., Loh H. H. (2005) Proc. Natl. Acad. Sci. U.S.A. 102, 1725–1730 [DOI] [PMC free article] [PubMed] [Google Scholar]
- 14. Liao D., Grigoriants O. O., Wang W., Wiens K., Loh H. H., Law P. Y. (2007) Mol. Cell. Neurosci. 35, 456–469 [DOI] [PMC free article] [PubMed] [Google Scholar]
- 15. Lin H., Higgins P., Loh H. H., Law P. Y., Liao D. (2009) Neuropsychopharmacology 34, 2097–2111 [DOI] [PMC free article] [PubMed] [Google Scholar]
- 16. Zheng H., Zeng Y., Chu J., Kam A. Y., Loh H. H., Law P. Y. (2010) J. Neurosci. 30, 8102–8110 [DOI] [PMC free article] [PubMed] [Google Scholar]
- 17. Zheng H., Zeng Y., Zhang X., Chu J., Loh H. H., Law P. Y. (2010) Mol. Pharmacol. 77, 102–109 [DOI] [PMC free article] [PubMed] [Google Scholar]
- 18. Zheng H., Chu J., Zeng Y., Loh H. H., Law P. Y. (2010) J. Biol. Chem. 285, 21994–22002 [DOI] [PMC free article] [PubMed] [Google Scholar]
- 19. Roerig S. C., Loh H. H., Law P. Y. (1992) Mol. Pharmacol. 41, 822–831 [PubMed] [Google Scholar]
- 20. Zheng H., Chu J., Qiu Y., Loh H. H., Law P. Y. (2008) Proc. Natl. Acad. Sci. U.S.A. 105, 9421–9426 [DOI] [PMC free article] [PubMed] [Google Scholar]
- 21. El Kouhen R., Burd A. L., Erickson-Herbrandson L. J., Chang C. Y., Law P. Y., Loh H. H. (2001) J. Biol. Chem. 276, 12774–12780 [DOI] [PubMed] [Google Scholar]
- 22. Chakrabarti S., Law P. Y., Loh H. H. (1995) Brain Res. Mol. Brain Res. 30, 269–278 [DOI] [PubMed] [Google Scholar]
- 23. Newton A. C. (2001) Chem. Rev. 101, 2353–2364 [DOI] [PubMed] [Google Scholar]
- 24. Smith F. L., Gabra B. H., Smith P. A., Redwood M. C., Dewey W. L. (2007) Pain 127, 129–139 [DOI] [PubMed] [Google Scholar]
- 25. Foster L. J., De Hoog C. L., Mann M. (2003) Proc. Natl. Acad. Sci. U.S.A. 100, 5813–5818 [DOI] [PMC free article] [PubMed] [Google Scholar]
- 26. Macdonald J. L., Pike L. J. (2005) J. Lipid Res. 46, 1061–1067 [DOI] [PubMed] [Google Scholar]
- 27. Xu C., Hong M. H., Zhang L. S., Hou Y. Y., Wang Y. H., Wang F. F., Chen Y. J., Xu X. J., Chen J., Xie X., Ma L., Chi Z. Q., Liu J. G. (2010) J. Cell Sci. 123, 4259–4270 [DOI] [PubMed] [Google Scholar]
- 28. Law P. Y., Loh H. H., Wei L. N. (2004) Neuropharmacology 47, Suppl. 1, 300–311 [DOI] [PubMed] [Google Scholar]
- 29. Haberstock-Debic H., Kim K. A., Yu Y. J., von Zastrow M. (2005) J. Neurosci. 25, 7847–7857 [DOI] [PMC free article] [PubMed] [Google Scholar]
- 30. Wess J. (1997) Faseb J. 11, 346–354 [PubMed] [Google Scholar]
- 31. Gurevich V. V., Gurevich E. V. (2006) Pharmacol. Ther. 110, 465–502 [DOI] [PMC free article] [PubMed] [Google Scholar]
- 32. Cen B., Xiong Y., Ma L., Pei G. (2001) Mol. Pharmacol. 59, 758–764 [DOI] [PubMed] [Google Scholar]
- 33. DeGraff J. L., Gurevich V. V., Benovic J. L. (2002) J. Biol. Chem. 277, 43247–43252 [DOI] [PubMed] [Google Scholar]
- 34. Han M., Gurevich V. V., Vishnivetskiy S. A., Sigler P. B., Schubert C. (2001) Structure 9, 869–880 [DOI] [PubMed] [Google Scholar]
- 35. Lan H., Liu Y., Bell M. I., Gurevich V. V., Neve K. A. (2009) Mol. Pharmacol. 75, 113–123 [DOI] [PMC free article] [PubMed] [Google Scholar]
- 36. Macey T. A., Liu Y., Gurevich V. V., Neve K. A. (2005) J. Neurochem. 93, 128–134 [DOI] [PubMed] [Google Scholar]
- 37. Kozasa T., Gilman A. G. (1996) J. Biol. Chem. 271, 12562–12567 [DOI] [PubMed] [Google Scholar]
- 38. Li J., Xiang B., Su W., Zhang X., Huang Y., Ma L. (2003) J. Biol. Chem. 278, 30219–30226 [DOI] [PubMed] [Google Scholar]
- 39. Métayé T., Gibelin H., Perdrisot R., Kraimps J. L. (2005) Cell Signal. 17, 917–928 [DOI] [PubMed] [Google Scholar]
- 40. Chae J. H., Stein G. H., Lee J. E. (2004) Mol. Cells 18, 271–288 [PubMed] [Google Scholar]
- 41. Gaudillière B., Konishi Y., de la Iglesia N., Yao G., Bonni A. (2004) Neuron 41, 229–241 [DOI] [PubMed] [Google Scholar]
- 42. von Bohlen Und Halbach O. (2007) Cell Tissue Res. 329, 409–420 [DOI] [PubMed] [Google Scholar]


