Abstract
Aims
To investigate the mechanisms underlying the beneficial effect of hypoxia preconditioning (HPC) on mesenchymal stromal cells (MSCs) and optimize novel non-invasive methods to assess the effect of biological interventions aimed to increased cell survival.
Main methods
MSCs from rat femur, with or without HPC, were exposed to hypoxic conditions in cell culture (1% O2 for 24 h) and cell survival (by the LDH release assay and Annexin-V staining) was measured. Oxidant status (conversion of dichloro-fluorescein-DCF- and dihydro-ethidium-DHE-, protein expression of oxidant enzymes) was characterized, together with the mobility pattern of cells under stress. Furthermore, cell survival was assessed non-invasively using state-of-the-art molecular imaging.
Key findings
Compared to controls, Hypoxia resulted in increased expression of the oxidative stress enzyme NAD(P)H oxidase (subunit 67phox: 0.05 ± 0.01 AU and 0.48 ± 0.02 AU, respectively, p<0.05) and in the amount of ROS (DCF: 13 ± 1 and 42 ± 3 RFU/µg protein, respectively, p<0.05) which led to a decrease in stem cell viability. Hypoxia preconditioning preserved cell biology, as evidenced by preservation of oxidant status (16 ± 1 RFU/µg protein, p<0.05 vs. hypoxia), and cell viability. Most importantly, the beneficial effect of HPC can be assessed non-invasively using molecular imaging.
Significance
HPC preserves cell viability and function, in part through preservation of oxidant status, and its effects can be assessed using state-of-the-art molecular imaging. Understanding of the mechanisms underlying the fate of stem cells will be critical for the advancement of the field of stem cell therapy.
Keywords: Hypoxia preconditioning, Mesenchymal stromal cells, Hypoxia, Molecular imaging, Firefly luciferase
Introduction
Cellular therapy has appeared as a therapeutic alternative for many disease states. The main objective of the field of regenerative medicine using stem cells is to reconstitute the damaged organ. Among the many options in types of cells to be used, mesenchymal stromal cells (MSCs) have attracted significant attention, in part due to their multilineage potential (Pittenger et al. 1999; Pittenger and Martin 2004) and because they appear to be devoid of immune response (Gerdoni et al. 2007; Krampera et al. 2003; Rossignol et al. 2009).
Despite significant advances in the field of stem cells, significant questions remain regarding the biology of stem cells (Engelmann and Franz 2006; Welt and Losordo 2006). Almost invariably, transplanted cells undergo significant cell death, which could significantly hamper the potential benefit of cell transplantation. In this respect, strategies targeted to increase the survival of stem cells have attracted significant attention. Furthermore, a better understanding of the mechanisms underlying the poor cell viability experienced by stem cells in situations of stress may lead to better therapeutic strategies aimed at increasing stem cell survival.
Several different therapeutic strategies have been developed with the goal of improved stem cell survival. Previous studies have shown that cells that over-express survival genes (Gnecchi et al. 2005; Gnecchi et al. 2006; Urbinati et al. 2005) or angiogenic factors (Azarnoush et al. 2005) have better cell survival capacity after transplantation. However, these interventions are complex and include genetic engineering of stem cells, what may lead to unwanted alterations in cell biology. Thus, interest has been placed on physiological maneuvers that can endogenously stimulate an increased survival of stem cells. For quite some time ischemic preconditioning of tissue has also been shown to preserve tissue that undergoes ischemia. Thus, it is reasonable to propose that ischemic preconditioning of stem cells may result in improved survival of stem cells in situations of stress. In fact, a few studies have shown that hypoxia preconditioning (HPC) of stem cells increases expression of pro-survival genes such as Akt and is associated with better stem cell survival (Wang et al. 2008). However, the biological mechanisms underlying the benefit of hypoxia preconditioning on stem cell biology remain to be elucidated.
One of the major factors associated with cell stress/death is that of increased oxidative stress. Increased oxidative stress results from an imbalance between pro-oxidants and antioxidants substances and has been demonstrated when cell/tissue is under stress (Griendling and Alexander 1997; Griendling and FitzGerald 2003). In states of increased oxidative stress, there is an increase in the amount of reactive oxygen species (ROS), what will lead to impaired cell biology, leading to decreased cell viability (Epperly et al. 2004; Suzuki et al. 2004; Wang et al. 2009). Whether there is a relationship between the benefit seen with HPC and alterations in oxidant balance remains unclear.
The ultimate goal of regenerative medicine is the use of stem cells in the living subject. To accurately assess stem cell survival in the living subject, it is imperative that a non-invasive imaging strategy is used. Novel developments in non-invasive imaging have allowed us to study transgene expression and the biology of cell therapy, using imaging modalities such as bioluminescence imaging (BLI) (Contag and Ross 2002; Negrin and Contag 2006; Shah et al. 2004; Wu et al. 2004). Our laboratory has previously demonstrated that cell survival can be monitored longitudinally (Rodriguez-Porcel et al. 2005).
Thus, we tested the hypothesis that preservation of oxidant status is responsible, at least in part, for the effect of HPC on the preservation of cell survival. Furthermore, we postulate that the beneficial effects of HPC can be detected using a molecular imaging strategy.
Material and methods
Experimental design
First, MSCs were obtained from rat femur and characterized using Fluorescent Activated Cell Sorting (FACS). Subsequently, cells were divided into three groups: control (21% O2), hypoxia (1%O2, 4%CO2, and 95%N2), and Hypoxia + HPC. HPC protocol consisted on 2 sets of hypoxia (15 min, 1%O2) and reoxygenation (30 min, 21%O2), prior to hypoxic challenge. Hypoxia was achieved by placing cells in Modular Incubator Chamber (Billumps-Rothenberg; Del Mar, CA) that was flushed with a mixture of 1%O2, 4%CO2, and 95%N2, confirmed by an infrared gas analyzer (Novametrics, Wallingford, CT). Cell viability, oxidative stress, survival genes, mobility assay, molecular imaging were performed after 24 h of hypoxic challenge (or controls). Treatment refers to HPC. We have also performed cell viability studies in control and hypoxia up to seven days.
Isolation of MSCs
MSCs were harvested from Sprague-Dawley rats following previously described protocols (Lennon and Caplan 2006a, b). Briefly, Sprague-Dawley rats were euthanized with CO2, the femurs removed aseptically and placed on ice in medium (minimum essential medium-MEM- alpha containing 20% fetal bovine serum -FBS-, 1% penicillin/streptomycin and 25 ng/ml amphotericin B, Gibco, Carls-bad, CA). The bones were transferred to a sterile culture hood, the ends removed and the bone marrow is flushed from each piece with approximately 5 ml medium using a sterile syringe and 19 g needle and passed through a 70 µm cell strainer (BD Biosciences, San Jose, CA). The filtered material was centrifuged at 1000 rpm for 5 min at 4 °C, resuspended in fresh medium and plated into 10 cm dishes and placed in a humidified incubator at 37 °C with 5% CO2. Medium was changed after 24–48 h attachment period, and every 2–3 days thereafter until passage 5. At that time, cells were characterized by FACS and used for the study.
Characterization of MSCs
FACS was performed using standard protocols (Rosova et al. 2008; Sotiropoulou et al. 2006). MSC were trypsinized and resuspended in phosphate buffered saline -PBS- and blocked with 10% donkey serum in PBS for 15 min. Cells were then labeled with hamster anti-rat CD 29, mouse anti-rat CD11b/c and mouse anti-rat CD90 conjugated to APC (BioLegend, San Diego, CA, 5 µl/million cells) and mouse anti-rat CD45 conjugated with FITC (AbD Serotec, Raleigh, NC, 10 µl/million cells) with gentle rocking at 4 °C for 45 min (Schrepfer et al. 2007; Sotiropoulou et al. 2006; Zangi et al. 2006). Cells were washed once with PBS and then fixed with formalin. Isotype IgG controls were used as negative controls for each antibody. Data was collected from 1.5 × 10⁵ cells on FACSCalibur flow cytometer (BD Biosciences, San Jose, CA) and analyzed by WinMDI software. For further cell characterization we performed double staining for FACS, where all the CD29+ cells were FACS for CD90 and vice versa.
Role of hypoxia on cell viability
Cell viability was measured with the lactate dehydrogenase (LDH) release assay (CytoTox 96 Non-radioactive assay, Promega, Madison, WI) using manufacturer's instructions. Briefly, cells were grown in medium supplemented with heat-inactivated serum (2 × 10⁴ cells per well, n = 8). After the hypoxic challenge, an aliquot of medium from each well was transferred to an assay plate, cells lysed by freeze–thaw, and an aliquot of each lysate transferred to the assay plate. Substrate mix was added to the samples in the assay plate and incubated in the dark at room temperature for 30 min, then stop solution was added and the Absorbance at 490 nm was measured. After subtracting background absorbance of cell-free medium, total LDH released into medium and total cellular LDH were calculated and results were expressed as percentage of total cellular LDH released into medium.
A second measure of cell viability was performed using the FACS for Annexin-V (Geft et al. 2008; Shimony et al. 2008), using the Annexin V-FITC Apoptosis Kit from Abcam. Cells were trypsinized in 0.25% trypsin for 5 min and resuspended in medium containing serum to neutralize trypsin. Medium and all washes were retained and centrifuged with cells for 5 min at 1200 rpm. Cells were then resuspended in 500 ul binding buffer and incubated with 5 ul Annexin V-FITC antibody in the dark for 15 min at room temperature. Following a single rinse in PBS unfixed cells were analyzed by FACS for FITC staining on a FACSCalibur flow cytometer (BD Biosciences, San Jose, CA). Data was analyzed by WinMDI software.
Assessment of oxidative stress
The production of endogenous oxidative stress by-product hydrogen peroxide (H2O2) was assessed using the conversion of 2′,7′-dichlorodihydrofluorescein diacetate (DCHFDA, Molecular Probes, Eugene, OR) (Ksiazek et al. 2006). After hypoxia or control conditions, cells were exposed to DCHFDA (5 µM/L) in DMEM (10% FBS) for 30 min at 37 °C. To measure the catalase-inhibitable fractions of dichlorofluorescein (DCF) fluorescence, a separate group of cells were incubated with 25 units of catalase (Worthington Biochemical, Lakewood, NJ) prior to exposure to DCHFDA. For quantification of H2O2 production, cells from the different groups were lysed using passive lysis buffer (Promega, Madison, WI). The cell lysate was removed and centrifuged at 4 °C at 13,000 rpm for 15 min, and the DCHFDA fluorescence in the supernatant was read with an excitation wavelength of 488 nm and emission at 510 nm on a Spectramax Gemini EM (Molecular Devices, Sunnyvale, CA, USA) plate reader. To normalize fluorescence per cell, protein was determined by Bradford (BioRad, Hercules, CA, USA) following manufacturer's directions. Fluorescence was corrected for background signal and normalized for protein content, and expressed as fluorescence/µg of protein.
To provide another measure of oxidative stress, the production of ROS was measured by the conversion of Dihydroethidium (DHE) to Ethidium (Herrmann et al. 2007; Lim et al. 2005; Yang et al. 2007). To measure the superoxide dismutase (SOD)-inhibitable fractions of DHE fluorescence, a separate group of cells were incubated with 25 units of erythrocyte Mn–SOD (Sigma-Aldrich, St. Louis, MO) prior to exposure to DHE. Briefly, cells were rinsed with PBS, and a solution of 5 µM DHE (Invitrogen, Carlsbad, CA) in PBS was then added to each well and incubated at 37 °C for 30 min. to allow for the conversion of the DHE, a process that is mediated by ROS (Esterhazy et al. 2008; Honjo et al. 2008; Morten et al. 2006). After 1, cells were fixed with 4% paraformaldehyde and counterstained for 5 min with 4′,6-diamidino-2-phenylindole (DAPI), coverslips were mounted with ProLong Gold (Invitrogen, Carlsbad, CA) and visualized on a Zeiss Axiovert LSM 510 inverted confocal fluorescent microscope (Carl Zeiss, Inc., Oberkochen, Germany, excitation: 480–530 nm and emission: 567–610 nm). DHE fluorescence was analyzed with ImageJ (NIH, Bethesda, MD) using a minimum of 10 representative images from each well, 4 wells per group (n = 40 in each group). The threshold for each individual image was obtained (to minimize noise and increase signal to noise ratio) and % area of field showing red fluorescence (after threshold correction) was calculated for each image. DAPI stained nuclei were counted manually for each image and the % area was normalized by dividing by the number of nuclei in each field (to reflect the amount of staining per cell).
Western blotting
Western blotting was performed following standard protocols (Chade et al. 2005; Chade et al. 2004). Equal amounts of cell lysates (25 µg protein) were loaded onto 10% PAGE gels, electrophoresed for 90 min at 90 V in Tris–glycine–SDS buffer, then transferred to PVDF membranes in Tris–glycine–SDS–20% methanol at 100 V for 1 h in a semi-dry transfer on a Hoefer TE70X unit (Hollister, MA) for 1 hr at 60 mAmps constant current. Membranes were blocked for 1 h in Tris–Buffered Saline Tween-20 (TBST) containing 5% milk (TBST:milk) followed by overnight incubation on rocker at 4 °C with primary antibody diluted in TBST:milk. β-actin was used as the loading control (Abcam, Cambridge, MA, 1:2000). Following incubation with primary antibody, membranes were washed once for 5 min, then 3 times for 10 min each in TBST and then incubated on rocker for 1 h at room temperature with horseradish peroxidase conjugated secondary antibody diluted 1:5000 in TBST:milk. Wash steps were repeated as above, and then membranes were incubated for 5 min. with Super-Signal West Pico chemiluminescent substrate per manufacturer's instructions and imaged by a 5 minute (or 15 second for β-actin) film exposure. Band densities were analyzed by ImageJ and normalized to corresponding β-actin band densities.
Oxidative stress
Antibodies used included NAD(P)H oxidase p47phox and NAD(P)H oxidase p67phox, Mn–SOD, Cu and Zn–SOD (dilution for NAD(P)H subunits 1:250, dilution for Mn– and CuZn–SOD 1:500, all from Santa Cruz Biotechnology, Santa Cruz, CA), catalase (dilution 1:500, Epitomics, Burlingame, CA).
To ensure that hypoxia was obtained the expression of hypoxia inducible factor 1-α (HIF 1-α, 1:250, Abcam, Danvers, MA) was measured.
Survival/apoptosis
Antibodies used included survivin, Akt, bax and bcl-2, phosphor-ylated Akt (serine-453, 1:200), p38MAPK, ERK ½ and PI3K/PTEN (PTEN is an inhibitor of PI3K and Akt, all dilutions 1:1000, all from Cell Signaling Inc., Danvers, MA).
Mobility assay
The mobility assay is based on the migration of cells in response to a certain stimulus/condition (Annabi et al. 2003; Rosova et al. 2008). To prevent cell proliferation, thymidine (10 µM, Sigma, St. Louis, MO) was added to standard medium. A defined area of the plate was cleared of MSCs by scraping using a 20 µl pipette tip, prior to the hypoxic challenge. After 24 h, cells were fixed in 4% paraformaldehyde and covered with PBS for imaging (Apotome with 10× magnification). A total of 5 images were obtained for each well from 5 replicate wells per treatment. The average number of cells migrating per field was calculated for each well, and the mean and SD were then calculated from the averages of replicate wells.
Molecular imaging
To further characterize the effect of HPC in hypoxia and to corroborate that reporter genes can be used to evaluate the effect of modulation of the microenvironment on cell survival we assessed cell viability with BLI using a charge cooled coupled device (CCD) camera. We have previously shown that light emission correlates with the number of cells (Rodriguez-Porcel et al. 2005), so it can be used as a measure of number of viable cells and thus cell survival.
Briefly, MSCs cells were plated in 12 well-plates (7 × 10⁴ per well) and 24 h later transfected with a plasmid consisting of the Ubiquitin promoter driving the reporter gene firefly luciferase (fluc). Cells from the experimental groups were placed in hypoxia following the protocol described above, and compared to control. After 24 h of either hypoxia or control conditions, medium was removed from all wells, and 1 µg/mL of D-luciferin was added to each well for 5 min. Plates were imaged with a CCD camera in a 1 minute-medium Sensitivity acquisition format, and detected light was measured as maximal radiance (in photons/s/cm2/sr). Experiments performed in tetraplicates.
Statistical analysis
Data are given as means ± SEM. Comparisons were performed using unpaired Student t-test of unequal variance. Statistical significance was accepted for p<0.05.
Results
MSC isolation/FACS characterization
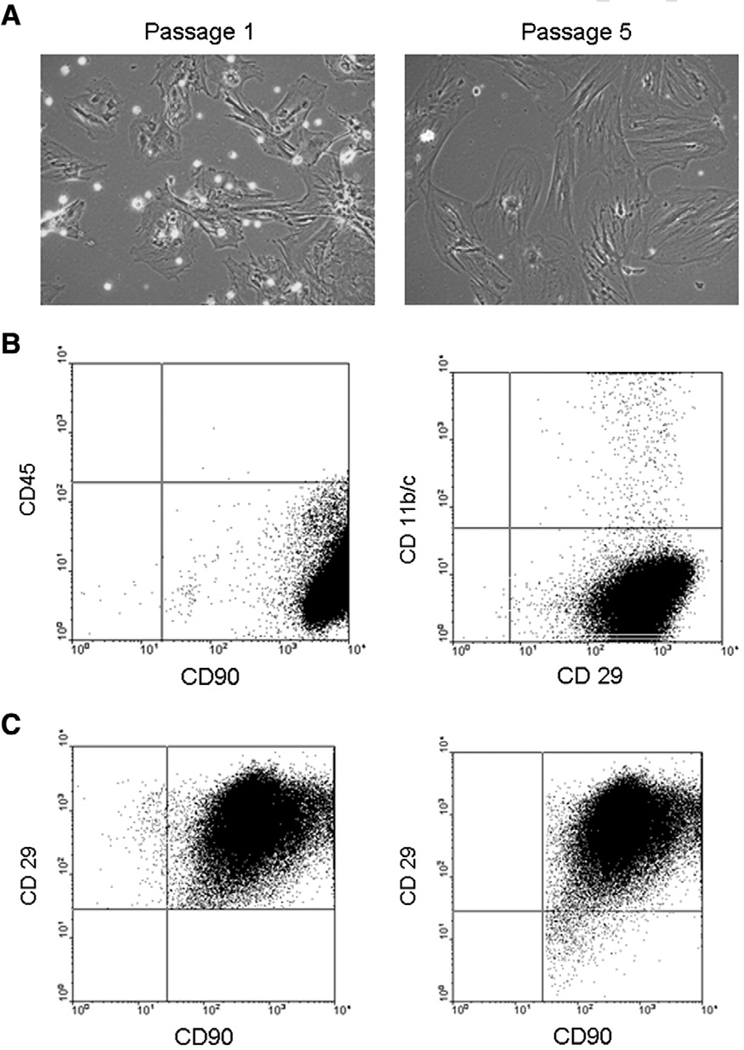
Shortly after harvesting, the adherent cell population was comprised of a mixture of MSCs, hematopoietic stem cells (HSCs) and macrophages (Fig. 1A left). After several passages (5), a mostly homogenous cell population remained attached (Fig. 1A right). FACS analysis at passage 5 showed the cells were negative for CD45 (99.68% were not of hematopoietic origin) and CD11b/c (99.14% were not macrophages), and positive for CD29 and CD90 (96.62 and 99.98%, respectively, as characteristic for MSCs, Fig. 1B) (Rosova et al. 2008; Schrepfer et al. 2007; Sotiropoulou et al. 2006; Zangi et al. 2006). This data was further confirmed by the double FACS studies (Fig. 1C), in which 99.96% of the CD29+ cells were also CD90+ (Fig. 1C) and 99.96% were CD45−, and 98.85% of CD90+ cells were also CD29+ (Fig. 1C). This characterization was obtained at passage 5, and thus cells from that passage were used for this study.
Fig. 1.
A, representative histology of rat mesenchymal stromal cells (MSCs) over time showing how, with increasing passages, cell population becomes more purified and devoid of hematopoietic stem cells (HSCs) and macrophages (rounded cells in passage 1). B, Fluorescent Activated Cell Sorting (FACS) analysis of MSCs (at passage 5) that are CD45− (thus not of hematopoietic origin), CD11b/c− (thus not macrophages) and CD90+ and CD29+, as characteristic for MSCs. C, Double staining FACS analysis: left, all CD29+ cells were stained for CD90 and right, all CD90+ cells were stained for CD29.
Effect of hypoxia on cell viability and survival
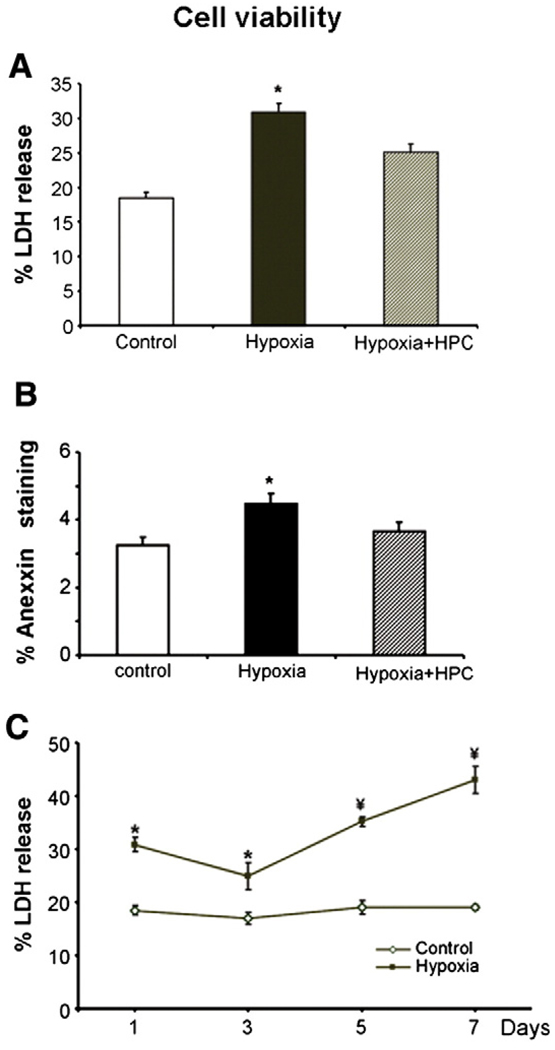
As expected, a hypoxic microenvironment resulted in decreased cell viability (as assessed by the LDH release) at the short term (24 h, Fig. 2A). Hypoxia preconditioning was associated with an activation of HIF 1-α (control: 0.2 ± 0.08, HPC: 0.7 ± 0.1, p<0.05 vs. control) providing evidence of the powerful stimuli of the hypoxic stimuli. HPC resulted in partial preservation of cell viability (Fig. 2A). Effects of hypoxia of cell viability and beneficial effect of HPC were confirmed by Annexin-V FACS staining (Fig. 2B).
Fig. 2.
Cell survival was assessed by the LDH release assay (panel A) and the FACS staining for Annexin-V (panel B) under hypoxic conditions (1% O2, 4% CO2, 95%N for 24 h), in cells with and without hypoxic preconditioning (HPC). In panel C, cell viability was assessed (using the LDH assay) with longer exposure to hypoxia. Hypoxia resulted in decreased survival of MSCs, while HPC cells had increased survival compared to untreated cells. Longer hypoxic exposure resulted in further decreases in cell viability. *p<0.05 compared to control and Hypoxia + HPC.
Interestingly, hypoxia resulted in an increase in cell death (Fig. 2A), which was tempered by day 3 (Fig. 2C, probably suggesting that those cells that survived were better prepared). However, a continued hypoxic state resulted in further cell death (Fig. 2C).
Assessment of oxidative stress
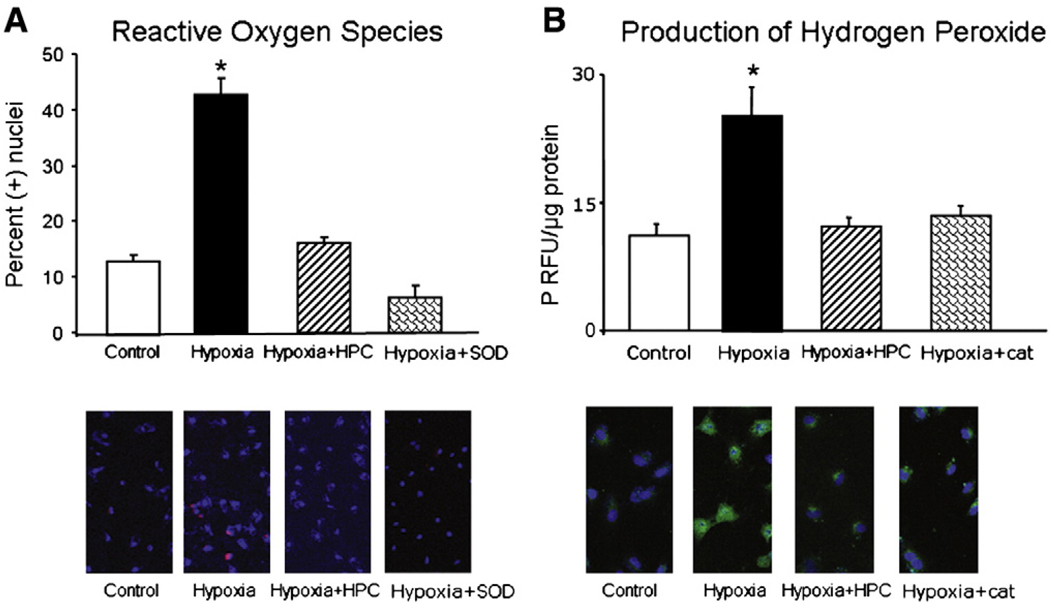
Then, we assessed whether hypoxic conditions led to increases in oxidative stress, compared to control conditions. Cells under control conditions demonstrated low levels of the oxidative stress markers DCHFDA and DHE (Fig. 3A and B, respectively). In response to hypoxia, however, there was an increase in fluorescence to DCHFDA and DHE, suggesting that hypoxia leads to a pro-oxidant status with an increase in the amount of ROS, an effect that was blocked when cells were pre-incubated with catalase and superoxide dismutase (SOD), respectively (Fig. 3A and B), providing evidence that the DCF and DHE signal specifically relates to increased oxidative stress. However, in cells pre-treated with HPC the amount of oxidative stress markers was significantly lower than untreated cells exposed to prolonged hypoxia and not different from cells under control conditions (Fig. 3A and B), indicating that HPC preserved the oxidant balance under prolonged hypoxia.
Fig. 3.
Assessment of oxidative stress. A, top, Representative fluorescence staining of the oxidative stress conversion of 2′,7′-dichlorodihydrofluorescein diacetate (DCHFDA); bottom, Fluorescence quantification of the presence of DCF (expressed as fluorescence/µg protein). B, top, Representative fluorescence staining of the oxidative stress conversion of Dihydroethidium (DHE); bottom, Quantification of the percent area where ethidium staining was present, normalized by the number of nuclei in each microscopic field analyzed. Hypoxia led to increased oxidative stress (increased ethidium and DCF) which was prevented by HPC. * p<0.05 compared to control, Hypoxia + HPC, and Hypoxia + HPC + catalase/superoxide dismutase (SOD).
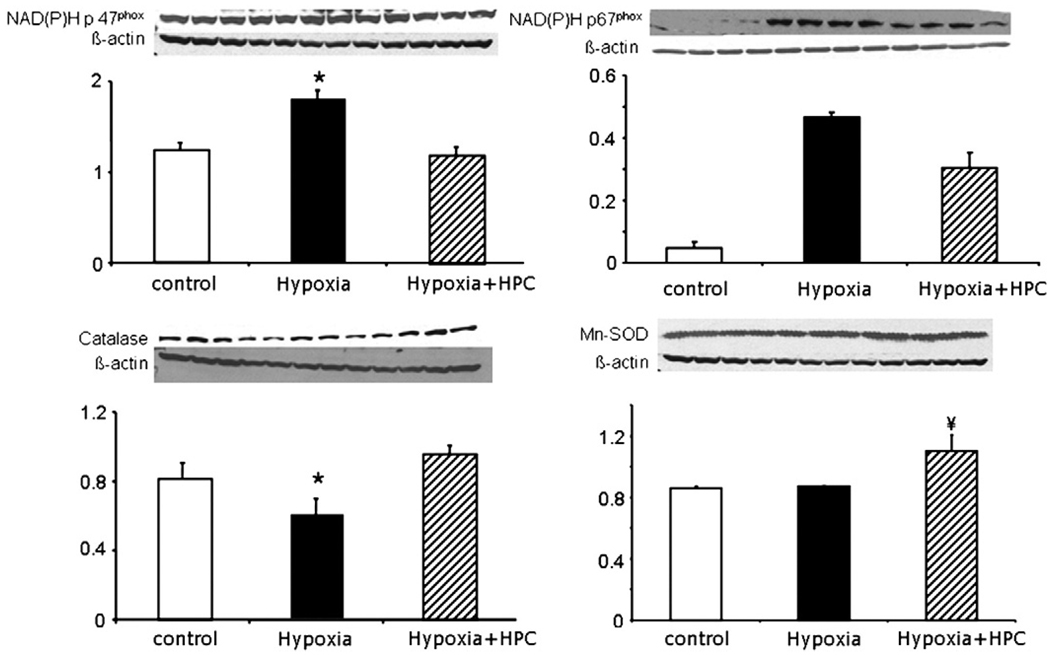
To understand whether the increase in oxidative stress was related to a decrease in ROS metabolism or an increase in oxidative stress production, we assessed the protein expression of one of the main ROS producers (NAD(P)H oxidase) and found that under hypoxia, cells had an increase in the expression of NAD(P)H oxidase subunits p47phox, and p67phox, while the expression of catalase was reduced (Fig. 4). Furthermore, in MSCs that underwent HPC, the level of NAD(P)H oxidase and its subunits as well as catalase were normalized. Hypoxic challenge did not alter the expression of the endogenous scavenger enzyme manganese–SOD (Mn–SOD, Fig. 4). Interestingly, after HPC, the expression of SOD was even higher than normal levels, suggesting that the cell is trying to restore its oxidant balance.
Fig. 4.
Assessment of oxidative stress. Protein expression bands and densitometric analysis of NAD(P)H subunits p67phox and p47phox, the endogenous scavenger enzymes catalase and manganese–SOD (Mn–SOD). Under hypoxic conditions, there was increased protein expression of NAD(P)H p67phox and p47phox and a decrease of the expression of catalase while the Mn–SOD remained unaltered. All of these resulted in an increase in the presence of reactive oxygen species suggesting a pro-oxidant state, what was prevented by HPC. *p<0.05 compared to control and HPC, ¥ p<0.05 compared to control and hypoxia.
Assessment of survival and apoptosis
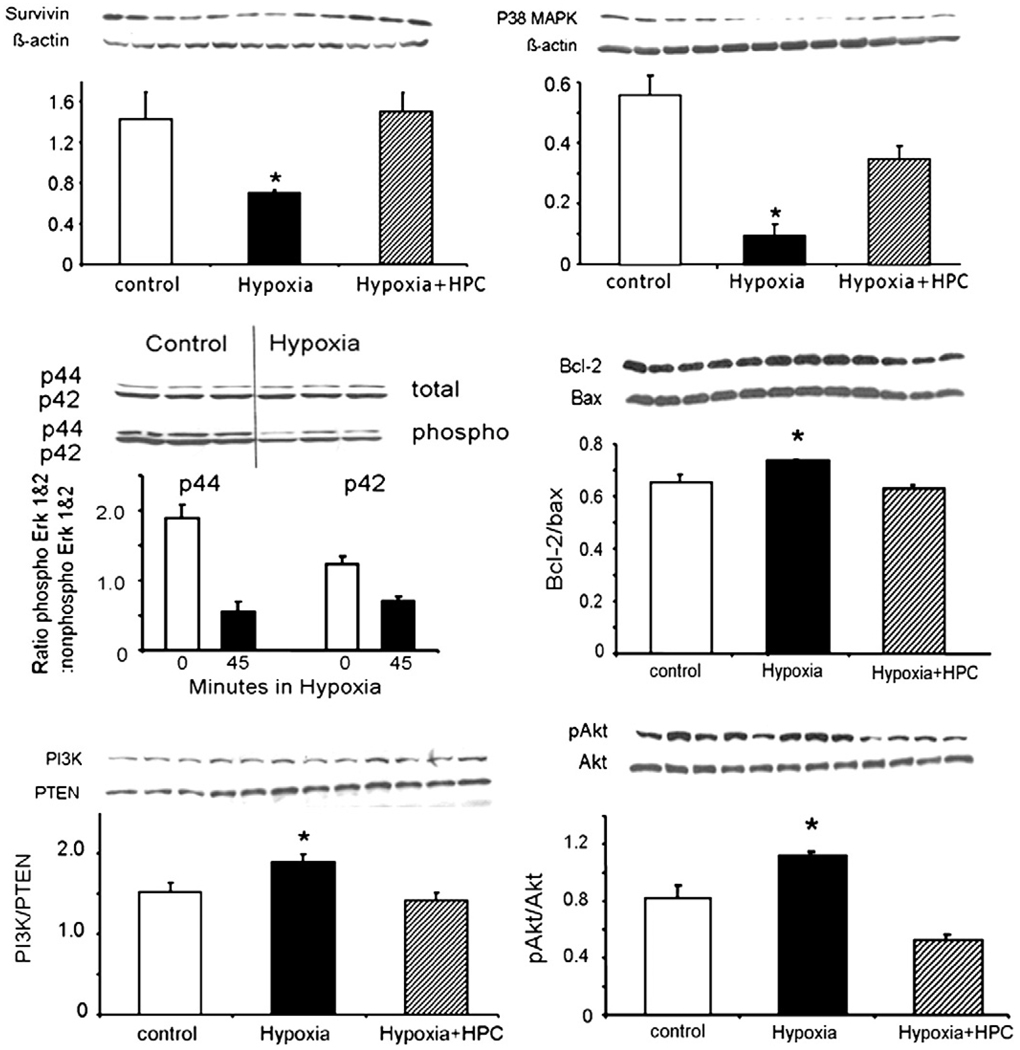
Hypoxia induced a decreased in the protein expression of the survival protein survivin and p38MAPK (Fig. 5 top). Importantly, HPC preserved these changes and the expression pattern of survivin and MAPK were similar to control MSCs and significantly different from hypoxic, un-conditioned cells (Fig. 5 top).
Fig. 5.
Survival and apoptosis. Protein expression bands and densitometric analysis of the survival genes survivin, phosphorylated Akt/total Akt (top), phospho/non-phospho ERK 1–2 and bcl-2/bax (middle), and p38MAPK and PI3K/PTEN (bottom). Under hypoxia, there was a decrease of survivin and a mild increase in the phosphorylated Akt/total Akt ratio, changes that were prevented by HPC. Hypoxia also decreased the ratio of ERK 1–2 and increased the protein expression of bcl-2/bax. Lastly, hypoxia modulated the expression of p38MAPK and PI3K/PTEN. *p<0.05 compared to control and Hypoxia + HPC, ¥ p<0.05 compared to control.
Hypoxia was associated with an increase in apoptosis, as evidenced by Annexin-V (Fig. 2B) and changes in the bcl-2/bax ratio (Fig. 5 middle). Interestingly, the phospho/non-phospho ERK 1–2 ratio was decreased after 6 h of hypoxia (Fig. 5 middle), but levels return to normal at 24 h (data not shown), underscoring the dynamic nature of the changes. Hypoxia also modulated the activation of PI3K and its inhibitor PTEN and pAkt/Akt (Fig. 5 bottom).
Mobility assay
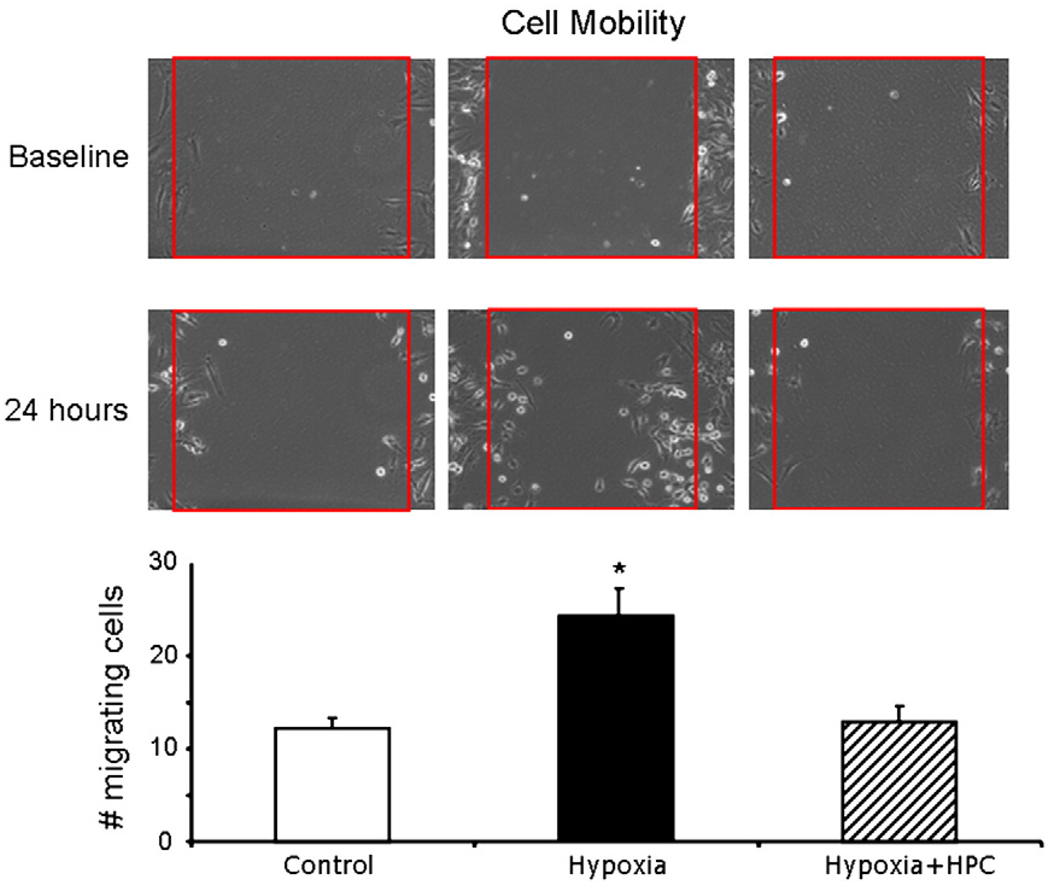
MSC mobility was analyzed over 24 h. Under control conditions, there was minimal mobility of MSCs (Fig. 6 left). When cells were exposed to hypoxia, there was a significant increase in mobility of MSC (Fig. 6 middle), possible suggesting an adaptation mechanism of the MSC to a stress situation. However, in HPC-MSCs, prolonged hypoxic challenge did not alter the mobility pattern, which was similar to the control cells and significantly different from the hypoxic, untreated MSCs (Fig. 6 right).
Fig. 6.
Cell mobility. Top, representative mobility of MSCs under control (left), hypoxia (middle), and hypoxia + HPC (right). Bottom, quantification of the mobility of MSCs under these conditions. Under hypoxia, there is increased mobility of MSCs, which is prevented by HPC. Red square demarcates the area where cells were cleared at baseline. *p<0.05 compared to control and Hypoxia + HPC.
Molecular imaging
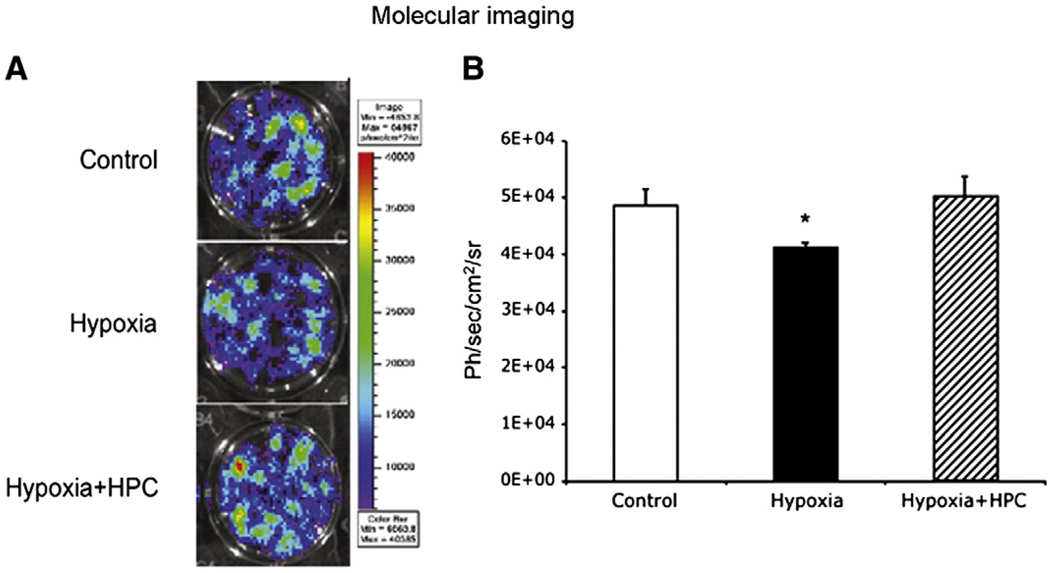
When MSCs-fluc cells were exposed to hypoxia, they had a decrease in cell survival evidenced by a decrease in detected light that was significantly different from controls (Fig. 7). However, in HPC-MSCs the maximal radiance (as a measure of viability) was significantly higher than untreated MSCs and similar to controls. Similar to what was observed by ex-vivo techniques molecular imaging showed that hypoxic preconditioning leads to preservation of cell viability under hypoxia (Fig. 7).
Fig. 7.
Molecular imaging of cell survival in hypoxia. Cell survival assessment was based on reporter gene-light emission and detection using Bioluminescence Imaging and a charge coupled device camera. Hypoxia leads to a decrease in cell survival (assessed in ph/s/cm2/sr) and HPC preserved cell survival (in a prolonged hypoxic challenge) compared to untreated cells. These studies corroborated the results obtained using the LDH release assay (more traditional method for the assessment of cell viability) but most importantly, demonstrate that reporter genes can be used to assess cell survival in-vivo, underscoring the importance of translating these monitoring strategies to the living subject. *p<0.05 compared to control and hypoxia + HPC.
Discussion
The main findings of this study are: 1) the beneficial effect of HPC involves normalization of the oxidant balance and 2) the beneficial effect of HPC can monitored using molecular imaging.
In the current study we chose to use MSCs due to their therapeutic potential in regenerative medicine. For MSC isolation and characterization we used the accepted method of plastic adherence and FACS analysis, respectively. However, we cannot exclude the presence of small number of other cell types (e.g., fibroblasts, pre-adipocytes, etc). Importantly, in this study we corroborate previous observations that MSCs undergo significant stress and cell death under hypoxic conditions (Xu et al. 2008; Zhu et al. 2006), and expand these observations by showing an association with an increase in oxidative stress. Increased oxidative stress is an imbalance between pro-oxidants and anti-oxidants, which can lead to deleterious effects on cell biology and survival (Griendling and Alexander 1997; Griendling and FitzGerald 2003). Depending on the pathophysiological state, a pro-oxidant state can be characterized by either an increase in pro-oxidants or a decrease in anti-oxidants, or a combination of both acting in concert. In our study, we observed that prolonged hypoxia triggered a significant increase in pro-oxidants, like the ROS producer NAD(P)H oxidase subunits p67phox and p47phox, leading to an increase in ROS (evidence by the conversion of DCHFDA and DHE), that was associated with a decrease in cell survival (evidence by LDH release and Annexin). Because oxidative status is a delicate balance between pro- and anti-oxidants, from our study we cannot exclude the possibility that milder changes in oxidant status may even have had beneficial effects for the survival and biology of stem cells, as suggested by other groups (Ushio-Fukai and Urao 2009). In our study also showed that the metabolism of ROS was also impaired (or at least not sufficient), evidenced by a decrease in the expression of the anti-oxidant enzyme catalase, a major metabolizer of ROS, while the levels of SOD and its subunits were unaltered by the hypoxic challenge. A decrease in the endogenous scavenger enzyme catalase will not allow for the metabolism of H2O2, leading to further intracellular accumulation of H2O2, with deleterious effects to the cell.
In the current study, we confirmed previous observations that hypoxia activates many survival and stress pathways. Our results are in-line with previous observations on the hypoxia-dependent down-regulation of p38MAPK (Ren et al) and the downregulation of the PI3K activity and ERK 1–2 (Xu et al. 2008). Furthermore, we also observed that there was an increase in the expression of the Akt inhibitor PTEN. However, other investigators have reported that hypoxia can increase the expression of p38MAPK and Akt (Kanichai et al. 2008). Different degrees of hypoxia and age of MSCs (senescence) can have a differential effect on the activation of these pathways (Jin et al.; Kanichai et al. 2008).
More importantly, this study shows that HPC can prevent the deleterious effects of prolonged hypoxia. We corroborated that when cells, prior to their exposure to hypoxia, undergo pre-conditioning, they are more prepared to confront the hypoxic challenge. Wang et al has previously shown that HPC can preserve MSC survival (Wang et al. 2008), and suggested that most of the beneficial effect were due to increased expression of “survival genes” like Akt, and bcl-2. However, the involvement of oxidant status in the beneficial effect of HPC was not clear. We extended those observations and show that the beneficial effect of HPC is in part due to preservation of oxidant status. The beneficial effect of HPC on oxidant status was not only preserving those pathways affected by hypoxia, but also “priming” additional endogenous scavenger enzymes like SOD. In other words, pre-conditioning of MSCs with short periods of hypoxia/re-oxygenation, prior to the hypoxic challenge, led to a decrease in pro-oxidant enzymes, as well as an increase in anti-oxidant enzymes, what resulted in low levels (comparable to normal) of ROS. This new balance (with increases in the expression of catalase and SOD) allows the cell to metabolize ROS (such as H2O2) into H2O and O2.
As previously suggested, prolonged hypoxia resulted in an increase in cell mobility (Annabi et al. 2003), possibly through the activation of pro-angiogenic or paracrine pathways targeted to adapt MSCs to survive in a noxious environment. In our study, we confirmed the effects of hypoxia on cell mobility and extended them by showing that HPC restores a mobility pattern similar to the control groups. These findings suggest that when pre-conditioned with HPC, MSCs may not need to activate these pathways. From this study we cannot exclude the possibility that low levels of oxidative stress could have beneficial effects (e.g. increase mobility, hypoxia inducible factor and vascular endothelial growth factor activation). Further studies are needed to better delineate these pathways, and clarify which ones may be needed to optimize cell biology and survival under different conditions.
To accurately assess cell survival after transplantation to the living subject, one needs to use a non-invasive monitoring strategy. For that, we chose to use a molecular imaging approach (reporter gene, based on intact cells) that does not disturb the physiological functions of the transplanted cell. Our laboratory has previously shown that this strategy has the discriminatory capacity to accurately monitor stem cells non-invasively (Rodriguez-Porcel et al. 2005). In the present study we show that molecular imaging can be used to detect changes in cell viability and the effect of different therapeutic strategies (i.e. HPC), and we did so using strategies that can be adapted for its use in the living subject. In the current study, reporter genes were introduced using a transient transfection strategy approach. For long term studies in the living subject, it will be important to integrate the reporter gene DNA stably to the cells chromosome, using either a viral or non-viral approach, as previously shown from our group (Rodriguez-Porcel et al. 2005).
In this study the strategy used for HPC was based on prior experience on the effects of HPC in tissue and on preliminary data obtained in the laboratory. While the HPC protocol used in this study served to prove the concept of the involvement of different biological pathways in the survival of MSCs, it is likely that the beneficial effect of HPC can be optimized. Furthermore, it is likely that different cell types (e.g. MSC, adult resident stem cells, induced pluripotent cells) may have different response to HPC. Thus, future studies should focus on the most optimized HPC protocol for the particular cell of interest.
Conclusion
In the current study we showed that the beneficial effect of HPC is in part due to preservation of oxidant status. Furthermore, we showed that molecular imaging has the potential to be used to monitor these effects non-invasively. Strategies like this one will likely be important to modulate stem cell biology under different pathophysiological conditions and may provide novel therapeutic alternatives targeted to improve cell survival and functionality.
Acknowledgments
This work was supported in part by National Health Lung and Blood Institute R00 HL088048, and the Mayo Clinical Scholarship Program, Mayo Clinic, Rochester, Minnesota.
Footnotes
The authors have disclosed no conflict of interests relating to this manuscript.
References
- Annabi B, Lee YT, Turcotte S, Naud E, Desrosiers RR, Champagne M, et al. Hypoxia promotes murine bone-marrow-derived stromal cell migration and tube formation. Stem Cells. 2003;21(3):337–347. doi: 10.1634/stemcells.21-3-337. [DOI] [PubMed] [Google Scholar]
- Azarnoush K, Maurel A, Sebbah L, Carrion C, Bissery A, Mandet C, et al. Enhancement of the functional benefits of skeletal myoblast transplantation by means of coadministration of hypoxia-inducible factor 1alpha. J Thorac Cardiovasc Surg. 2005;130(1):173–179. doi: 10.1016/j.jtcvs.2004.11.044. [DOI] [PubMed] [Google Scholar]
- Chade AR, Mushin OP, Zhu X, Rodriguez-Porcel M, Grande JP, Textor SC, et al. Pathways of renal fibrosis and modulation of matrix turnover in experimental hypercholesterolemia. Hypertension. 2005;46(4):772–779. doi: 10.1161/01.HYP.0000184250.37607.da. [DOI] [PubMed] [Google Scholar]
- Chade AR, Rodriguez-Porcel M, Herrmann J, Zhu X, Grande JP, Napoli C, et al. Antioxidant intervention blunts renal injury in experimental renovascular disease. J Am Soc Nephrol. 2004;15(4):958–966. doi: 10.1097/01.asn.0000117774.83396.e9. [DOI] [PubMed] [Google Scholar]
- Contag CH, Ross BD. It's not just about anatomy: in vivo bioluminescence imaging as an eyepiece into biology. J Magn Reson Imaging. 2002;16(4):378–387. doi: 10.1002/jmri.10178. [DOI] [PubMed] [Google Scholar]
- Engelmann MG, Franz WM. Stem cell therapy after myocardial infarction: ready for clinical application? Curr Opin Mol Ther. 2006;8(5):396–414. [PubMed] [Google Scholar]
- Epperly MW, Osipov AN, Martin I, Kawai KK, Borisenko GG, Tyurina YY, et al. Ascorbate as a “Redox sensor” And protector against irradiation-induced oxidative stress in 32d cl 3 hematopoietic cells and subclones overexpressing human manganese superoxide dismutase. Int J Radiat Oncol Biol Phys. 2004;58(3):851–861. doi: 10.1016/j.ijrobp.2003.10.022. [DOI] [PubMed] [Google Scholar]
- Esterhazy D, King MS, Yakovlev G, Hirst J. Production of reactive oxygen species by complex i (nadh:Ubiquinone oxidoreductase) from Escherichia coli and comparison to the enzyme from mitochondria. Biochemistry. 2008;47(12):3964–3971. doi: 10.1021/bi702243b. [DOI] [PubMed] [Google Scholar]
- Geft D, Schwartzenberg S, Rogowsky O, Finkelstein A, Ablin J, Maysel-Auslender S, et al. Circulating apoptotic progenitor cells in patients with congestive heart failure. PLoS ONE. 2008;3(9):e3238. doi: 10.1371/journal.pone.0003238. [DOI] [PMC free article] [PubMed] [Google Scholar]
- Gerdoni E, Gallo B, Casazza S, Musio S, Bonanni I, Pedemonte E, et al. Mesenchymal stem cells effectively modulate pathogenic immune response in experimental autoimmune encephalomyelitis. Ann Neurol. 2007;61(3):219–227. doi: 10.1002/ana.21076. [DOI] [PubMed] [Google Scholar]
- Gnecchi M, He H, Liang OD, Melo LG, Morello F, Mu H, et al. Paracrine action accounts for marked protection of ischemic heart by akt-modified mesenchymal stem cells. Nat Med. 2005;11(4):367–368. doi: 10.1038/nm0405-367. [DOI] [PubMed] [Google Scholar]
- Gnecchi M, He H, Noiseux N, Liang OD, Zhang L, Morello F, et al. Evidence supporting paracrine hypothesis for akt-modified mesenchymal stem cell-mediated cardiac protection and functional improvement. FASEB J. 2006;20(6):661–669. doi: 10.1096/fj.05-5211com. [DOI] [PubMed] [Google Scholar]
- Griendling KK, Alexander RW. Oxidative stress and cardiovascular disease. Circulation. 1997;96(10):3264–3265. [PubMed] [Google Scholar]
- Griendling KK, FitzGerald GA. Oxidative stress and cardiovascular injury: part I: basic mechanisms and in vivo monitoring of ros. Circulation. 2003;108(16):1912–1916. doi: 10.1161/01.CIR.0000093660.86242.BB. [DOI] [PubMed] [Google Scholar]
- Herrmann J, Saguner AM, Versari D, Peterson TE, Chade A, Olson M, et al. Chronic proteasome inhibition contributes to coronary atherosclerosis. Circ Res. 2007;101(9):865–874. doi: 10.1161/CIRCRESAHA.107.152959. [DOI] [PubMed] [Google Scholar]
- Honjo T, Otsui K, Shiraki R, Kawashima S, Sawamura T, Yokoyama M, et al. Essential role of noxa1 in generation of reactive oxygen species induced by oxidized low-density lipoprotein in human vascular endothelial cells. Endothelium. 2008;15(3):137–141. doi: 10.1080/10623320802125433. [DOI] [PubMed] [Google Scholar]
- Jin Y, Kato T, Furu M, Nasu A, Kajita Y, Mitsui H, Ueda M, Aoyama T, Nakayama T, Nakamura T, Toguchida J. Mesenchymal stem cells cultured under hypoxia escape from senescence via down-regulation of p16 and extracellular signal regulated kinase. Biochem Biophys Res Commun. 2010;391(3):1471–1476. doi: 10.1016/j.bbrc.2009.12.096. [DOI] [PubMed] [Google Scholar]
- Kanichai M, Ferguson D, Prendergast PJ, Campbell VA. Hypoxia promotes chondrogenesis in rat mesenchymal stem cells: a role for akt and hypoxia-inducible factor (hif)-1alpha. J Cell Physiol. 2008;216(3):708–715. doi: 10.1002/jcp.21446. [DOI] [PubMed] [Google Scholar]
- Krampera M, Glennie S, Dyson J, Scott D, Laylor R, Simpson E, et al. Bone marrow mesenchymal stem cells inhibit the response of naive and memory antigen-specific t cells to their cognate peptide. Blood. 2003;101(9):3722–3729. doi: 10.1182/blood-2002-07-2104. [DOI] [PubMed] [Google Scholar]
- Ksiazek K, Piwocka K, Brzezinska A, Sikora E, Zabel M, Breborowicz A, et al. Early loss of proliferative potential of human peritoneal mesothelial cells in culture: the role of p16ink4a-mediated premature senescence. J Appl Physiol. 2006;100(3):988–995. doi: 10.1152/japplphysiol.01086.2005. [DOI] [PubMed] [Google Scholar]
- Lennon DP, Caplan AI. Isolation of human marrow-derived mesenchymal stem cells. Exp Hematol. 2006a;34(11):1604–1605. doi: 10.1016/j.exphem.2006.07.014. [DOI] [PubMed] [Google Scholar]
- Lennon DP, Caplan AI. Isolation of rat marrow-derived mesenchymal stem cells. Exp Hematol. 2006b;34(11):1606–1607. doi: 10.1016/j.exphem.2006.07.015. [DOI] [PubMed] [Google Scholar]
- Lim SD, Sun C, Lambeth JD, Marshall F, Amin M, Chung L, et al. Increased nox1 and hydrogen peroxide in prostate cancer. Prostate. 2005;62(2):200–207. doi: 10.1002/pros.20137. [DOI] [PubMed] [Google Scholar]
- Morten KJ, Ackrell BA, Melov S. Mitochondrial reactive oxygen species in mice lacking superoxide dismutase 2: attenuation via antioxidant treatment. J Biol Chem. 2006;281(6):3354–3359. doi: 10.1074/jbc.M509261200. [DOI] [PubMed] [Google Scholar]
- Negrin RS, Contag CH. In vivo imaging using bioluminescence: a tool for probing graft-versus-host disease. Nat Rev Immunol. 2006;6(6):484–490. doi: 10.1038/nri1879. [DOI] [PubMed] [Google Scholar]
- Pittenger MF, Mackay AM, Beck SC, Jaiswal RK, Douglas R, Mosca JD, et al. Multilineage potential of adult human mesenchymal stem cells. Science. 1999;284(5411):143–147. doi: 10.1126/science.284.5411.143. [DOI] [PubMed] [Google Scholar]
- Pittenger MF, Martin BJ. Mesenchymal stem cells and their potential as cardiac therapeutics. Circ Res. 2004;95(1):9–20. doi: 10.1161/01.RES.0000135902.99383.6f. [DOI] [PubMed] [Google Scholar]
- Ren H, Accili D, Duan C. Hypoxia converts the myogenic action of insulin-like growth factors into mitogenic action by differentially regulating multiple signaling pathways. Proc Natl Acad Sci U S A. 2010;107(13):5857–5862. doi: 10.1073/pnas.0909570107. [DOI] [PMC free article] [PubMed] [Google Scholar]
- Rodriguez-Porcel M, Gheysens O, Chen IY, Wu JC, Gambhir SS. Image-guided cardiac cell delivery using high-resolution small-animal ultrasound. Mol Ther. 2005;12(6):1142–1147. doi: 10.1016/j.ymthe.2005.07.532. [DOI] [PubMed] [Google Scholar]
- Rosova I, Dao M, Capoccia B, Link D, Nolta JA. Hypoxic preconditioning results in increased motility and improved therapeutic potential of human mesenchymal stem cells. Stem Cells. 2008;26(8):2173–2182. doi: 10.1634/stemcells.2007-1104. [DOI] [PMC free article] [PubMed] [Google Scholar]
- Rossignol J, Boyer C, Thinard R, Remy S, Dugast AS, Dubayle D, et al. Mesenchymal stem cells induce a weak immune response in the rat striatum after allo or xenotransplantation. J Cell Mol Med. 2009 doi: 10.1111/j.1582-4934.2008.00657.x. [DOI] [PMC free article] [PubMed] [Google Scholar]
- Schrepfer S, Deuse T, Lange C, Katzenberg R, Reichenspurner H, Robbins RC, et al. Simplified protocol to isolate, purify, and culture expand mesenchymal stem cells. Stem Cells Dev. 2007;16(1):105–107. doi: 10.1089/scd.2006.0041. [DOI] [PubMed] [Google Scholar]
- Shah K, Jacobs A, Breakefield XO, Weissleder R. Molecular imaging of gene therapy for cancer. Gene Ther. 2004;11(15):1175–1187. doi: 10.1038/sj.gt.3302278. [DOI] [PubMed] [Google Scholar]
- Shimony N, Avrahami I, Gorodetsky R, Elkin G, Tzukert K, Zangi L, et al. A 3d rotary renal and mesenchymal stem cell culture model unveils cell death mechanisms induced by matrix deficiency and low shear stress. Nephrol Dial Transplant. 2008;23(6):2071–2080. doi: 10.1093/ndt/gfn062. [DOI] [PubMed] [Google Scholar]
- Sotiropoulou PA, Perez SA, Salagianni M, Baxevanis CN, Papamichail M. Characterization of the optimal culture conditions for clinical scale production of human mesenchymal stem cells. Stem Cells. 2006;24(2):462–471. doi: 10.1634/stemcells.2004-0331. [DOI] [PubMed] [Google Scholar]
- Suzuki K, Murtuza B, Beauchamp JR, Smolenski RT, Varela-Carver A, Fukushima S, et al. Dynamics and mediators of acute graft attrition after myoblast transplantation to the heart. FASEB J. 2004;18(10):1153–1155. doi: 10.1096/fj.03-1308fje. [DOI] [PubMed] [Google Scholar]
- Urbinati F, Lotti F, Facchini G, Montanari M, Ferrari G, Mavilio F, et al. Competitive engraftment of hematopoietic stem cells genetically modified with a truncated erythropoietin receptor. Hum Gene Ther. 2005;16(5):594–608. doi: 10.1089/hum.2005.16.594. [DOI] [PubMed] [Google Scholar]
- Ushio-Fukai M, Urao N. Novel role of nadph oxidase in angiogenesis and stem/progenitor cell function. Antioxid Redox Signal. 2009;11(10):2517–2533. doi: 10.1089/ars.2009.2582. [DOI] [PMC free article] [PubMed] [Google Scholar]
- Wang JA, Chen TL, Jiang J, Shi H, Gui C, Luo RH, et al. Hypoxic preconditioning attenuates hypoxia/reoxygenation-induced apoptosis in mesenchymal stem cells. Acta Pharmacol Sin. 2008;29(1):74–82. doi: 10.1111/j.1745-7254.2008.00716.x. [DOI] [PubMed] [Google Scholar]
- Wang ZJ, Zhang FM, Wang LS, Yao YW, Zhao Q, Gao X. Lipopolysaccharides can protect mesenchymal stem cells from oxidative stress-induced apoptosis and enhance proliferation of mscs via toll-like receptor(tlr)-4 and pi3k/akt. Cell Biol Int. 2009 doi: 10.1016/j.cellbi.2009.03.006. [DOI] [PubMed] [Google Scholar]
- Welt FG, Losordo DW. Cell therapy for acute myocardial infarction: curb your enthusiasm? Circulation. 2006;113(10):1272–1274. doi: 10.1161/CIRCULATIONAHA.105.613034. [DOI] [PubMed] [Google Scholar]
- Wu JC, Tseng JR, Gambhir SS. Molecular imaging of cardiovascular gene products. J Nucl Cardiol. 2004;11(4):491–505. doi: 10.1016/j.nuclcard.2004.04.004. [DOI] [PubMed] [Google Scholar]
- Xu R, Chen J, Cong X, Hu S, Chen X. Lovastatin protects mesenchymal stem cells against hypoxia- and serum deprivation-induced apoptosis by activation of pi3k/akt and erk1/2. J Cell Biochem. 2008;103(1):256–269. doi: 10.1002/jcb.21402. [DOI] [PubMed] [Google Scholar]
- Yang CS, Lee HM, Lee JY, Kim JA, Lee SJ, Shin DM, et al. Reactive oxygen species and p47phox activation are essential for the mycobacterium tuberculosis-induced pro-inflammatory response in murine microglia. J Neuroinflammation. 2007;4:27. doi: 10.1186/1742-2094-4-27. [DOI] [PMC free article] [PubMed] [Google Scholar]
- Zangi L, Rivkin R, Kassis I, Levdansky L, Marx G, Gorodetsky R. High-yield isolation, expansion, and differentiation of rat bone marrow-derived mesenchymal stem cells with fibrin microbeads. Tissue Eng. 2006;12(8):2343–2354. doi: 10.1089/ten.2006.12.2343. [DOI] [PubMed] [Google Scholar]
- Zhu W, Chen J, Cong X, Hu S, Chen X. Hypoxia and serum deprivation-induced apoptosis in mesenchymal stem cells. Stem Cells. 2006;24(2):416–425. doi: 10.1634/stemcells.2005-0121. [DOI] [PubMed] [Google Scholar]


