

Abstract
Q-space imaging is capable of providing quantitative geometrical information of structures at cellular resolution. However, the size of restrictions that can be probed hinges on available gradient amplitude and places very high demands on gradient performance. In this work we describe the design and construction of a small, high-amplitude (50 T/m) z-gradient coil, interfaced with a commercial 9.4 T microimaging system. We also describe a method to calibrate the coil for quantitative measurements of molecular diffusion at very high gradient amplitudes. Calibration showed linear current response up to 50 T/m, with a gain = 1.255 T/m/A. The z-gradient coil was combined with the commercial x- and y-gradients for tri-axial imaging, and its performance was demonstrated by ADC maps of free water and by q-space experiments on water sequestered around polystyrene microspheres (4.5 μm diameter), which showed the expected diffraction peak. In addition, diffusion-weighted images of a fixed mouse spinal cord illustrated the capability of this coil for quantitative imaging of tissue microstructure.
Keywords: gradient coil, diffusion, NMR microimaging, q-space, spinal cord
1. Introduction
Gradient coil hardware for high field NMR has been commercially available for many years [1], being an essential component of gradient spectroscopy (GRASP) probes [2] and routinely used to characterize liquid diffusion coefficients by pulsed gradient spin echo or stimulated echo methods (PGSE or PGSTE) [3]. This technology often consists of a tri-axial set capable of generating fast-switched, short-duration (< 5 ms) pulses on the order of 1 T/m (100 G/cm) on each axis, with single z-axis coils for larger gradient amplitude (10 T/m) also available. Such tri-axial sets are sufficient for routine diffusion-weighted NMR microimaging of biological samples, but much higher gradient amplitudes are needed for measuring very slow or restricted diffusion at high spatial resolution [4-6]. For this reason, various uni- and tri-axial gradient coils have been custom-designed to generate switched field gradients of 30-50 T/m [4, 7-13], with reported amplitudes as high as 70 T/m [14].
A PGSE technique receiving increased interest is q-space imaging, having potential to provide quantitative information on the geometry of structures at cellular resolution [5, 15, 16]. In q-space NMR, echo attenuation E, due to lost phase coherence from translational diffusion during time Δ, is mapped as a function of  , where q is the Fourier conjugate to molecular displacement, δ and G the duration and amplitude of the (rectangular) diffusion-encoding gradient pulses, and
  the gyromagnetic ratio divided by 2π. The Fourier transform of E(q) is thus a 1D profile of the displacement probability density function, known as the propagator [16]. In systems exhibiting micro-scale regularity, E(q) can exhibit diffraction-like phenomena [6, 17], even when the structures in question are not explicitly resolved, providing an indirect means to quantify the microstructure. Using such a technique could overcome SNR limitations for studying microstructure-function relationships, e.g., in white matter of spinal cord [5, 18] and brain [19, 20], and the size of diffusive restrictions (myelin and axon membranes) that can be probed hinges on achievable gradient amplitude.
It is a challenge to map regional variation of the propagator at high resolution throughout a tissue. The propagator resolution in the displacement domain is determined by 1/(2qmax), where qmax = γδGmax, in analogy to k-space where 1/(2kmax) gives the image resolution. This, together with the condition δ << Δ for the Fourier relationship to hold, puts very high demands on coil performance. For example, to achieve a propagator resolution of 1 μm with δ = 1 ms would require an amplitude Gmax = 11.7 T/m, more than an order of magnitude greater than that of commercially available tri-axial probes. Thus standard NMR microimaging systems are inadequate for high-resolution q-space imaging of mammalian white matter microstructure, for which axon diameters are 1-3 μm [21]. A simple solution, however, consists of a small high-amplitude z-axis gradient coil centered within a standard tri-axial set, and various designs are possible based on a multi-turn Maxwell pair [4, 7, 8, 11, 13].
The gradient amplitude achievable by a coil scales as , where P is the ohmic power density in the coil wires and ρ is the wire resistivity [4], and is not limited by size or number of wire turns but by the tolerable temperature rise. Nevertheless, small gradient coils have advantages, including enhanced current response (high gain), low self inductance (fast rise/fall time), small Lorentz torques (low mechanical vibrations), restricted fringe field (negligible induced eddy currents), and efficient heat dissipation (simple air cooling at moderate duty cycle). However, quantitative diffusion measurements require accurate gradient pulse calibration, which is non-trivial at very high gradient amplitudes. Standard methods often rely on a single measurement of the effective gradient and the assumption of linearity in applied current, but for an untested coil there is a need to directly verify its performance.
To address these challenges, we have constructed a small 50 T/m modified Maxwell pair (the Micro-Z) and connected it to the z-channel of a commercial tri-axial 1 T/m gradient set, using the Micro-Z both for diffusion encoding and for imaging in combination with the x- and y-coils of the commercial set [22]. We also describe here a novel method to directly calibrate very high amplitude gradient pulses [23]. We then demonstrate the capabilities of the calibrated Micro-Z for quantitative microimaging of restricted diffusion by image-based measurements of the apparent diffusion coefficient (ADC) and q-space diffraction of water and by obtaining diffusion-weighted images of a fixed mouse spinal cord.
2. Materials and methods
2.1. Design and construction
Following the design of Callaghan, et al. [4], a support structure for the wires of the Micro-Z gradient coil was made to interface with the RF insert of a commercial 9.4 T vertical-bore (89 mm) NMR microimaging system (Bruker Avance DMX400, with Micro2.5 tri-axial gradients and BAFPA40 amplifiers). A schematic of the support structure (Fig. 1a) shows the Delrin base and phenolic resin posts supporting a horizontal glass tube (o.d./i.d. = 4.0/3.2 mm), which in turn supports a smaller diameter glass sample tube (o.d./i.d. = 3.0/2.4 mm) that can be removed. Both tubes are NMR-grade glass (Wilmad-LabGlass) and were chosen as small as possible to accommodate a mouse spinal cord yet maintain the highest SNR for a 3-turn solenoidal RF coil wrapped on the outer (4 mm) tube and centered between the gradient coil wires. The structure thus establishes orientations in the laboratory frame for the z-gradient and RF excitation fields ( and ) relative to the polarizing field, gradient wire current density and Lorentz force ( and ). The 400 MHz RF coil was made from 1 mm-wide copper foil (100 μm-thick) with 1 mm gaps (Fig. 1b) and connected to variable capacitors (0.4-3.5 pF, non-magnetic Johanson) mounted in the base which interface with the Bruker tuning/matching mechanism. A 50 Ω coax cable runs down the center of the RF probe insert to the preamp. The coil produces a 90° excitation in 13.4 μs using a 50 W square pulse.
Figure 1.


Micro-Z gradient coil: (a) support structure, (b) 3-turn RF coil and gradient wires in epoxy, and (c) wire positions (+) relative to sample tubes. (d) Gradient field homogeneity over the sample region (2.4 mm dia. shaded circle) for a 1 A current, with mean value 1.26 T/m ± 2%.
To create the vertical z-gradient field , enamel-coated copper wire (360 μm dia.) was wound through the holes in each post in four horizontal bundles of 23 strands each, resulting in a coil inductance of 21 μH and a resistance of 1.7 Ω. The wire bundles in this way formed a modified Maxwell pair of elongated loops, creating a homogeneous gradient Gz (= ∂Bz/∂z) along their 3 cm length (Fig. 1b). In Fig. 1c, the positions of the individual gradient wires are shown in the xz-plane, relative to the horizontal sample tubes centered between the wire bundles. Using the Biot-Savart law for an infinite wire and a super-position of magnetic fields from all the wires, a map of the local gradient for this arrangement was calculated for 1 A of current (Fig. 1d). An infinite wire is a reasonable approximation, since the gradient wires extend more than one RF coil length past each end of the RF solenoid. The calculated gradient deviates from uniformity close to the wires, but is highly uniform over the sample region (2.4 mm dia. shaded circle), having a sharply-peaked histogram of mean gradient amplitude 1.26 T/m with a standard deviation ± 2%. Alternative wire arrangements can be explored, with a trade-off between sample space and gradient homogeneity on the one hand, and gradient strength on the other. For our configuration, the centers of the wire bundles were separated by 5.4 mm in both the x and z directions as the minimum practical to provide structural support for the wires while generating high gradient amplitude and good homogeneity.
To provide mechanical stability and restrict Lorentz force vibrations, the entire gradient/RF coil assembly was potted in epoxy (Devcon 2-Ton) (Fig. 1b). For additional vibration damping, it was equipped with a Delrin cover that provided Viton O-ring padding against the walls of the Micro2.5 gradient set bore (39 mm dia.) and permitted Nylon screws to clamp the epoxy-coated coil from both sides. The complete assembly attached to the top of the Bruker RF insert by threaded brass rods, and thus could be positioned at the Micro2.5 isocenter. The Micro-Z was interfaced with the z-channel of the microimaging system by a twisted pair of insulated wires running down the center of the RF insert to the Bruker security fuse box, using the z-channel fuse. The fuse box lid, together with aluminum foil wrapped around the twisted pair, provided a grounded RF shield for the gradient leads.
2.2. Performance optimization
Integration of the Micro-Z with the microimaging system comprised three key elements: 1) gradient coil/amplifier impedance matching for optimal current rise times, 2) z-axis scale factor adjustment for accurate image dimensions, and 3) voltage pre-emphasis adjustment for eddy current compensation. These resulted in an operational z-gradient coil which could be precisely calibrated as described below.
Each 40 A Bruker audio-frequency power amplifier (BAFPA40) has a set of DIP switches on the front panel that permit limited impedance matching to the gradient coil. The switches provide loop compensation, adding fixed values of resistance and capacitance to balance the inductive reactance of the coil. We optimized these empirically by observing the current output of the z-amplifier with an oscilloscope. The current monitor on the back panel of the BAFPA40 outputs a voltage proportional to the actual current applied to the coil (not the ramp voltage from the pulse synthesizer). Representative current wave-forms applied to the Micro-Z, captured from the oscilloscope using LabView software (National Instruments), are shown in Fig. 2 for a nominal gradient of 25 T/m. While impedance mismatch can produce oscillations in the pulse plateau (Fig. 2a), correct matching gives a flat plateau, with rise time trise = 125 μs (Fig. 2b). A hypothetical trapezoidal ramp voltage (dashed line) with no pre-emphasis (120 μs ramp time) closely matches the measured current waveform (solid line) in Fig. 2b.
Figure 2.


Gradient pulse waveforms (≈ 25 T/m) applied to the Micro-Z coil, as captured from the gradient amplifier via LabView. (a) Incorrect loop compensation results in impedance mismatch between amplifier and coil, producing oscillations. (b) Correct impedance matching results in a flat plateau, with rise time trise = 125 μs. A trapezoidal ramp voltage (120 μs ramp time) is superimposed (dashed line).
The Bruker microimaging software (ParaVision2.1) assigns gradient scale factors to each gradient axis: numbers between 0 and 1 that scale the ramp voltage supplied to each gradient amplifier and are used, in addition to a global calibration constant (Hz/cm), to calculate the scaling from the frequency domain to image space. Since the global constant applies to all axes, we used the default value for the Micro2.5 gradient set. This allowed the x- and y-gradient scale factors to remain set to 1 while the z-gradient scale factor initially was set to 0.01984 (= 0.025/1.26), the ratio of the Micro2.5 gradient strength to that predicted for the Micro-Z. In so doing, the z-gradient amplitude in the pulse program must be set to values greater than 100% to produce the full range of z-amplifier current output. The z-axis scale factor was coarsely optimized by acquiring a cross-sectional image of the 2.4 mm dia. cylindrical sample tube filled with water (voxel size = 78×78×500 μm3), using the Micro-Z for frequency encoding and the Micro2.5 x- and y-gradients for phase encoding and slice selection. The z-scale factor was adjusted iteratively until equal vertical and horizontal diameters of the sample tube were measured on the image, resulting in a value of 0.02, but a more accurate value was obtained from the full Micro-Z calibration (see below).
Finally, to compensate for minor residual eddy currents, the ParaVision2.1 pre-emphasis tool was used to determine the amount of voltage pre-emphasis needed and to automatically apply it to every voltage ramp sent to the z-gradient amplifier. The tool uses eight gradient pulses, each followed by a non-selective 90° RF pulse at a different time delay (0.2-200 ms), to generate eight FID’s that are sensitive to eddy currents of different time constants. The tri-exponential pre-emphasis voltage that is applied provides six adjustable parameters to selectively compensate different eddy current components until no signal loss is observed in the FID’s. We found that only eddy currents of the fastest time base (< 200 μs) required significant compensation. These may arise in the copper of the embedded RF solenoid due to its proximity, as the small size of the Micro-Z suggests negligible interaction with metal structures in the surrounding Bruker gradient set or magnet bore.
2.3. Calibration method
A working definition for the calibration of a gradient coil is the accurate determination of the gradient generated by the coil over the complete range of applied current. If determined to be linear, the current response (i.e., the gain) of the coil may be characterized by a single number α, measured in T/m/A. Without assuming linearity, we accomplished a direct calibration of the Micro-Z gradient coil in two steps: (A) a preliminary calibration for low-amplitude gradient pulses (0-4 T/m), and (B) using the results of step A, a calibration for high-amplitude pulses (4-50 T/m). In step A we measured the width of a z-axis projection of a water-filled capillary of known diameter, using a spin echo readout. In step B we measured the 1H NMR echo amplitude from low-diffusivity polyethylene glycol (PEG) dissolved in D2O in the 2.4 mm sample tube. Two z-gradient pulses of opposite polarity were applied prior to the echo, and the second gradient pulse was adjusted until the echo amplitude was maximal. Both steps A and B used a 90°-180° pair of non-selective RF pulses (Fig. 3).
Figure 3.

Pulse sequences for calibration steps A and B.
In calibration step A, the capillary projection width Δν was used to calculate the effective amplitude of the second gradient pulse Gz2 according to  , where
  and Δz is the capillary inner diameter (1.1 mm). Nineteen different z-gradient amplitudes (% gradient strength) were set in the pulse program, and Gz2 was plotted versus current applied to the coil (Fig. 4a). Current was measured on an oscilloscope at the plateau of Gz2, which is constant during the data acquisition window. A gradient gain αA could be calculated for each Gz2, or a single determined from the slope of a linear fit to Gz2 versus current. Step A was limited to a gradient amplitude of about 4 T/m by our system’s largest receiver bandwidth (200 kHz).
Figure 4.


(a) Measured Micro-Z calibration curve for calibration step A (0-4 T/m). Inset shows a typical z-axis projection of the capillary tube and the measurement of its width Δν. (b) Measured Micro-Z gradient waveforms for calibration step B (4-50 T/m). Here Gz1 ≈ 5, 25, 49 T/m, and Δ = δ1. Inset shows equal pulse areas at each Gz1 after adjusting δ2.
In calibration step B, the z-gradient pulse pair between the 90° and 180° RF pulses consisted of a short duration pulse of unknown high-amplitude (Gz1 > 4 T/m) followed by a longer duration pre-calibrated pulse of lower amplitude (Gz2 < 4 T/m). The two gradient pulses were made adjacent to minimize diffusive signal loss. The duration of the first gradient pulse δ1 was held fixed (0.4 ms), and for Gz1 the duration of the second gradient pulse δ2 was adjusted, keeping TE constant and Gz2 fixed (3.8 T/m), until the PEG signal was maximal at . The bulk signal was strong even for the largest Gz1 due to low diffusivity (8 kD PEG at 12.5 w% dilution) and large sample volume. Again nineteen different Gz1 amplitudes were used (5-50 T/m), for which values were found to be 0.568-6.41 ms. To accommodate longer δ2, TR and TE were fixed as needed (1-2.5 s and 12-20 ms, respectively). When the PEG signal was maximal, the waveform of each gradient pulse was recorded via LabView (5000 points) and numerically integrated to obtain its area (Fig. 4b). The area ratio of the two pulses then was used to correct the step A gradient gain to obtain αB, the step B gradient gain, a derivation of which is given below for gradient waveforms of arbitrary shape.
For a sample of spin density ρ(z), with gradient pulses Gz(t) applied along the z-axis, the measured echo signal at TE is given by:
| (1) |
where E0 accounts for receiver sensitivity and intrinsic relaxation, Dz is the z-axis diffusion coefficient,
 |
(2) |
and
 |
(3) |
When the net gradient moment is zero (kz = 0), as for two pulses with equal areas but opposite polarity occurring prior to the echo, E(kz) is maximal in the absence of diffusion. Furthermore, two nearly adjacent (− trise) gradient pulses of opposite polarity will have a combined waveform with zero-crossing at a single mid-point (Tmid), even for non-rectangular pulses of finite rise and fall times. Hence Eq. [3] gives
 |
(4) |
where I1(t) and I2(t) are the current waveforms of the first and second gradient pulses measured on the current monitor. By adjusting δ2, i.e., the area of the second gradient pulse, until the observed echo peak E(kz) is maximal, we obtained αB, the gain at high gradient amplitude:
| (5) |
where Area1 and Area2 are the integrated areas of the current waveforms recorded in LabView. The gain αB then was used to calculate the gradient amplitude Gz1 (> 4 T/m) for each plateau value of applied current. Although no assumption of global linearity need be made in calibration steps A and B, the points from steps A and B can be combined to yield a single gain from a linear fit to Gz versus current.
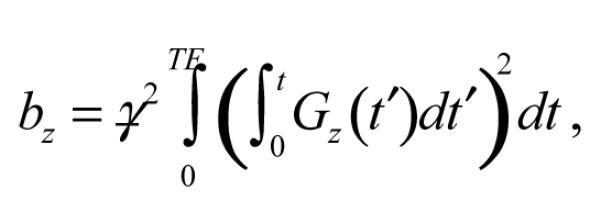
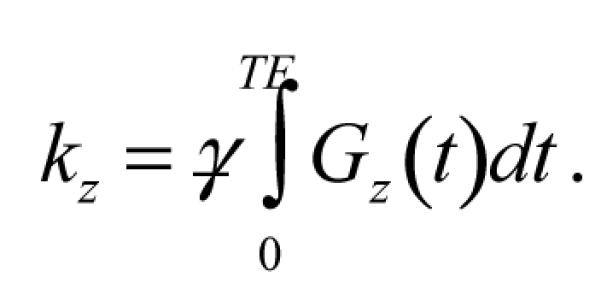
The accuracy of calibration step A was limited by the choice of capillary diameter and the tradeoff between maximizing SNR and keeping Δν less than the largest receiver bandwidth of our microimaging system (200 kHz). We note that newer systems can have receiver bandwidths of 1 MHz, potentially extending the range of step A to about 20 T/m. The accuracy of calibration step B, however, could be subtly affected by diffusion, since kz = 0 does not coincide with maximum diffusive signal loss, and the value of might be obscured. To estimate the size of this effect we computed the variation of the echo peak as a function of δ2 near for the actual experimental conditions of the calibration points in step B. Considering the sample tube cross-sectional spin density ρ to be a circular disk of radius a centered at the origin in the xz-plane, Eq. [1] is the inverse Fourier transform of a circle, i.e., the jinc function given by jinc(r) = J1(r)/r, with J1(r) the first-order Bessel function of the first kind and r = 2πakz. Thus
| (6) |
where  and
and  in the step B pulse sequence of Fig. 3, with Gz1 and Gz2 the gradient pulse magnitudes. Since both bz and kz depend on δ2, the question is whether exp(−bzDz) significantly affects the shape of jinc(2πakz), the latter being maximal at . Calculating these functions over a range of δ2 centered on as in calibration step B, with all parameters set to values used in the experiments, shows jinc(2πakz) to fall to zero while exp(−bzDz) remains flat, slightly decreasing jinc(2πakz) but causing negligible change in its shape. From this we conclude diffusion does not affect calibration step B accuracy for our measurements.
2.4. Microimaging
The potential of the Micro-Z for quantitative microimaging of diffusion was illustrated by four sets of experiments: 1) measuring the bulk ADC of water and of PEG, 2) mapping the ADC of water, 3) q-space imaging of water in close-packed 4.5 μm polystyrene microspheres, and 4) diffusion-weighted imaging of a fixed mouse spinal cord.
A PGSE sequence was used to measure bulk ADC of water and of PEG in D2O (both at ambient temperature = 19 °C), with ADC calculated from a linear fit to the natural log of the normalized signal versus the b-value. For PEG, b-values as high as 107 s/cm2 (≈ 40 T/m) could be used due to its low diffusivity, 100 times higher than those used for water. ADC maps of water (doped with 1.2 mM Gd-DTPA) in the 2.4 mm i.d. sample tube were generated using a diffusion-weighted spin echo imaging sequence and six b-values, with either the Bruker Micro2.5 z-gradient coil (Δ = 15 ms) or the Micro-Z gradient coil (Δ = 7.5 ms), and b-values ranging 0.037-1.309 ×10⁵ s/cm2 and 0.043-1.545 ×10⁵ s/cm2, respectively.
Both non-localized and localized q-space imaging experiments were performed using the Micro-Z and preparations of centrifuged (closely packed) polystyrene microspheres of diameter a = 4.5 μm (Duke Scientific, USA) in water doped with 1 mM Gd-DTPA in a 2.4 mm i.d. tube. Non-localized measurements were performed with parameters: Δ = 15 ms, δ = 340 μs, TR = 500 ms, TE = 10.1 ms, 128 averages, scan time per data point = 64 s, and . Localized measurements (low-resolution diffusion-weighted spin-echo images) were made with parameters: Δ = 20 ms, δ = 3 ms, TR = 500 ms, TE = 25.8 ms, 16×16 matrix, 5×5 mm2 FOV, voxel size = 313×313×4000 μm3, 25 averages, and scan time per data point = 13.3 min.
Diffusion-weighted images were acquired of an excised cervical spinal cord from a mouse (C57 BL6). The cord was fixed in 2%/2.5% paraformaldehyde/glutaraldehyde and was suspended in PBS for imaging. A PGSE imaging sequence was used: Δ = 6.2 ms, δ = 240 μs, TR = 5 s, TE = 11.5 ms, 128×64 matrix, 3×3 mm2 FOV, voxel size = 23×47×1000 μm3, scan time = 5.3 min. Applied diffusion gradient amplitudes were Gz ≈ 10, 15, 20, 30, 40 T/m, corresponding to b-values = 0.61, 1.4, 2.5, 5.5, 9.7 ×10⁵ s/cm2 (q-values ≈ 500-2000 cm−1). The Micro-Z was used both for generating diffusion gradient pulses perpendicular to the cord axis and for imaging in combination with the Micro2.5 x- and y-gradient coils.
3. Results
The Micro-Z was operated as high as 50.2 T/m (40 A) with no adverse effects. Good gradient uniformity was demonstrated in cross-sectional images of a water-filled tube obtained using the Micro-Z for readout and the vendor’s x- and y-coils for phase-encoding and slice selection. The Micro-Z response to applied current was found to be linear up to 40 A as seen in calibration steps A and B (Figs. 4-5). Eddy current effects were minimal, with only minor pre-emphasis adjustment required even at 40 A, and the rise time of the Micro-Z pulses (≈ 125 μs) was comparable to that of the Bruker Micro2.5 gradients.
Figure 5.

Final Micro-Z calibration curve combining steps A and B, confirming a linear current response for Gz = 0-50 T/m. Thus a single gain value was adopted for the coil: .
Calibration step A demonstrated a linear current response (Fig. 4a), with a linear fit providing the gradient gain from the slope = 1.253 T/m/A (R2 = 0.9998). This would predict a maximum gradient amplitude of 50.12 T/m at 40 A and is in agreement with the Biot-Savart estimate of the Micro-Z gain at 1.26 T/m/A. Calibration step B continued to demonstrate linear behavior even at high gradient amplitudes. Furthermore, the area ratio (Eq. [5]) of the numerically integrated gradient waveforms was very close to 1 for all Gz1 values (Fig.4b inset), supporting the premise that kz = 0 when E(kz) is maximal. The combined data of steps A and B thus showed a linear response of the Micro-Z over the entire range studied, for which a linear fit gave , with R2 = 0.9998 (Fig. 5). This final gain calibration, which predicts a maximum gradient amplitude of 50.20 T/m at 40 A, was used to set the z-axis gradient scale factor to 0.01992 (= 0.025/1.255).
As an initial test of these calibrations, the bulk ADC of H2O and of PEG in D2O were found to be 1.9×10⁻⁵ cm2/s and 2.7×10⁻⁷ cm2/s at 19 °C. Furthermore, ADC maps using either the Bruker Micro2.5 z-gradient or the Micro-Z for diffusion and phase encoding, together with the Micro2.5 x- and y-gradients for frequency encoding and slice selection (Fig. 6) gave the same mean ± standard deviation ADC within a circular ROI (75% diameter) drawn on each map: 1.93 ×10⁻⁵ ± 0.23 cm2/s for the Bruker z-gradient, 1.93 −10−5 ± 0.22 cm2/s for the Micro-Z. A slight distortion of the image is apparent in Fig. 6b, possibly due to residual eddy currents induced by the Micro-Z in the copper tape of the embedded RF coil at these high gradient amplitudes, but no distortion was seen in images acquired at low amplitudes (< 1 T/m).
Figure 6.

ADC maps of water in the sample tube, using a PGSE imaging sequence and (a) the Bruker Micro2.5 z-gradient coil, or (b) the Micro-Z gradient coil. The Bruker Micro2.5 x- and y- gradients also were used for both. Mean ADC within a ROI drawn on both maps was the same (1.92 × 10⁻⁵ cm2/s).
Non-localized signal intensity (•) versus q from 4.5 μm micro-spheres is shown in Fig. 7. Note the diffraction peak at the q-value 2216.45 cm−1 (Gz = 1.75 T/m), where 1/q = 4.51 μm, in excellent agreement with actual bead diameter and similar to effects shown by Coy and Callaghan [17]. These results demonstrate the utility of the Micro-Z for generating gradient amplitudes significantly larger than those accessible by a commercial tri-axial set. Superimposed on these data are values (•) from a 6×6 pixel ROI centered on the tube of micro-spheres in diffusion-weighted images (inset), which show similar behavior, even though from a different sample. Smooth lines connect points as a guide for the eye.
Figure 7.

Non-localized echo signal (•) versus q from a sample of polystyrene micro-spheres (dia. = 4.5 μm) in water, obtained with the Micro-Z, shows a diffraction peak at q = 1/(4.51 μm). Image intensity (•) from an ROI drawn on diffusion-weighted images (inset), obtained using the Micro-Z together with the Bruker Micro2.5 x- and y- gradients, shows similar behavior. Smooth lines are a guide for the eye.
Diffusion-weighted images of a mouse spinal cord demonstrated the microimaging capability of the Micro-Z coil, showing a range of gray/white matter contrast. Three such images are shown in Fig. 8 for b = 0.6, 2.5, 9.7 ×10⁵ s/cm2 (left to right). ROI’s for white matter (WM) and gray matter (GM) were selected covering most of the ventro-lateral WM and central GM. By plotting ROI values versus b, it becomes evident that the contrast inversion seen in the images at increasing diffusion weighting is due in part to differences in diffusive behavior of these two tissues [24]. The signal decay rate is faster for the relatively isotropic GM than for the highly anisotropic WM, as expected for diffusion gradients applied perpendicular to the WM diffusive restrictions (axon and myelin membranes).
Figure 8.

Diffusion-weighted images of a fixed mouse spinal cord acquired using the Micro-Z with diffusion gradients perpendicular to the cord axis and b = 0.6, 2.5, 9.7 ×10⁵ s/cm2 (left to right). The graph shows different rates of signal loss as a cause of WM/GM contrast inversion at high b-value.
4. Discussion
The Micro-Z gradient coil presented here addresses the need for high-gradient amplitude PGSE diffusion encoding combined with 3D spatial localization. Overall performance of the Micro-Z was excellent, demonstrating close agreement with predicted gradient strength, and the capability for quantitative measurements of restricted diffusion phenomena at the length scale of cells. The first-order diffraction peak of the non-localized microsphere data in Fig. 7, occurring at q = 1/(4.5 μm), yields information about the average pore size of the close-packed microspheres of 4.5 μm mean diameter. Taking the Fourier transform, the propagator would have a resolution of 1.13 μm, adequate for characterizing water molecule displacements in the pore spaces. The observed behavior is typical for a pore glass, in which pore shape and orientation are random throughout the sample [25, 26]. The discrepancy in the results from the two samples in Fig. 7, prepared using the same materials and methods and measured on different days, is most likely due to the different data acquisition methods. Data from the image-based measurement show greater signal loss than the non-localized data, consistent with increased diffusion weighting from the imaging gradient pulses and possible noise-current ghosting (see below).
The diffusion weighted images of mouse spinal cord in Fig. 8 demonstrate the capabilities of the Micro-Z gradient coil for quantitative image-based measurements of restricted diffusion in important biological tissues, accessing exceptionally high b-values and q-values. An immediate application for this technology will be the assessment of regional axonal structure in mouse spinal cord by mapping the propagator at high resolution (in both spatial and displacement domains) [27], and various experimental pathologies also can be studied. The highest b-value we used was nearly 106 s/cm2, higher than typical for diffusion-weighted imaging of white matter. More exceptional than this b-value, however, are the gradient amplitude and duration used to achieve it (40 T/m and 240 μs), enabling a relatively short diffusion time (6.2 ms) by which smaller diffusional displacements could be probed. This in turn allowed an echo time of 11.5 ms, providing high SNR and highlighting one of the advantages of the small Micro-Z coil, i.e., shorter echo time for a particular b-value.
The novel calibration method presented here provided a direct means to accurately determine the gradient generated by a given current applied to the Micro-Z. In section 2.3, we concluded that calibration accuracy is not affected by diffusion in step B, although SNR loss due to diffusion could affect accuracy in step A. Accuracy, however, more likely is limited by noise and hum in the gradient amplifier [4], which for a high-gain coil can manifest as signal instability and phase-encode ghost artifacts in images. As we observed some evidence of these with the Micro-Z, we measured both the noise and hum in the BAFPA40 amplifiers. The noise fluctuation was ± 4 mA, riding on a sinusoidal hum of amplitude 2 mA and frequency 2 kHz, which corresponds to gradient amplitude fluctuations as large as ± 7.53 mT/m. These are nearly imperceptible in the measured 25 T/m gradient waveforms of Fig. 2, but their contribution when using the Micro-Z to generate low gradient amplitudes (< 1 T/m) can be significant.
The Micro-Z gradient coil was designed to have high gain for high-resolution q-space microimaging, hence relatively low currents were needed for generating low-amplitude z-axis imaging gradient pulses, while higher currents only were applied for brief durations as needed for the high-amplitude PGSE pulses. Since thermal dissipation (I2R) is quadratic in current, standard imaging duty cycles likely were less thermally intensive for the Micro-Z than for the Bruker gradient coils. Furthermore, typical phase-encode gradient pulse durations of 1-2 ms usually resulted in a total Micro-Z duty cycle of less than 2%. Higher duty cycles could be possible, particularly for lower gradient amplitudes, but to determine the maximum duty cycle for a given tolerable temperature range would require direct monitoring of the gradient coil temperature. Although we did not directly measure the Micro-Z temperature, we turned on the water cooling system for the Bruker tri-axial gradient set which circulated water at 19 °C during all experiments. This provided a relatively stable and cool ambient within the bore, and such air cooling was sufficient.
The single-axis Micro-Z design is sufficient for diffusion encoding in cylindrically symmetric samples such as the spinal cord, however a tri-axial set would require x- and y-coils of geometry other than a Maxwell pair, which can compromise gradient strength or field of view [7, 10-12]. Nevertheless, for use with smaller samples, the dimensions of the Micro-Z gradient and RF coils could be reduced to increase both gradient strength and SNR. Other design improvements may include use of an RF shield to block external noise, a balun transformer to suppress cable shield currents, and larger O-rings for a tighter fit of the entire structure within the bore. Furthermore, B0 shift compensation and additional gradient pulse blanking might be required if data are to be acquired immediately following high-amplitude gradient pulses.
In summary, a relatively simple and easy-to-build gradient coil capable of gradient amplitudes up to 50 T/m was constructed and directly calibrated. The coil was integrated with an existing commercial microimaging system, providing new possibilities for localized q-space microscopy. The intended goal of 1 μm resolution in the displacement domain was achieved, demonstrating the accurate performance of this coil. Initial results from diffusion-weighted imaging of a mouse spinal cord show the potential of this technology for quantitative high-resolution q-space imaging of axonal microstructure.
Acknowledgments
This research was supported by NIH grants EB001427, EB003951, and NS41380.
Footnotes
Publisher's Disclaimer: This is a PDF file of an unedited manuscript that has been accepted for publication. As a service to our customers we are providing this early version of the manuscript. The manuscript will undergo copyediting, typesetting, and review of the resulting proof before it is published in its final citable form. Please note that during the production process errors may be discovered which could affect the content, and all legal disclaimers that apply to the journal pertain.
References
- [1].Tanner JE. Pulsed Field Gradients for NMR Spin-Echo Diffusion Measurements. Rev Sci Instrum. 1965;36:1086–1087. [Google Scholar]
- [2].Hurd RE. Gradient-Enhanced Spectroscopy. J Magn Reson. 1990;87:422–428. doi: 10.1016/j.jmr.2011.09.005. [DOI] [PubMed] [Google Scholar]
- [3].Stejskal EO, Tanner JE. Spin Diffusion Measurements - Spin Echoes in Presence of a Time-Dependent Field Gradient. J Chem Phys. 1965;42:288–292. [Google Scholar]
- [4].Callaghan PT, Komlosh ME, Nyden M. High magnetic field gradient PGSE NMR in the presence of a large polarizing field. J Magn Reson. 1998;133:177–182. doi: 10.1006/jmre.1998.1424. [DOI] [PubMed] [Google Scholar]
- [5].Assaf Y, Mayk A, Cohen Y. Displacement imaging of spinal cord using q-space diffusion-weighted MRI. Magn Reson Med. 2000;44:713–722. doi: 10.1002/1522-2594(200011)44:5<713::aid-mrm9>3.0.co;2-6. [DOI] [PubMed] [Google Scholar]
- [6].Topgaard D, Soderman O. Experimental determination of pore shape and size using q-space NMR microscopy in the long diffusion-time limit. Magn Reson Imaging. 2003;21:69–76. doi: 10.1016/s0730-725x(02)00626-4. [DOI] [PubMed] [Google Scholar]
- [7].Xia Y, Jeffrey KR, Callaghan PT. Purpose-designed probes and their applications for dynamic NMR microscopy in an electromagnet. Magn Reson Imaging. 1992;10:411–426. doi: 10.1016/0730-725x(92)90512-x. [DOI] [PubMed] [Google Scholar]
- [8].Bowtell R, Robyr P. Multilayer Gradient Coil Design. J Magn Reson. 1998;131:286–294. doi: 10.1006/jmre.1998.1369. [DOI] [PubMed] [Google Scholar]
- [9].Snaar JE, Robyr P, Bowtell R. Strong gradients for spatially resolved diffusion measurements. Magn Reson Imaging. 1998;16:587–591. doi: 10.1016/s0730-725x(98)00048-4. [DOI] [PubMed] [Google Scholar]
- [10].Seeber DA, Hoftiezer JH, Daniel WB, Rutgers MA, Pennington CH. Triaxial magnetic field gradient system for microcoil magnetic resonance imaging. Rev Sci Instrum. 2000;71:4263–4272. [Google Scholar]
- [11].Lee SC, Kim K, Kim J, Lee S, Yi J. Han, Kim SW, Ha KS, Cheong C. One micrometer resolution NMR microscopy. J Magn Reson. 2001;150:207–213. doi: 10.1006/jmre.2001.2319. [DOI] [PubMed] [Google Scholar]
- [12].Dodd SJ, Ho C. Short planar gradient coils for MR microscopy using concentric return paths. J Magn Reson. 2002;156:1–9. doi: 10.1006/jmre.2002.2532. [DOI] [PubMed] [Google Scholar]
- [13].Jasanoff A, Sun PZ. In vivo magnetic resonance microscopy of brain structure in unanesthetized flies. J Magn Reson. 2002;158:79–85. doi: 10.1016/s1090-7807(02)00063-0. [DOI] [PubMed] [Google Scholar]
- [14].Callaghan PT, Stepisnik J. Spatially-distributed pulsed gradient spin echo NMR using single-wire proximity. Phys Rev Let. 1995;75:4532–4535. doi: 10.1103/PhysRevLett.75.4532. [DOI] [PubMed] [Google Scholar]
- [15].Cory DG, Garroway AN. Measurement of translational displacement probabilities by NMR: an indicator of compartmentation. Magn Reson Med. 1990;14:435–444. doi: 10.1002/mrm.1910140303. [DOI] [PubMed] [Google Scholar]
- [16].Callaghan PT. Principles of nuclear magnetic resonance microscopy. Clarendon Press; Oxford: 1991. pp. 328–419. [Google Scholar]
- [17].Coy A, Callaghan PT. Pulsed Gradient Spin-Echo NMR “Diffusive Diffraction” Experiments on Water Surrounding Close-Packed Polymer Spheres. J Colloid Interface Sci. 1994;168:373–379. [Google Scholar]
- [18].Bonny JM, Gaviria M, Donnat JP, Jean B, Privat A, Renou JP. Nuclear magnetic resonance microimaging of mouse spinal cord in vivo. Neurobiol Dis. 2004;15:474–482. doi: 10.1016/j.nbd.2003.11.026. [DOI] [PubMed] [Google Scholar]
- [19].Ben Bashat D, Ben Sira L, Graif M, Pianka P, Hendler T, Cohen Y, Assaf Y. Normal white matter development from infancy to adulthood: comparing diffusion tensor and high b value diffusion weighted MR images. J Magn Reson Imaging. 2005;21:503–511. doi: 10.1002/jmri.20281. [DOI] [PubMed] [Google Scholar]
- [20].Assaf Y, Chapman J, Ben-Bashat D, Hendler T, Segev Y, Korczyn AD, Graif M, Cohen Y. White matter changes in multiple sclerosis: correlation of q-space diffusion MRI and 1H MRS. Magn Reson Imaging. 2005;23:703–710. doi: 10.1016/j.mri.2005.04.008. [DOI] [PubMed] [Google Scholar]
- [21].Chin CL, Wehrli FW, Fan Y, Hwang SN, Schwartz ED, Nissanov J, Hackney DB. Assessment of axonal fiber tract architecture in excised rat spinal cord by localized NMR q-space imaging: simulations and experimental studies. Magn Reson Med. 2004;52:733–740. doi: 10.1002/mrm.20223. [DOI] [PubMed] [Google Scholar]
- [22].Wright AC, Bataille H, Wehrli SL, Chin C-L, Wehrli FW. Construction of a 5000 G/cm z-gradient coil for q-space microscopy. ISMRM 12th Scientific Meeting; Kyoto. 2004. p. 741. [Google Scholar]
- [23].Wright AC, Ong HH, Wehrli SL, Song HK, Schwartz ED, Wehrli FW. Calibration of a 50 T/m Z-gradient coil for quantitative diffusion microimaging. ISMRM 13th Scientific Meeting; Miami Beach. 2005. p. 855. [Google Scholar]
- [24].Yoshiura T, Wu O, Zaheer A, Reese TG, Sorensen AG. Highly diffusion-sensitized MRI of brain: Dissociation of gray and white matter. Magn Reson Med. 2001;45:734–740. doi: 10.1002/mrm.1100. [DOI] [PubMed] [Google Scholar]
- [25].Callaghan PT. Pulsed-gradient spin-echo NMR for planar, cylindrical, and spherical pores under conditions of wall relaxation. J Magn Reson A. 1995;113:53–59. [Google Scholar]
- [26].Callaghan PT. NMR imaging, NMR diffraction and applications of pulsed gradient spin echoes in porous media. Magn Reson Imaging. 1996;14:701–709. doi: 10.1016/s0730-725x(96)00152-x. [DOI] [PubMed] [Google Scholar]
- [27].Ong HH, Wright AC, Wehrli SL, Souza A, Schwartz ED, Saha PK, Wehrli FW. Q-space propagator maps of mouse spinal cord provide insight into regional axonal architecture. ISMRM 14th Scientific Meeting; Seattle. 2006. p. 640. [Google Scholar]