Abstract
Dyslipidemia is an independent risk factor for type 2 diabetes, although exactly which of the many plasma lipids contribute to this remains unclear. We therefore investigated whether lipid profiling can inform diabetes prediction by performing liquid chromatography/mass spectrometry–based lipid profiling in 189 individuals who developed type 2 diabetes and 189 matched disease-free individuals, with over 12 years of follow up in the Framingham Heart Study. We found that lipids of lower carbon number and double bond content were associated with an increased risk of diabetes, whereas lipids of higher carbon number and double bond content were associated with decreased risk. This pattern was strongest for triacylglycerols (TAGs) and persisted after multivariable adjustment for age, sex, BMI, fasting glucose, fasting insulin, total triglycerides, and HDL cholesterol. A combination of 2 TAGs further improved diabetes prediction. To explore potential mechanisms that modulate the distribution of plasma lipids, we performed lipid profiling during oral glucose tolerance testing, pharmacologic interventions, and acute exercise testing. Levels of TAGs associated with increased risk for diabetes decreased in response to insulin action and were elevated in the setting of insulin resistance. Conversely, levels of TAGs associated with decreased diabetes risk rose in response to insulin and were poorly correlated with insulin resistance. These studies identify a relationship between lipid acyl chain content and diabetes risk and demonstrate how lipid profiling could aid in clinical risk assessment.
Introduction
Several prospective studies have identified dyslipidemia, particularly hypertriglyceridemia, as an independent predictor of incident type 2 diabetes mellitus (1–5). However, in contrast to a discrete metabolite such as glucose, plasma lipids are composed of dozens of distinct molecules. For example, combinations of various acyl chains esterified to a glycerol backbone generate numerous unique triacylglycerols (TAGs). Standard clinical measurement of TAGs relies on the measurement of total glycerol following acyl chain hydrolysis (6), thus obscuring this underlying diversity.
We have developed a liquid chromatography/mass spectrometry–based (LC/MS-based) lipid profiling platform that measures intact lipids across a variety of lipid classes: TAGs, cholesterol esters (CEs), lysophosphatidylcholines (LPCs), phosphatidylcholines (PCs), lysophosphatidylethanolamines (LPEs), diacylglycerols (DAGs), and sphingomyelins (SMs). Within each lipid class, this method further distinguishes analytes on the basis of total acyl chain carbon number and double bond content. These factors define each lipid’s molecular weight, which in turn determines the lipid’s detection in the mass spectrometer. We have applied this platform to the study of human plasma and are able to reproducibly detect and quantify more than 100 lipid analytes in 10 μl of starting volume. Because TAGs are composed of 3 acyl chains, this class of lipids has a particularly broad range of molecular weights; our platform monitors 42 distinct TAGs. Discriminating plasma lipids at this level of detail has the potential to improve diabetes prediction and shed insight on the intersection between dyslipidemia and metabolic risk. To our knowledge, however, this hypothesis has not been examined in a prospective study.
Here, we report the application of lipid profiling to plasma obtained from participants in the community-based Framingham Heart Study cohort (FHS). Prior investigations in this well-established cohort have highlighted the differential risk of atherosclerosis attributable to distinct components of total cholesterol, i.e., LDL cholesterol versus HDL cholesterol (7). With access to archived plasma samples, detailed phenotyping, and longitudinal follow up, this sample provides an ideal opportunity to test whether lipid profiling can improve diabetes prediction beyond available metrics of dyslipidemia. To explore the mechanisms by which lipid analytes might contribute to diabetes risk prediction in humans, we also performed lipid profiling in the context of oral glucose tolerance testing (OGTT) in FHS and following pharmacologic manipulation of insulin levels (glipizide and metformin administration) and modulation of insulin sensitivity with acute exercise in independent cohorts. Finally, we used tandem MS, collision-induced dissociation analyses to identify the acyl chain constituents of disease predictors identified in FHS. Taken together, these experiments generate a more granular view of dyslipidemia and type 2 diabetes risk prediction in humans.
Results
Establishing a nested case-control study to enable identification of lipid predictors of type 2 diabetes.
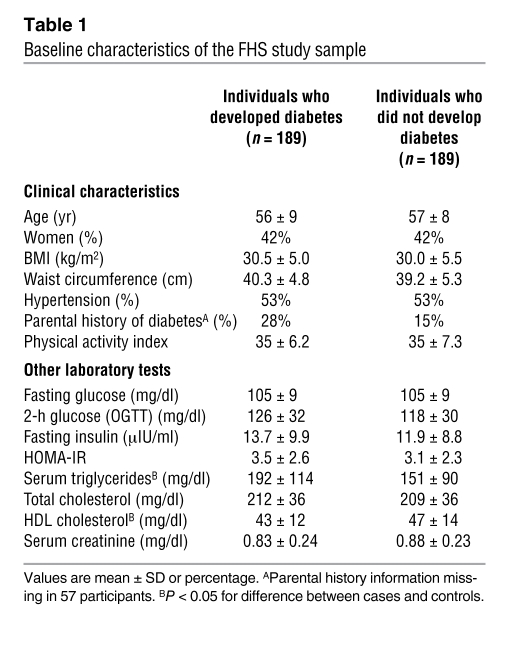
The Offspring Cohort of the FHS is a longitudinal, community-based cohort initiated in 1971 (8). Between 1991–1995, designated as the “baseline” examination period for the present investigation, 2,422 individuals from this cohort underwent OGTT and were eligible for analyses. Since that time, a total of 193 individuals developed new-onset type 2 diabetes over a 12-year follow up period. These individuals were designated as cases. We selected sex-matched controls, using propensity score matching with a logistic model that included age, BMI, fasting glucose, and hypertension status. Using this approach, a matched control was identified for all but 4 cases, yielding a final study sample of 189 cases and 189 controls. Characteristics of the FHS study sample are shown in Table 1, and subject selection is further detailed in the Methods. As expected, there were no statistically significant baseline differences between cases and controls with respect to variables incorporated into the matching process. However, there were significant differences in total triglycerides (P < 0.0001) and HDL cholesterol (P = 0.0007) between cases and controls, establishing a unique opportunity to explore the role of dyslipidemia in type 2 diabetes prediction.
Table 1 .
Baseline characteristics of the FHS study sample
Lipid profiling identifies a lipid pattern of diabetes risk.
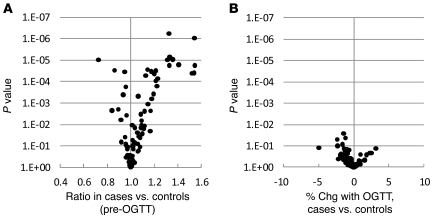
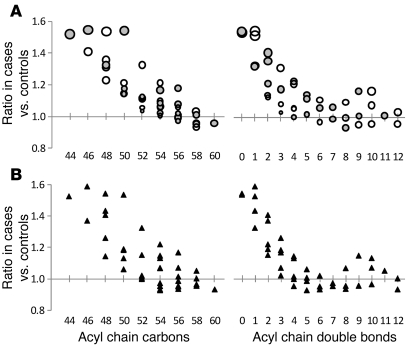
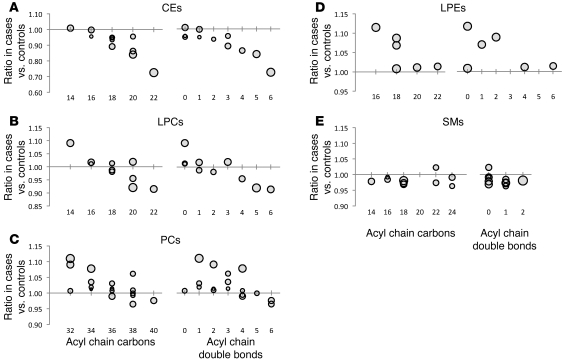
Lipid profiling was performed on fasting pre-OGTT and 2-hour post-OGTT plasma samples obtained from the baseline examination for all 378 FHS study participants. Figure 1A shows the ratio of each lipid analyte in fasting pre-OGTT plasma in those who went on to develop diabetes (cases) versus those who did not (controls). Figure 1B shows the differences in OGTT-triggered lipid changes between cases and controls — as demonstrated in these figures, analyte levels in pre-OGTT plasma appeared to be more discriminating of case status than analyte responses to OGTT. While many lipids analytes were higher in cases than controls, some had the reverse association. The largest differences, regarding both the magnitude and significance of the association (as reflected by the P value), were noted among TAGs. This result was not surprising given the imbalance in total triglycerides between cases and controls. However, we also identified a striking, downsloping pattern in which TAGs of relatively lower carbon number and double bond content were most significantly elevated in cases relative to controls (Figure 2A). When the comparison was restricted to the most insulin-sensitive individuals, by focusing on the bottom quartiles of homeostasis model assessment of insulin resistance (HOMA-IR), the pattern was unchanged between cases versus controls (Figure 2B); mean HOMA-IR was 1.03 for cases and 1.01 for controls (P = 0.36) in this subset. Figure 3 shows that the downsloping relationship between diabetes risk and carbon number and double bond content was also present among CEs, LPCs, PCs, and LPEs but not SMs.
Figure 1. Case-control comparison for all lipid analytes in FHS.
(A) The geometric mean ratio of each lipid analyte level for cases versus that for controls in fasting pre-OGTT plasma. (B) The mean difference in percentage of change 2 hours after an oral glucose challenge in cases versus that in controls (percentage of change [chg] in cases minus percentage of change in controls). For both plots, P values are plotted on the y axis, and each data point represents a distinct lipid analyte.
Figure 2. TAG pattern of diabetes risk in FHS.
(A) The geometric mean ratio of TAG levels in cases versus that in controls in fasting pre-OGTT plasma. Each circle represents a distinct TAG, organized along the x axis based on total acyl chain carbon number (left) or double bond content (right). The size of each circle is proportional to the SD of the case/control ratios for each TAG; therefore, smaller circles indicate greater precision, whereas larger circles indicate lesser precision. Note, the 2 panels display the same data, simply arranged along the x axis by a different variable. (B) The geometric mean ratio of TAG levels in the subset of cases and controls in the bottom quartile of HOMA-IR (mean HOMA-IR, 1.03 for cases and 1.01 for controls; P = 0.36), organized along the x axis based on total acyl chain carbon number (left) or double bond content (right).
Figure 3. Relationship between diabetes risk and acyl chain content in non-TAG lipid analytes.
The geometric mean ratio of lipid levels in cases versus that in controls in fasting pre-OGTT plasma for (A) CEs, (B) LPCs, (C) PCs, (D) LPEs, and (E) SMs. Each data point represents a distinct lipid analyte, organized along the x axis based on total acyl chain carbon number (left) or double bond content (right). The size of each circle is proportional to the SD of the case/control ratios for each lipid; therefore, smaller circles indicate greater precision, whereas larger circles indicate lesser precision. Note, the 2 panels display the same data points, simply arranged along the x axis by a different variable.
Diabetes risk pattern persists after adjustment in multivariable analysis.
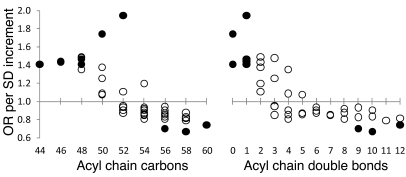
Given the imbalance in total triglycerides and HDL cholesterol between cases and controls at the baseline examination (Table 1), we tested whether the relationship between diabetes risk and lipid carbon number and double bond content persisted after multivariable adjustment. Conditional logistic regression models were fitted to assess the association between baseline lipid levels and future diabetes, adjusting for age, sex, BMI, fasting glucose, fasting insulin, total triglycerides, and HDL cholesterol. Figure 4 depicts the odds ratio (OR) of diabetes per SD increment in TAG level, as a function of carbon number and double bond content, and shows that TAGs of lower carbon number and double bond content were associated with an OR of more than 1 for diabetes, while TAGs of higher carbon number and double bond content were associated with an OR of less than 1 for diabetes. The 9 TAGs that reached nominal significance (P < 0.05) after multivariable adjustment, depicted as solid circles, were distributed at the extremes of saturation. Box and whisker plots for each of these TAGs in cases versus controls is depicted in Supplemental Figure 1. The heterogeneous correlation between these TAGs and total triglyceride measurements is shown in Supplemental Table 1. The downsloping relationship between diabetes risk and carbon number and double bond content persisted after multivariable adjustment for LPCs, PCs, and possibly LPEs but not for CEs (Supplemental Figure 2).
Figure 4. TAG diabetes risk pattern following multivariable adjustment.
Conditional logistic regression models were fitted to assess the association between baseline TAG levels and future diabetes risk, adjusting for age, sex, BMI, fasting glucose, fasting insulin, total triglycerides, and HDL cholesterol. The OR for future diabetes risk per SD increment of TAG level is plotted for each TAG, organized along the x axis based on total acyl chain carbon number (left) or double bond content (right). Solid circles indicate ORs that were significant for relating diabetes to TAG (P < 0.05).
Improving diabetes prediction over standard clinical measures.
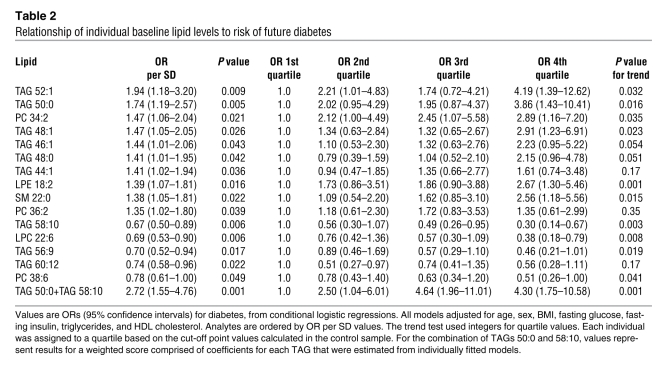
Following multivariable adjustment for age, sex, BMI, fasting glucose, fasting insulin, total triglycerides, and HDL cholesterol, a total of 15 lipid analytes (Table 2) reached nominal significance (P < 0.05), including the 9 TAGs depicted in Figure 4. These findings were largely unchanged when the model was further adjusted for parental history of diabetes (Supplemental Table 2). For the 10 lipids associated with increased diabetes risk, each SD increment in log marker was associated with a 1.35-fold to 1.94-fold increased odds of future diabetes. Individuals in the top quartile of these lipid analytes had a 1.35- to 4.19-fold odds of developing diabetes over the 12-year follow up period, compared with that of individuals in the bottom quartile of these lipids. For the 5 negative predictors, each SD increment in log marker was associated with a 0.67-fold to 0.78-fold decreased odds of future diabetes. Individuals in the top quartile of these lipid analytes had a 0.30- to 0.56-fold odds of developing diabetes over the 12-year follow up period, compared with that of individuals in the bottom quartile of these lipids. The combination of the most significant positive and negative predictors, TAG 50:0 and TAG 58:10, was associated with an OR of 2.72 per SD increment in biomarker level. Individuals in the top quartile of this combination had a 4.30-fold risk of developing diabetes, compared with that of individuals in the lowest quartile (P = 0.001 for trend), in models adjusting for age, sex, BMI, fasting glucose, fasting insulin, total triglycerides, and HDL cholesterol.
Table 2 .
Relationship of individual baseline lipid levels to risk of future diabetes
Lipid profiling demonstrates a heterogeneous TAG response to OGTT.
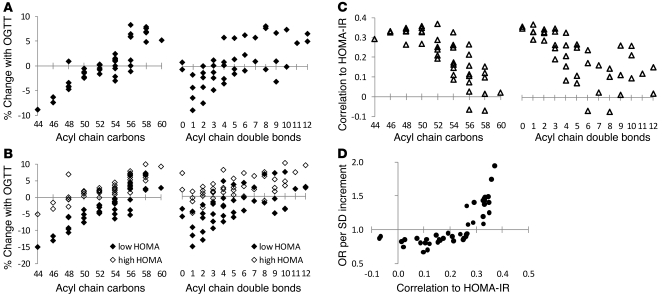
To explore potential mechanisms for the differential risk attributable to distinct TAGs, we examined the TAG response to OGTT across all 378 FHS study participants. Much of the biochemical response to glucose ingestion can be attributed to an endogenous rise in insulin (9). Interestingly, in response to OGTT, we found that TAGs of lower carbon number and double bond content decreased and TAGs of relatively higher carbon number and double bond content increased (Figure 5A). The fall in TAGs of lower carbon number and double bond content was more pronounced in individuals in the lowest quartile of HOMA-IR relative to that of individuals in the highest quartile of HOMA-IR (Figure 5B).
Figure 5. TAGs and insulin action in FHS.
(A) The mean percentage of change of each TAG in response to OGTT. (B) The mean percentage of change of each TAG in response to OGTT for individuals in the lowest (black diamonds) and highest (white diamonds) quartiles of HOMA-IR. (C) Spearman correlation coefficient for each TAG with HOMA-IR. For A–C, each data point represents a distinct TAG, organized along the x axis based on total acyl chain carbon number (left) or double bond content (right). (D) The risk of diabetes for each TAG following multivariable adjustment and correlation with HOMA-IR.
Lipid profiling demonstrates a heterogeneous relationship between plasma TAGs and insulin resistance.
Given the heterogeneous dynamic response of different TAGs to stimulation of the insulin axis, we next examined the relationship between TAG levels in fasting pre-OGTT plasma and HOMA-IR in the FHS sample (cases and controls). Across the TAGs, the Spearman correlation coefficient between individual TAGs and HOMA-IR ranged from –0.07 to 0.37 (Supplemental Table 1). We noted a pattern in which TAGs of relatively lower carbon number and double bond content were significantly and positively correlated with HOMA-IR and TAGs of higher carbon number and double bond content were not correlated with HOMA-IR (Figure 5C). That is, TAGs that fell in response to insulin stimulation were elevated in the context of insulin resistance. The results were unchanged if HOMA-IR was replaced by fasting insulin (data not shown). The risk of diabetes attributable to each TAG, as determined by conditional logistic regression, was related to the TAG’s correlation with HOMA-IR (Figure 5D).
Pharmacological manipulation of insulin release highlights the role of insulin action on plasma TAGs.
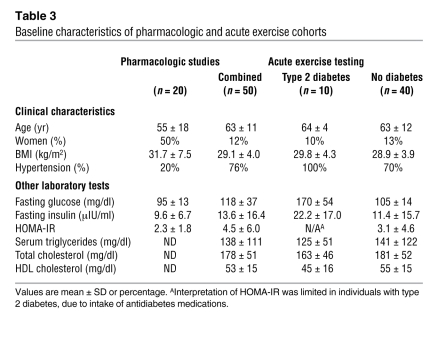
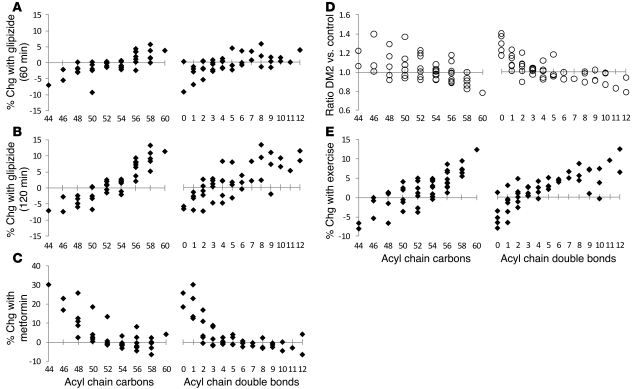
OGTT causes an acute rise in plasma glucose, which then triggers a rise in insulin. In order to formally exclude the possibility that TAGs respond differentially to the rise in glucose rather than insulin, we performed lipid profiling on plasma from 20 nondiabetic individuals (Table 3), before, 60 minutes after, and 120 minutes after oral ingestion of an insulin secretagogue (glipizide 5 mg). As expected, we found that glipizide administration led to an increase in mean plasma insulin (9.6 μIU/ml [baseline] → 23.5 μIU/ml [60 minutes, P = 0.0009 versus baseline] → 17.8 μIU/ml [120 minutes, P = 0.094 versus baseline]) and a decrease in mean plasma glucose (95 mg/dl [baseline] → 79 mg/dl [60 minutes, P < 0.0001 versus baseline] → 65 mg/dl [120 minutes, P < 0.0001 versus baseline]). As shown in Figure 6A (60 minutes versus baseline) and Figure 6B (120 minutes versus baseline), glipizide administration recapitulated the TAG response to OGTT, suggesting that insulin rather than glucose mediates the observed changes.
Table 3 .
Baseline characteristics of pharmacologic and acute exercise cohorts
Figure 6. TAG responses to pharmacologic and physiologic perturbations in alternative cohorts.
The mean percentage of change of each TAG (A) 60 minutes and (B) 120 minutes after glipizide administration in 20 nondiabetic individuals. (C) The mean percentage of change of each TAG after 4 doses of metformin in 20 nondiabetic individuals. (D) The geometric mean ratio of TAG levels in 10 individuals with type 2 diabetes (DM2) versus those in 40 nondiabetic controls. (E) The mean percentage of change of each TAG after exercise treadmill testing in 50 individuals. For A–E, each data point represents a distinct TAG, organized along the x axis based on total acyl chain carbon number (left) or double bond content (right).
After a washout period of 6 days, these 20 individuals were then administered 4 doses of metformin (500 mg) over 2 days. Although chronic metformin use decreases insulin resistance, its acute effect is to decrease hepatic glucose output and, as a result, lower plasma insulin (10). Consistent with these effects, we noted a decrease in mean plasma glucose (95 mg/dl → 86 mg/dl, P = 0.022) and insulin (9.6 μIU/ml → 6.8 μIU/ml, P = 0.00037) after metformin intake. With this fall in plasma insulin, we noted an increase in TAGs of lower carbon number and double bond content and a decrease in TAGs of higher carbon number and double bond content, i.e., the inverse response compared with that for OGTT and glipizide administration (Figure 6C).
The diabetes risk pattern in TAGs persists in established disease and is ameliorated by acute exercise.
We also performed lipid profiling on 50 individuals undergoing treadmill stress testing (Table 3), including 10 individuals with type 2 diabetes. In this cohort, participants with diabetes had similar total triglycerides (125 mg/dl versus 141 mg/dl, P = 0.71) and BMIs (29.8 versus 28.9, P = 0.54) as compared with those of the 40 participants without diabetes. Figure 6D depicts the ratio of TAGs in individuals with diabetes (n = 10) versus nondiabetic individuals (n = 40) and demonstrates the same downsloping pattern of TAGs identified in the prediabetic state. Figure 6E shows the change in TAGs that occurred with exercise treadmill testing across all 50 individuals, demonstrating a similar pattern to those of OGTT and glipizide administration. Exercise is known to acutely improve insulin sensitivity at the tissue level (11, 12), as demonstrated by the fall in plasma insulin (13.6 μIU/ml before exercise → 9.7 μIU/ml after exercise, P = 0.049), in the face of constant glycemia (118 mg/dl before exercise → 118 mg/dl after exercise, P = 0.76), with exercise in this cohort.
Tandem MS identifies the acyl chain constituents of diabetes predictors.
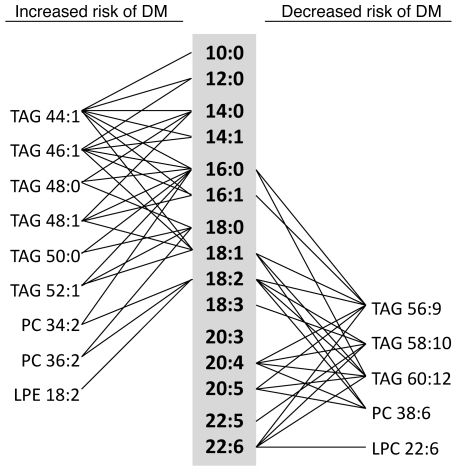
Operating the mass spectrometer in “full scan” mode, our lipid profiling platform distinguished analytes on the basis of total acyl chain carbon number and double bond content. This method, however, is unable to unambiguously characterize the fatty acid constituents of TAGs, PCs, and DAGs (in contrast, the molecular weight of each LPC, LPE, CE, and SM analyte identifies a specific acyl chain length and saturation). Therefore, we performed additional plasma MS/MS analyses to systematically fragment each TAG, PC, and DAG, in order to identify each analyte’s acyl chain composition. Figure 7 depicts the identified acyl chain constituents of lipid analytes that predict diabetes in FHS after multivariable adjustment. Lipids associated with ORs of more than 1 for diabetes are primarily composed of saturated or monounsaturated fatty acids, whereas lipids associated with ORs of less than 1 for diabetes are primarily composed of polyunsaturated fatty acids.
Figure 7. Fatty acyl chain constituents of diabetes risk predictors.
Individual fatty acids are listed in the gray column. Lipid analytes associated with an increased risk of diabetes (DM) following multivariable adjustment (except SM 22:0) are listed on the left, and lipid analytes associated with a decreased risk of diabetes following multivariable adjustment are listed on the right. Lines connect individual lipids with their fatty acid constituents.
Dietary intake does not explain the diabetes risk lipid pattern.
Because dietary habits among FHS participants are captured through administration of a food frequency questionnaire, we were able to test whether the diabetes risk pattern we observed was attributable to dietary differences. We found no correlation between the percentage of total fat intake from saturated fats (37.4% cases versus 38.0% controls, P = 0.15) or polyunsaturated fats (21.4% cases versus 21.4% controls, P = 0.81) and case status. There was a trend for higher overall saturated fat intake (23.4 g cases versus 21.4 g controls, P = 0.054) and significantly higher polyunsaturated fat intake (13.3 g cases versus 11.8 g controls, P = 0.011) among cases versus controls.
Discussion
Current technologies enable high-throughput “snapshots” of the lipidome (13–15). Here, we have applied LC/MS-based lipid profiling to the FHS to identify a plasma signature of diabetes risk. We show that TAGs of lower carbon number and double bond content were associated with an increased risk of type 2 diabetes, whereas TAGs of higher carbon number and double bond content were associated with a decreased risk of type 2 diabetes. A similar pattern was noted for other lipid classes, including LPCs, LPEs, and PCs. The results of physiologic and pharmacologic experiments suggest that the divergent risk embedded in plasma triglycerides is due in part to the heterogeneous relationship between individual TAGs and insulin action. Nevertheless, select TAGs and other lipid analytes remained significant disease predictors, after adjusting for insulin (as well as other biochemical and clinical risk factors) and among the subset of subjects in the lowest quartile of HOMA-IR.
Several lines of evidence demonstrate that lipid profiling helps clarify the relationship between plasma TAGs and insulin action. In the acute setting, we showed that TAGs of lower carbon number and double bond content decreased with OGTT, whereas TAGs of relatively higher carbon number and double bond content increased. These findings were not appreciated during recent metabolomic surveys of oral glucose ingestion (9, 16, 17). Glipizide administration resulted in the same dynamic TAG pattern, highlighting insulin rather than glucose as the proximate cause of the observed changes. The inverse pattern was elicited by acute metformin intake, which decreased plasma glucose and insulin levels. Exercise, which is known to acutely improve insulin sensitivity at the tissue level (11, 12), demonstrated the same TAG response as OGTT and glipizide administration. In a small study of 19 individuals, Schwab et al. have shown that the sustained increase in insulin sensitivity associated with diet-induced weight loss over 33 weeks is also associated with this pattern of TAG changes (18).
These observations are further corroborated by the relationship between plasma TAGs and insulin resistance. In fasting pre-OGTT FHS samples, we showed that TAGs of lower carbon number and double bond content — i.e., TAGs that fall in response to insulin action — were elevated in the setting of insulin resistance. Further, insulin-resistant individuals had a blunted decrease in these TAGs during OGTT. TAGs of higher carbon number and double bond content, which increase in response to insulin action, had the weakest correlation with insulin resistance. Taken together, these data show that individual TAGs respond differentially to insulin activity and sensitivity, both acutely and over time.
We demonstrated a positive relationship between each TAG’s correlation with insulin resistance and its ability to predict type 2 diabetes in FHS (Figure 5D). Contrary to the prevailing view of bulk triglycerides as an adverse risk factor, we identified specific TAGs that are associated with either an increased or decreased risk of diabetes. Further, these risk markers were altered up to 12 years prior to disease onset. Integrating the positive and negative risk captured by a TAG of relatively lower carbon number and double bond content (TAG 50:0) and a TAG of relatively higher carbon number and double bond content (TAG 58:10) further improved diabetes prediction. Finally, lipid profiling applied to individuals with and without type 2 diabetes demonstrated that the TAG risk pattern identified in FHS persists in established disease (Figure 6C).
The results of MS/MS analyses demonstrate that the lipid analytes associated with increased diabetes risk are predominantly composed of saturated and monounsaturated fatty acids, whereas lipids associated with decreased diabetes risk are composed of polyunsaturated fatty acids (Figure 7). These data are consistent with prior studies of diabetes prediction, which have relied on the measurement of derivatized fatty acids, following hydrolysis of plasma lipids (19–22). By contrast, our approach is able to view acyl chains in their natural context, across distinct macromolecular species. For instance, dynamic changes after glucose ingestion were notable among TAGs but not SMs, PCs, or CEs (data not shown). This finding directs attention toward TAG-specific mechanisms of acute insulin action. As an example, the increasing proportion of polyunsaturated fatty acids in TAGs during OGTT has been attributed to insulin-mediated inhibition of hormone sensitive lipase: the subsequent decrease in saturated and monounsaturated free fatty acid release from adipose tissue increases the relative amount of polyunsaturated free fatty acids available to the liver for TAG assembly (17, 23). In contrast to the TAG-predominant response to OGTT, the relationship between diabetes risk and acyl chain composition in fasting pre-OGTT plasma was identified across several lipid classes. The breadth of this finding draws attention to general pathways of lipoprotein assembly. For example, insulin is known to increase the hepatic expression of various fatty acid desaturases, including SCD1, D5D, and D6D (24–27), in animals. Whether decreased desaturase activity due to insulin resistance contributes to the lipid risk pattern observed in humans remains unclear.
Although we highlight the upstream significance of insulin action, we note that our conditional logistic regression model adjusts for baseline differences in fasting insulin as well as age, sex, BMI, fasting glucose, total triglycerides, and HDL cholesterol. Further, the downsloping TAG risk pattern persisted in the comparison between cases and controls in the lowest quartile of HOMA-IR (Figure 2B). Finally, dietary differences, as culled from a detailed questionnaire, do not account for differences in lipid profiles between cases and controls. These findings raise the possibility that select lipid predictors not only convey very subtle metabolic disturbances but could also play a causal role in disease pathogenesis.
Several technical limitations warrant mention. First, we acknowledge that our platform does not provide comprehensive coverage of the plasma lipidome. However, by focusing on abundant plasma lipids, we were able to measure more than 100 analytes, while using only 10 μl of valuable archived samples; this feature may facilitate its clinical implementation. Second, Kotronen et al. (28) have shown that lipid profiling of distinct lipoprotein fractions can also inform the relationship between individual lipids and insulin resistance. Although such an approach can provide valuable biologic insights, lipoprotein fractionation is impractical for high-throughput biomarker applications. Finally, our platform does not provide absolute quantitation of lipid analytes. We note, however, that the major thrust of the present findings involves a pattern of diabetes risk and the effect of insulin action on this pattern, as opposed to the absolute quantitation of any specific analyte. The design of assays for specific lipids (e.g., incorporating isotope-labeled standards and using chromatography specifically designed for TAG separation) will permit absolute quantitation and improve the precision of select measurements.
More work is required to extend and validate our findings. The case-control design of our study resulted in the selection of high-risk controls, i.e., individuals with similar baseline metabolic risk factors as cases but who did not later develop type 2 diabetes. As a result, our study is unable to provide formal estimation of the predictive ability of specific lipids in the general population, in which there is a wide spectrum of disease risk. In addition, our study samples included middle-aged to older individuals of predominantly European ancestry, which may limit the generalizability of our findings to younger individuals or other racial/ethnic groups. Although TAG profiling alone may not be sufficiently specific to identify individuals who go on to develop type 2 diabetes, it may contribute to clinical models of diabetes prediction that contain other variables. Thus, future efforts will be directed at measuring specific TAGs in more diverse cohorts and adjudicating to what extent these biomarkers add to established risk predictors at a population level. Finally, further study on how medications, diet, and exercise modulate the lipidome over time may provide insight into their salutary effects on metabolic risk.
In summary, we have applied LC/MS-based profiling to identify a lipidomic signature of diabetes risk. This pattern is most notable among TAGs and is at least in part attributable to the graded relationship between specific TAGs and insulin resistance. These findings, however, do not merely recapitulate available metrics of metabolic risk: select TAGs at each end of the risk signature identify individuals at either an increased or decreased risk of diabetes, above and beyond information provided by age, sex, BMI, fasting glucose, fasting insulin, total triglycerides, and HDL cholesterol. Combining the positive- and negative-risk information in select TAGs further improves risk prediction. Future work will be required to more precisely assess the predictive findings in additional cohorts and to determine whether our findings represent an early marker, effector, or both, of nascent metabolic disease.
Methods
FHS.
The Framingham Offspring Study was initiated in 1971, when 5,124 individuals were enrolled into a longitudinal cohort study (8). Participants in this cohort are examined approximately every 4 years. The fifth examination of this cohort took place from 1991 through 1995. Subjects were excluded from the study if they had diabetes at this baseline exam, defined as a fasting glucose of more than 126 mg/dl and/or the use of glucose-lowering medications (n = 46), or a glucose of more than 200 mg/dl after a standard 2-hour/75-g OGTT after a 12-hour overnight fast (n = 149). Additional exclusion criteria included cardiovascular disease (n = 125), an age of 34 years or younger (n = 56), missing diabetes status at follow up (n = 284), nonfasting status (n = 46), missing covariates (n = 14), and pre-OGTT or post-OGTT plasma sample that was not available (n = 657). Therefore, of 3,799 attendees at the fifth examination, 2,422 were eligible for the present investigation. Information on dietary intake was systematically obtained from a detailed, validated food frequency questionnaire (29). At this and subsequent quadrennial visits, participants underwent a physician-administered physical examination and medical history and routine laboratory tests. The presence of diabetes was ascertained at each visit and defined by a fasting glucose of more than 126 mg/dl or the use of glucose-lowering medications, including insulin (30). The homeostasis model assessment was used as a measure of relative insulin resistance, as in Matthews et al. (31).
Nested case-control design.
During follow up over 3 examinations (up to 12 years), 193 individuals developed new-onset type 2 diabetes in FHS. Logistic regression models were used to generate propensity scores for these 193 cases, using age, BMI, fasting glucose, and hypertension (defined as blood pressure ≥140/90 mmHg or use of antihypertensive therapy); a separate model was estimated for each follow-up examination of each sex. Each case was matched to the control with the closest exam- and sex-specific propensity score (within 0.10 on a scale of 0.0 to 1.0). A propensity-matched control was identified for all but 4 cases, yielding a final study sample of 189 cases and 189 controls.
Pharmacologic studies.
Nondiabetic individuals of more than 18 years of age were enrolled in the ongoing Study to Understand the Genetics of the Acute Response to Metformin and Glipizide in Humans at the MGH. At their first visit, participants received a single dose of 5 mg glipizide while fasting, plasma was collected, and glucose and insulin levels were measured at time 0, 60 minutes, and 120 minutes. After a washout period of 6 days, subjects received 500 mg metformin twice daily for 2 days in order to reduce hepatic gluconeogenesis and then underwent a 75-g OGTT in the presence of metformin. Post-metformin samples at time 0 were compared with plasma drawn at the baseline visit prior to glipizide administration. From the first 164 subjects completing the protocol, 20 participants were selected who represented both high and low ends of the HOMA-IR range.
Acute exercise testing.
We recruited outpatients referred to the MGH Exercise Laboratory for diagnostic treadmill testing (n = 50). In order to study the normal metabolic response to exercise, we selected subjects who met the following inclusion criteria: (a) normal exercise tolerance as defined by estimated peak VO2 greater than 70% predicted; (b) evident maximum effort on the basis of heart rate response greater than 85% predicted in the absence of beta-blockade; and (c) preexercise fasting for at least 4 hours. Exclusion criteria included cessation of exercise by the test supervisor, reversible perfusion defects or electrocardiographic evidence of exercise-induced ischemia, mechanical limitation to exercise, or left ventricular ejection fraction of less than 50%. The 10 individuals with type 2 diabetes all carried a diagnosis of type 2 diabetes in the electronic medical record and were also receiving at least 1 antidiabetes medication.
The study protocols were approved by the Institutional Review Boards of BU Medical Center and MGH, and all participants provided written informed consent. All plasma was collected in EDTA.
Lipid profiling.
Plasma lipid profiles were obtained using a 4000 QTRAP Triple Quadrupole Mass Spectrometer (Applied Biosystems/Sciex), coupled to a 1200 Series Pump (Agilent Technologies) and an HTS PAL Autosampler (Leap Technologies). MultiQuant software (version 1.1; Applied Biosystems/Sciex) was used for automated peak integration, and peaks were manually reviewed for quality of integration. Ammonium acetate, acetic acid, and LC/MS grade solvents were purchased from Sigma-Aldrich. 10 μl of plasma were extracted with 190 μl of isopropanol, containing an internal standard, 1-dodecanoyl-2-tridecanoyl-sn-glycero-3-phosphocholine (Avanti Polar Lipids). After centrifugation, supernatants were injected directly, followed by reverse-phase chromatography, using a 150 × 3.0 mm Prosphere HP C4 column (Grace); mobile phase A was 95:5:0.1 (v/v/v) 10 mM ammonium acetate/methanol/acetic acid; mobile phase B was 99.9:0.1 (v/v) methanol/acetic acid. The column was eluted isocratically with 80% mobile phase A for 2 minutes, followed by a linear gradient to 20% mobile phase A over 1 minute, a linear gradient to 0% mobile phase A over 12 minutes, and then 10 minutes at 0% mobile phase A. MS analyses were carried out using electrospray ionization and Q1 scans in the positive-ion mode. Ion spray voltage was 5.0 kV, and source temperature was 400°C.
Internal standard peak areas were monitored for quality control and used to normalize analyte peak areas. In addition, we performed lipid profiling on pooled plasma samples, spaced every 30 experimental samples in the overall sample queue, enabling detection of temporal drift in instrument performance. Each of these injections into the mass spectrometer was generated from a distinct 10-μl aliquot of pooled plasma, extracted, and processed individually. The CVs for each lipid analyte across a total of 29 pooled plasma samples are shown in Supplemental Figure 3. Forty-six percent of the analytes had CVs of less than or equal to 10%, and 85% of the analytes had CVs of less than or equal to 20%. For each lipid analyte, the first number denotes the total number of carbons in the lipid acyl chain(s), and the second number (after the colon) denotes the total number of double bonds in the lipid acyl chain(s).
Tandem MS/MS analyses.
MS/MS analyses of pooled plasma were obtained on a 4000 QTRAP Triple Quadrupole Mass Spectrometer. Sample extraction and chromatography were performed as above. After electrospray ionization, enhanced product ion scans were performed in the positive-ion mode for each TAG, PC, and DAG monitored by our lipid profiling platform as well as for LPC 22:6, SM 22:0, and LPE 18:2. We fragmented the Na+ adduct of each TAG, and product ion scans were analyzed for the neutral loss of individual acyl chains as either a R-COOH or R-COONa fragment. The H+ adduct of each PC was fragmented, and product ion scans were monitored for the neutral loss of acyl chains as a R-COOH fragment and for the neutral loss of phosphocholine. Product ion scans for LPC 22:6, SM 22:0, and LPE 18:2 were monitored for the neutral loss of phosphocholine (LPC 22:6 and SM 22:0) or phosphoethanolamine (LPE 18:2). Ion spray voltage was 5.0 kV, source temperature was 450°C, and collision energies were set between 33 and 70.
Statistics.
Lipid levels were log transformed, because raw data were highly skewed. Lipid levels and the percentage change in lipid levels after OGTT were compared in the FHS matched–pair sample using paired t tests (2 tailed). We also performed conditional (matched pairs) logistic regression analyses to estimate the relative risk of diabetes at different lipid values. For these analyses, the lipid analytes were analyzed as continuous variables (log transformed and scaled to SD of 1) and also as categorical variables (values 1, 2, 3, 4 were assigned, using as cut-off points the sex-specific quartiles of the lipids in controls). Regression analyses were adjusted for age, sex, BMI, fasting glucose, fasting insulin, total triglycerides, and HDL cholesterol. However, case-control pairs were broken for the comparison of cases in the bottom quartile of HOMA-IR versus controls in the bottom quartile of HOMA-IR. Spearman correlation coefficients were calculated between lipid levels and HOMA-IR. A P value for trend was obtained by entering the quartile score into the model as variable, where the lowest quartile was considered the referent. The significance threshold for all analyses was set at P ≤ 0.05. All analyses were performed using SAS software version 9.1.3 (SAS Institute).
Supplementary Material
Acknowledgments
This work was supported by NIH contracts N01-HC-25195 and R01-DK-HL081572, the Donald W. Reynolds Foundation, the Leducq Foundation, and the American Heart Association. E.P. Rhee received support from the NIH grant T32-DK-00754023. G.A. Walford is supported by the Endocrine Fellows Foundation. J.C. Florez is also supported by the MGH and a Clinical Scientist Development Award from the Doris Duke Charitable Foundation. We also acknowledge David Altshuler for his support.
Footnotes
Conflict of interest: The authors have declared that no conflict of interest exists.
Citation for this article: J Clin Invest. 2011;121(4):1402–1411. doi:10.1172/JCI44442.
References
- 1.Chien K, et al. A prediction model for type 2 diabetes risk among Chinese people. Diabetologia. 2009;52(3):443–450. doi: 10.1007/s00125-008-1232-4. [DOI] [PubMed] [Google Scholar]
- 2.D’Agostino RB, Jr, Hamman RF, Karter AJ, Mykkanen L, Wagenknecht LE, Haffner SM. Cardiovascular disease risk factors predict the development of type 2 diabetes: the insulin resistance atherosclerosis study. Diabetes Care. 2004;27(9):2234–2240. doi: 10.2337/diacare.27.9.2234. [DOI] [PubMed] [Google Scholar]
- 3.Kahn HS, Cheng YJ, Thompson TJ, Imperatore G, Gregg EW. Two risk-scoring systems for predicting incident diabetes mellitus in U.S. adults age 45 to 64 years. Ann Intern Med. 2009;150(11):741–751. doi: 10.7326/0003-4819-150-11-200906020-00002. [DOI] [PubMed] [Google Scholar]
- 4.Schulze MB, et al. Use of multiple metabolic and genetic markers to improve the prediction of type 2 diabetes: the EPIC-Potsdam Study. Diabetes Care. 2009;32(11):2116–2119. doi: 10.2337/dc09-0197. [DOI] [PMC free article] [PubMed] [Google Scholar]
- 5.Wilson PW, Meigs JB, Sullivan L, Fox CS, Nathan DM, D’Agostino RB Sr. Prediction of incident diabetes mellitus in middle-aged adults: the Framingham Offspring Study. Arch Intern Med. 2007;167(10):1068–1074. doi: 10.1001/archinte.167.10.1068. [DOI] [PubMed] [Google Scholar]
- 6.Stein EA, Myers GL. National Cholesterol Education Program recommendations for triglyceride measurement: executive summary. The National Cholesterol Education Program Working Group on Lipoprotein Measurement. Clin Chem. 1995;41(10):1421–1426. [PubMed] [Google Scholar]
- 7.Wilson PW, D’Agostino RB, Levy D, Belanger AM, Silbershatz H, Kannel WB. Prediction of coronary heart disease using risk factor categories. Circulation. 1998;97(18):1837–1847. doi: 10.1161/01.cir.97.18.1837. [DOI] [PubMed] [Google Scholar]
- 8.Kannel WB, Feinleib M, McNamara PM, Garrison RJ, Castelli WP. An investigation of coronary heart disease in families: the Framingham Offspring Study. Am J Epidemiol. 1979;110(3):281–290. doi: 10.1093/oxfordjournals.aje.a112813. [DOI] [PubMed] [Google Scholar]
- 9.Shaham O, et al. Metabolic profiling of the human response to a glucose challenge reveals distinct axes of insulin sensitivity. Mol Syst Biol. 2008;4:214. doi: 10.1038/msb.2008.50. [DOI] [PMC free article] [PubMed] [Google Scholar]
- 10.Chu CA, Wiernsperger N, Muscato N, Knauf M, Neal DW, Cherrington AD. The acute effect of metformin on glucose production in the conscious dog is primarily attributable to inhibition of glycogenolysis. Metabolism. 2000;49(12):1619–1626. doi: 10.1053/meta.2000.18561. [DOI] [PubMed] [Google Scholar]
- 11.Henriksen EJ. Invited review: Effects of acute exercise and exercise training on insulin resistance. J Appl Physiol. 2002;93(2):788–796. doi: 10.1152/japplphysiol.01219.2001. [DOI] [PubMed] [Google Scholar]
- 12.Holloszy JO. Exercise-induced increase in muscle insulin sensitivity. J Appl Physiol. 2005;99(1):338–343. doi: 10.1152/japplphysiol.00123.2005. [DOI] [PubMed] [Google Scholar]
- 13.German JB, Gillies LA, Smilowitz JT, Zivkovic AM, Watkins SM. Lipidomics and lipid profiling in metabolomics. Curr Opin Lipidol. 2007;18(1):66–71. doi: 10.1097/MOL.0b013e328012d911. [DOI] [PubMed] [Google Scholar]
- 14.Seppanen-Laakso T, Oresic M. How to study lipidomes. J Mol Endocrinol. 2009;42(3):185–190. doi: 10.1677/JME-08-0150. [DOI] [PubMed] [Google Scholar]
- 15.Wenk MR. The emerging field of lipidomics. Nat Rev Drug Discov. 2005;4(7):594–610. doi: 10.1038/nrd1776. [DOI] [PubMed] [Google Scholar]
- 16.Wopereis S, et al. Metabolic profiling of the response to an oral glucose tolerance test detects subtle metabolic changes. PLoS One. 2009;4(2):e4525. doi: 10.1371/journal.pone.0004525. [DOI] [PMC free article] [PubMed] [Google Scholar]
- 17.Zhao X, et al. Changes of the plasma metabolome during an oral glucose tolerance test: is there more than glucose to look at? Am J Physiol Endocrinol Metab. 2009;296(2):E384–E393. doi: 10.1152/ajpendo.90748.2008. [DOI] [PubMed] [Google Scholar]
- 18.Schwab U, et al. Triacylglycerol fatty acid composition in diet-induced weight loss in subjects with abnormal glucose metabolism--the GENOBIN study. PLoS One. 2008;3(7):e2630. doi: 10.1371/journal.pone.0002630. [DOI] [PMC free article] [PubMed] [Google Scholar]
- 19.Hodge AM, et al. Plasma phospholipid and dietary fatty acids as predictors of type 2 diabetes: interpreting the role of linoleic acid. Am J Clin Nutr. 2007;86(1):189–197. doi: 10.1093/ajcn/86.1.189. [DOI] [PubMed] [Google Scholar]
- 20.Laaksonen DE, et al. Serum fatty acid composition predicts development of impaired fasting glycaemia and diabetes in middle-aged men. Diabet Med. 2002;19(6):456–464. doi: 10.1046/j.1464-5491.2002.00707.x. [DOI] [PubMed] [Google Scholar]
- 21.Vessby B, Aro A, Skarfors E, Berglund L, Salminen I, Lithell H. The risk to develop NIDDM is related to the fatty acid composition of the serum cholesterol esters. Diabetes. 1994;43(11):1353–1357. doi: 10.2337/diabetes.43.11.1353. [DOI] [PubMed] [Google Scholar]
- 22.Wang L, Folsom AR, Zheng ZJ, Pankow JS, Eckfeldt JH. Plasma fatty acid composition and incidence of diabetes in middle-aged adults: the Atherosclerosis Risk in Communities (ARIC) Study. Am J Clin Nutr. 2003;78(1):91–98. doi: 10.1093/ajcn/78.1.91. [DOI] [PubMed] [Google Scholar]
- 23.Parks EJ, Hellerstein MK. Thematic review series: patient-oriented research. Recent advances in liver triacylglycerol and fatty acid metabolism using stable isotope labeling techniques. J Lipid Res. 2006;47(8):1651–1660. doi: 10.1194/jlr.R600018-JLR200. [DOI] [PubMed] [Google Scholar]
- 24.Guillou H, Zadravec D, Martin PG, Jacobsson A. The key roles of elongases and desaturases in mammalian fatty acid metabolism: Insights from transgenic mice. Prog Lipid Res. 2010;49(2):186–199. doi: 10.1016/j.plipres.2009.12.002. [DOI] [PubMed] [Google Scholar]
- 25.Nakamura MT, Nara TY. Structure, function, and dietary regulation of delta6, delta5, and delta9 desaturases. Annu Rev Nutr. 2004;24:345–376. doi: 10.1146/annurev.nutr.24.121803.063211. [DOI] [PubMed] [Google Scholar]
- 26.Brenner RR. Hormonal modulation of delta6 and delta5 desaturases: case of diabetes. Prostaglandins Leukot Essent Fatty Acids. 2003;68(2):151–162. doi: 10.1016/S0952-3278(02)00265-X. [DOI] [PubMed] [Google Scholar]
- 27.Nakamura MT, Nara TY. Gene regulation of mammalian desaturases. Biochem Soc Trans. 2002;30(pt 6):1076–1079. doi: 10.1042/BST0301076. [DOI] [PubMed] [Google Scholar]
- 28.Kotronen A, et al. Serum saturated fatty acids containing triacylglycerols are better markers of insulin resistance than total serum triacylglycerol concentrations. Diabetologia. 2009;52(4):684–690. doi: 10.1007/s00125-009-1282-2. [DOI] [PubMed] [Google Scholar]
- 29.Rimm EB, Giovannucci EL, Stampfer MJ, Colditz GA, Litin LB, Willett WC. Reproducibility and validity of an expanded self-administered semiquantitative food frequency questionnaire among male health professionals. Am J Epidemiol. 1992;135(10):1114–1126. doi: 10.1093/oxfordjournals.aje.a116211. [DOI] [PubMed] [Google Scholar]
- 30.[No authors listed] Report of the expert committee on the diagnosis and classification of diabetes mellitus. Diabetes Care. 1997;20(7):1183–1197. doi: 10.2337/diacare.20.7.1183. [DOI] [PubMed] [Google Scholar]
- 31.Matthews DR, Hosker JP, Rudenski AS, Naylor BA, Treacher DF, Turner RC. Homeostasis model assessment: insulin resistance and beta-cell function from fasting plasma glucose and insulin concentrations in man. Diabetologia. 1985;28(7):412–419. doi: 10.1007/BF00280883. [DOI] [PubMed] [Google Scholar]
Associated Data
This section collects any data citations, data availability statements, or supplementary materials included in this article.


