

Abstract
Arterial medial calcification (AMC), a hallmark of vascular disease in uremic patients, is highly correlated with serum phosphate levels and cardiovascular mortality. To determine the mechanisms of AMC, mice were made uremic by partial right-side renal ablation (week 0), followed by left-side nephrectomy at week 2. At 3 weeks, mice were switched to a high-phosphate diet, and various parameters of disease progression were examined over time. Serum phosphate, calcium, and fibroblast growth factor 23 (FGF-23) were up-regulated as early as week 4. Whereas serum phosphate and calcium levels declined to normal by 10 weeks, FGF-23 levels remained elevated through 16 weeks, consistent with an increased phosphate load. Elastin turnover and vascular smooth muscle cell (VSMC) phenotype change were early events, detected by week 4 and before AMC. Both AMC and VSMC loss were significantly elevated by week 8. Matrix metalloprotease 2 (MMP-2) and cathepsin S were present at baseline and were significantly elevated at weeks 8 and 12. In contrast, MMP-9 was not up-regulated until week 12. These findings over time suggest that VSMC phenotype change and VSMC loss (early phosphate-dependent events) may be necessary and sufficient to promote AMC in uremic mice fed a high-phosphate diet, whereas elastin degradation might be necessary but is not sufficient to induce AMC (because elastin degradation occurred also in uremic mice on a normal-phosphate diet, but they did not develop AMC).
Arterial medial calcification (AMC), the pathological deposition of calcium phosphate in the form of apatite in the media of blood vessels, is prevalent in aging, in diabetes, and especially in patients with end-stage renal disease. AMC is associated with an elevated risk of cardiovascular morbidity and mortality.1–3 Indeed, cardiovascular disease accounts for almost half the deaths associated with end-stage renal disease, according to the United States Renal Data System (http://www.usrds.org/). AMC likely contributes to this high risk by increasing vascular stiffness, which leads to higher pulse wave velocity and pulse pressures, both of which are highly associated with increased mortality in the dialysis population.2 Clinically, increased vascular stiffness leads to hypertension, left ventricular hypertrophy, heart failure, and compromised coronary perfusion.4
The exact mechanisms causing AMC in uremia remain unknown, but elevated phosphate burden has been implicated as an important risk factor. Elevated serum phosphate levels are highly correlated with calcification of coronary and peripheral arteries and cardiac valves in patients with chronic kidney disease (CKD).5,6 Furthermore, meta-analysis of data from hemodialysis patients demonstrated a positive correlation between elevated serum phosphate levels and mortality, and a dramatic increase in deaths was observed among patients with serum phosphate levels >6.5 mg/dL.7 More recent studies have shown that relatively small elevations in serum phosphate in the high normal range (3.5 to 4.5 mg/dL) are strongly correlated with increased risk of cardiovascular mortality in CKD.8 In addition, fibroblast growth factor 23 (FGF-23), a major phosphaturic hormone, was elevated in hemodialysis patients and was independently associated with mortality.9 Finally, treatment with non-calcium-containing phosphate binders attenuated progression of vascular calcification in prevalent dialysis patients and decreased mortality in incident dialysis patients.10,11 Thus, understanding the mechanisms by which dysregulated phosphate metabolism promotes vascular calcification has become a high priority.
Multiple mechanisms may be involved in initiation and progression of vascular calcification in response to dysregulated mineral metabolism. Elevated phosphate induced vascular smooth muscle cell (VSMC) calcification in vitro,12,13 and this was dependent on an osteochondrogenic phenotype change mediated by the sodium-dependent phosphate cotransporter Pit-1.14 The phenotype change was characterized by decreased expression of the VSMC lineage markers smooth muscle 22 (SM22) and α -smooth muscle actin (α-SMA) and up-regulation of the osteochondrogenic markers Runx2/Cbfa1, osteocalcin, osteopontin, and alkaline phosphatase. Additionally, elevated calcium and phosphate levels were shown to induce basic calcium phosphate-enriched vesicle release from viable VSMCs, as well as from apoptotic VSMCs in vitro, and these vesicles were hypothesized to serve as nidi for vascular calcification.15 More recently, elevated calcium and phosphate were shown to induce VSMC apoptosis in uremic human vessel rings in culture, and inhibition of VSMC apoptosis with carbobenzoxy-valyl-alanyl-aspartyl-[O-methyl]-fluoromethylketone blocked associated vessel calcification.16 Finally, elastin degradation accelerated phosphate-induced matrix calcification of VSMCs in vitro,17 and deficiency of cathepsin S (an elastolytic enzyme) abolished atherosclerotic plaque and aortic valve calcification in uremic ApoE-deficient mice.18 Although these findings are provocative, which of these mechanisms (if any) is predominant in initiating or sustaining uremia- and phosphate-induced AMC in vivo is not yet clear.
To address these questions, our research group recently developed a mouse model of AMC induced by uremia and high-phosphate (HP) feeding in calcification-prone DBA/2 mice.19 (The relevance of a mouse model of chronic uremia to human end-stage renal disease dates back at least to the 1988 model of Gagnon and Gallimore.20) Uremia was induced by renal ablation of varying magnitudes. Extensive AMC in the absence of inflammation or atherosclerosis developed when uremic mice were placed on a HP diet, but not in uremic mice placed on a normal-phosphate (NP) diet. Severity of uremia and phosphate burden were both important determinants of AMC in DBA/2 mice, similar to the findings in patients with CKD.
Although evidence for osteochondrogenic phenotypic change, matrix degradation, and VSMC loss was observed in calcified vessels in the DBA/2 uremic mouse model after long-term HP feeding,19 the relationship of these changes with respect to initiation or progression of AMC have not been analyzed. Thus, the goal of the present study was to determine temporal and spatial relationships between AMC and (1) osteochondrogenic gene expression, (2) elastin degradation, and (3) cell death in this mouse model of CKD achieved through partial renal ablation and HP feeding.
Materials and Methods
Animals and Diets
Female DBA/2 mice were purchased from Taconic Farms (Germantown, NY) and were maintained in a temperature-controlled room on a 12-hour day/night cycle and a specific pathogen-free environment. Normal or HP diets were purchased from Dyets (Bethlehem, PA). The HP diet was starch-based and contained 0.9% phosphate, 0.6% calcium, and 0.07% magnesium. The NP diet was starch-based and contained 0.5% phosphate, 0.6% calcium, and 0.07% magnesium. Mice had access to food and water ad libitum and were maintained in compliance with the National Research Council 1996 Guide for the Care and Use of Laboratory Animals (available at http://www.nap.edu/openbook.php?record_id=5140). All procedural methods and protocols were approved by the Institutional Animal Care and Use Committee of the University of Washington in Seattle.
Surgical Procedure
Uremia was induced in 20- to 21-week-old mice after the two-step surgical procedure for partial renal ablation, as previously described.19 Briefly, during surgery 1, the right kidney was exposed, decapsulated, and electrocauterized. After a 2-week recovery period, left-side total nephrectomy was performed (surgery 2). Baseline mice (20 to 21 weeks old, before uremia, before diet switch) were not surgically manipulated and showed serum, biochemical, and histological parameters similar to those of sham-operated mice19 and thus were used as controls in the present study. Mice were placed on the NP or HP diet within 1 week of surgery 2; the diet was terminated at various times, as indicated later in the text.
For baseline and the 4-, 8-, and 12-week time points, mice were anesthetized with 0.4 to 0.5 mg/kg pentobarbital, followed by exsanguination via cardiac puncture for blood collection. The aortas were dissected into several parts, collected, and snap-frozen in liquid nitrogen (for calcium quantitation and Western blot) and fixed in methyl Carnoy's solution or formalin, followed by processing and paraffin embedding. For the 16-week time point, blood was collected and mice were euthanized as above, followed by perfusion-fixation at physiological pressure with 4% buffered formalin or methyl Carnoy's solution; these pressure-fixed tissues were used for histological assessments.
Serum Chemistry
Serum was collected by cardiac puncture or from saphenous vein at baseline and at 4, 6, 8, 10, 12, and 16 weeks and was harvested by centrifugation at 1000 ×g for 10 minutes. Serum chemistries (blood urea nitrogen, phosphate, and calcium) were analyzed with a standard autoanalyzer at Phoenix Central Laboratory (Everett, WA). Serum FGF-23 levels were determined using a mouse full-length FGF-23 enzyme-linked immunosorbent assay kit (Kainos, Tokyo, Japan).
Quantitative Biochemical Analysis of Aortic Calcium and Desmosine
Dissected aortic tissues were frozen, lyophilized, and decalcified with 0.6 N HCl at 37°C for 24 hours. After centrifugation, the calcium content of the supernatant was determined colorimetrically with the o-cresolphthalein complexone kit (Teco Diagnostics, Anaheim, CA) as previously described.21 Aortic calcium content was normalized to the dry weight of the tissue and expressed as μg Ca/mg dry weight. Although the vessels for the desmosine assay from the time-course group were all derived from the same mice described above, the aortic tissues for the desmosine assay comparing HP to NP treatments had been frozen and stored from a previous study but processed in a similar manner.19 Desmosine assay was performed as described previously.22 Vessels from mice at week 16 were not included in calcium or elastin assays, because they were perfusion-fixed at this time point.
Histology and Immunohistochemistry
Tissues were fixed in methyl Carnoy's solution (3:1, methanol/acetic acid, 4 hours) or formalin (overnight), then transferred to 70% ethanol and embedded in paraffin using an automated tissue processor; 5-μm sections were prepared. For immunohistochemical staining, sections were deparaffinized, rehydrated, and then blocked, first with 0.3% H2O2 and then with avidin and biotin blocking reagents (Vector Laboratories, Burlingame, CA), and finally with PBS containing 0.25% to 0.5% bovine serum albumin and 4% serum (same species in which the secondary antibody was raised). Polyclonal goat anti-mouse SM22α (ab10135; Abcam, Cambridge, MA), goat anti-mouse/rat matrix metalloprotease 2 (MMP-2) (AF1488; R&D Systems, Minneapolis, MN), rabbit polyclonal to MMP-9 (ab38898; Abcam), and monoclonal rat anti-human Runx2/Cbfa1 (MAB2006; R&D Systems) were used for immunostaining. After incubation at room temperature for 1 hour, the sections were incubated with biotinylated secondary antibody for 30 minutes (Vector Laboratories) before streptavidin-conjugated peroxidase staining using 3,3′-diaminobenzidine as the chromogen. Species-specific IgG was used as negative immunohistochemical staining control to account for nonspecific staining. Counterstaining was performed with 2% methyl green or Harris hematoxylin, followed by dehydration and mounting. Two different blinded investigators scored the slides. Relative levels of staining were scored between 0 and 4 according to the following criteria: 0 = no specific staining, 1 = 25% of maximum staining, 2 = 50% of maximum staining, 3 = 75% of maximum staining, and 4 = maximum staining.
For counting nuclei, sections were deparaffinized with xylene, followed by rehydration. Sections were mounted with Vectashield containing DAPI for nuclear staining. Elastin autofluorescence (detected using a tetramethyl rhodamine isothiocyanate filter) was used to demarcate the aortic medial area to exclude intimal and adventitial cells. Scion Image software (v alpha 4.0.3.2, Scion Corporation, Frederick, MD) was used to quantify the area. Eosin fluorescence was used to image elastin breaks using an upright fluorescence microscope (E800; Nikon, Tokyo, Japan).
Western Blot Analysis of Cathepsin S
Protein samples from carotids of at least three mice per group were snap-frozen and stored at −80°C. Protein samples were loaded and separated by 10% SDS-polyacrylamide gel electrophoresis, followed by transfer to polyvinylidene difluoride membrane. The membranes were then blotted using goat anti-cathepsin S antibody (ab18822; Abcam) and horseradish peroxidase–conjugated anti-goat secondary antibody. Signal was detected with enhanced chemiluminescence reagents (Perkin Elmer Life Science, Boston, MA). Membranes were then stained with Amido Black for total protein content determination. Blots were quantified using Image J software (v1.44, NIH, Bethesda, MD) and normalized to internal protein bands.
Statistical Analysis
Statistical analyses were performed using SPSS software v16.0 (SPSS, Chicago, IL), except as otherwise stated. Group means and variances were determined using analysis of variance, and values are presented as means ± SEM. Post hoc pair-wise comparisons of group means were performed using Fisher's protected least significant difference test, and differences between groups were considered statistically significant at a P value of <0.05. For biochemical analysis of calcium, nonparametric Kruskal-Wallis one-way analysis of variance, followed by Bonferroni correction, was performed using the Analyse-it software package (analyse it Software, Leeds, UK).
Results
To study potential mechanisms for initiation and progression of AMC, the temporal and spatial relationships between the appearance of AMC and osteochondrogenic gene expression, matrix degradation, and cell death were investigated in uremic HP-fed mice.
Time Course of Serum Biochemical Changes in Uremic HP-Fed Mice
Average baseline blood urea nitrogen values were 17.2 ± 0.6 mg/dL (Figure 1A).After renal ablation and HP feeding, blood urea nitrogen values significantly increased from baseline and remained elevated at all time points. Serum phosphate levels increased significantly (P < 0.005) from baseline (10.4 ± 0.2 mg/dL, n = 49) to week 4 (12.0 ± 0.5 mg/dL, n = 9) and remained elevated at weeks 6 and 8 (Figure 1B), although these values did not attain statistical significance. By 10 weeks, serum phosphate levels returned to baseline levels and remained unchanged through 16 weeks. A similar transient increase in serum calcium was also observed early in uremic mice fed the HP diet. FGF-23 levels (previously found to be highly correlated with AMC19,23,24) were up-regulated early after induction of uremia and HP feeding. The FGF-23 values at week 4 (900.9 ± 87.4 pg/ml, n = 10) were significantly higher (P < 0.001) than baseline values (134.5 ± 15.8 pg/ml, n = 10) (Figure 1D).
Figure 1.
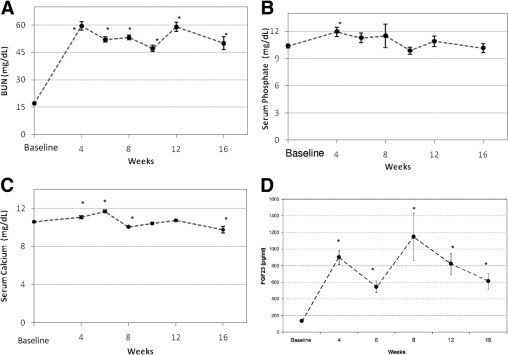
Serum chemistry profiles over time: blood urea nitrogen (BUN) (A), phosphate (B), calcium (C), and FGF-23 (D) at baseline (n = 48), week 4 (n = 9), week 6/7 (n = 26), week 8 (n = 10), week 10/11 (n = 17), week 12 (n = 8), and week 16 (n = 8). Data are reported as means ± SEM. *P < 0.05, compared with baseline. All mice in the study were used for blood draws at the baseline, week 6/7, and week 10/11 time points.
Time Course of AMC in Uremic HP-Fed Mice
The abdominal aorta and the aortic arch regions were chosen to quantify calcium content, because these regions consistently showed high levels of AMC in our previous study.19 Aortic arch calcium content was significantly elevated by week 4, compared with baseline [3.4 ± 0.9 (n = 9) vs. 2.0 ± 0.4 μg/mg dry weight (n = 8), respectively; P = 0.004]. It further increased at week 8 (13.0 ± 4.6 μg/mg dry weight; n = 10) and week 12 (23.3 ± 3.0 μg/mg dry weight; n = 9), compared with baseline (P < 0.0001 at weeks 8 and 12) (Figure 2A).
Figure 2.
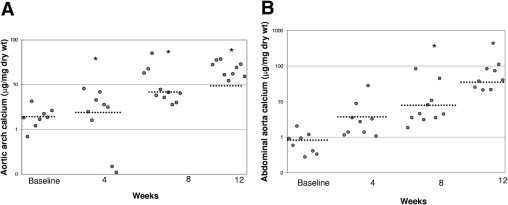
Incidence of arterial medial calcification in CKD. Progression of calcification normalized to dry weight of aortic arch (A) at baseline (n = 8), week 4 (n = 7), week 8 (n = 10), and week 12 (n = 9), and of abdominal aorta (B) at baseline (n = 8), week 4 (n = 9), week 8 (n = 10), and week 12 (n = 8). Data are reported as means ± SEM. *P < 0.05, compared with baseline.
Calcium accumulation in the abdominal aorta showed a time course similar to that of the aortic arch. Baseline calcium content in the abdominal aorta was 0.8 ± 0.2 μg/mg dry weight (n = 8) and increased to 5.6 ± 4.2 (n = 9) by week 4 (Figure 2B), although this value did not attain statistical significance. Statistically significant increases in calcium content above baseline were observed at week 8 [9.4 ± 4.6 μg/mg dry weight (n = 9); P = 0.0001] and at week 12 [51.3 ± 11.9 μg/mg dry weight (n = 8); P < 0.0001]. These studies suggest that the aortic arch accumulates calcium earlier, but to a lesser extent, than the abdominal aortic region. Notably, the slope of the aortic arch histogram was 7.34, compared with a slope of 15.5 for the abdominal aorta plot, indicating that the abdominal aorta calcified more per unit time than did the arch region.
Representative images of von Kossa staining and H&E staining of adjacent sections in the abdominal aorta at various time points are shown in Figure 3. At baseline (Figure 3A) or at 4 weeks (data not shown), no evidence for apatite deposition was observed under von Kossa staining in any of the mice. By 8 weeks, 4 of 10 animals exhibited apatite deposition. Staining was punctate and localized to small areas along the elastic lamina or between the elastic layers of the arterial media (Figure 3B). Notably, elastin layers in these calcified areas grossly appeared disorganized and disrupted. At 12 weeks, all animals (9/9) displayed von Kossa positivity, and the regions of calcification were larger and more confluent, involving several elastic lamina and the medial layers between them (Figure 3C). By 16 weeks, all animals exhibited calcified aortas, with multiple circumferential deposits in the media (Figure 3D). At all time points, von Kossa staining was found exclusively in the media and not in the adventitia, and no cartilaginous metaplasia, inflammation, or atherosclerotic lesions were observed [as evident from H&E-stained slides (Figure 3, E–H) and data not shown], consistent with previous data.19
Figure 3.
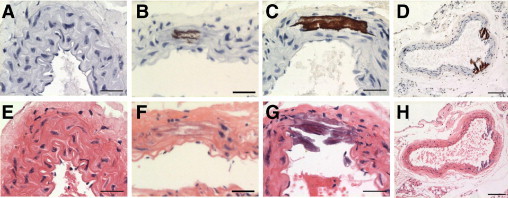
Representative histochemical micrographs of von Kossa staining for baseline (A), week 8 (B), week 12 (C), and week 16 (D) time points, with corresponding H&E-stained slides from adjacent sections (E–H). All sections were of the abdominal aorta region, and nuclei were counterstained with Harris hematoxylin. Scale bars = 30 μm throughout, except scale bar = 100 μm for D and H.
Time Course of VSMC Phenotype Change in Uremic HP-Fed Mice
We previously showed that VSMCs undergo phenotype change in response to high environmental phosphate, characterized by up-regulation of osteochondrogenic markers and down-regulation of SMC lineage markers.12,19,25 Thus, we analyzed the aorta for evidence of VSMC phenotype change by performing immunochemistry for Runx2/Cbfa1, an osteochondrogenic phenotype marker, and SM22α, a SMC lineage marker. All VSMCs in the arterial media were strongly SM22α positive and Runx2/Cbfa1 negative at baseline (Figure 4, A and B). Over time, SM22α levels in the cytoplasm of medial cells decreased, and by 16 weeks, most medial cells had very low levels of SM22α or lacked SM22α staining altogether (Figure 4C). Conversely, nuclear Runx2/Cbfa1 staining increased in the arterial media over time (Figure 4D). Semiquantitative analysis of the immunostaining showed a similar trend (Figure 4, E and F). Thus, osteochondrogenic phenotype change in VSMCs occurred very early in the uremic HP-fed mice and preceded apatite deposition in the abdominal aorta.
Figure 4.
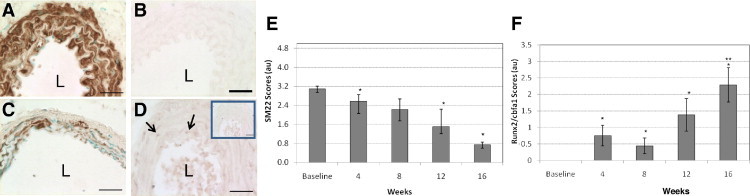
Representative micrographs of immunohistochemical staining. Baseline staining of SM22α (A) and Runx2/Cbfa1 (B), week 16 staining of SM22α (C), and week 4 staining of Runx2/Cbfa1 (D), arrows indicate positively stained nuclei. L, lumen. Inset shows nonspecific IgG staining as a control. All sections were of the abdominal aorta region, and SM22α nuclei were counterstained with methyl green. Scale bars = 30 μm. Immunohistochemistry scores for SM22α (E) and Runx2/Cbfa1 (F) were determined as described in the Materials and Methods section. Data are reported as means ± SEM. *P < 0.05, compared with baseline. **P < 0.05, compared with week 4 and week 8.
Timeline of Elastin Degradation in Uremic HP-Fed Mice
As noted above, AMC at early time points was colocalized with regions of the elastin-rich vascular matrix that appeared disrupted and/or disorganized. To determine whether elastin degradation occurred in this model and to investigate its temporal and spatial relationship to AMC, elastin histochemical staining was assessed, as well as biochemical determination of aortic desmosine content.
Use of von Kossa staining in the aortic media (Figure 5, A–E) and eosin staining in adjacent sections (Figure 5, F–J) allowed observation of elastin remodeling and breaks at various time points after uremia and HP feeding. Baseline control aortas (Figure 5A) showed lack of calcification and intact elastic lamellae (Figure 5F). By week 4, the elastic lamellae appeared disorganized and had detectable elastin breaks (Figure 5G), despite lack of calcification (Figure 5B), indicating that elastin remodeling occurred even in the absence of AMC. As already noted, AMC progressively increased over 8 (Figure 5C), 12 (Figure 5D), and 16 (Figure 5E) weeks. Elastin disorganization and breaks were readily observed in both calcified and noncalcified areas of the aorta at week 8 (Figure 5H), and had increased by weeks 12 (Figure 5I) and 16 (Figure 5J). Calcification, however, was observed exclusively in association with areas of severe elastin breaks.
Figure 5.
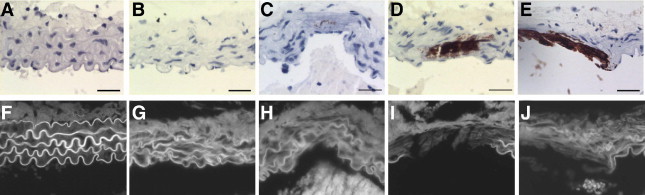
Progression of elastinolysis and calcification in CKD abdominal aortic media in von Kossa images at baseline and at weeks 4, 8, 12, and 16 (A–E, respectively), with corresponding eosin fluorescence images in adjacent sections (F–J). Scale bars = 30 μm.
To quantitate elastin remodeling desmosine (a unique amino acid found in crosslinked elastin) was assessed biochemically.22 A significant (P < 0.05) increase in aortic desmosine content was observed at week 4 (4213.6 ± 271.1 pmol/mg protein, n = 7), compared with baseline levels (2348.2 ± 731.7 pmol/mg protein, n = 6) (Figure 6). Levels at weeks 8 and 12 (4186.5 ± 338.6 and 4274.6 ± 362.1 pmol/mg protein, respectively) were also significantly different from baseline (P < 0.05), but did not differ from week 4 levels, indicating that desmosine levels increased early and stayed elevated.
Figure 6.
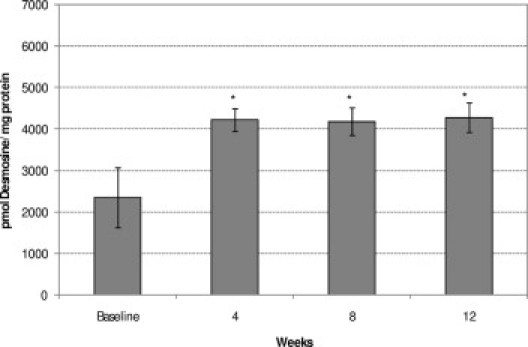
Comparison of progression of aortic desmosine content in CKD at baseline (n = 6) and at week 4 (n = 7), week 8 (n = 5), and week 12 (n = 8). Data are reported as means ± SEM. *P < 0.05, compared with baseline.
Because elastin remodeling seemed to occur independently of AMC, we wondered whether HP feeding was required for this pathology in uremic mice. To determine this, we examined the desmosine content of the aortic arch in a separate set of uremic mice fed a normal or HP diet for 11 weeks (14 weeks from surgery 1), available from a previous study.19 Compared with baseline, aortic tissues from both NP-fed and HP-fed mice had elevated desmosine contents: uremic mice fed a normal diet for 11 weeks (n = 4) had 2839.5 ± 1419.8 pmol/mg protein and uremic HP-fed mice had 3160.4 ± 1824.7 pmol/mg protein (n = 3); these values were not significantly different from each other. Thus, HP feeding does not appear to be required for uremia-induced elastin remodeling. Nonetheless, because elastin remodeling occurred in the absence of AMC in the present study, and because uremic mice fed a NP diet never develop AMC (present study and previous findings19), these data suggest that elastin remodeling may be necessary but is not sufficient for initiation of AMC. Therefore, uremia alone, in the absence of phosphate feeding, may drive elastin remodeling. To our knowledge, this is the first description of a uremia-driven elastodystrophy in the arterial media of mice.
Timeline of MMP Expression in Uremic HP-Fed Mice
MMP-2, MMP-9, and cathepsin S are major proteases implicated in arterial elastolysis, and have been recently associated with mortality in CKD.18,26,27 A representative micrograph of a MMP-2–positive aorta is presented in Figure 7A, inset, with relative quantitation of the staining in the accompanying graph. MMP-2 staining was easily detected in baseline controls and increased progressively from week 8 to week 16. Faint, diffuse medial staining was observed in approximately half of the baseline samples, whereas 1 of 8 mice showed medial staining at week 4. By week 8, the intensity of the MMP-2 expression in the media had increased, and 6 of 10 mice were MMP-2 positive. At week 12 and at week 16 (Figure 7A, inset), the medial staining intensity increased almost twofold from week 4 and eightfold from baseline (7/9 and 6/8 were MMP-2 positive). Medial SMCs were strongly positive, as was the extracellular matrix including elastin fibers surrounding calcified deposits, but little staining was noted within the calcified deposits themselves. Diffuse periadventitial staining was observed at all time points. Western blotting confirmed the findings of immunochemical staining, and indicated that both pro (72 kDa) and active (64 kDa) forms of MMP-2 were present in the vessels at all time points (data not shown). Finally, MMP-2 levels in uremic mice fed a NP diet were similar to baseline (data not shown).
Figure 7.
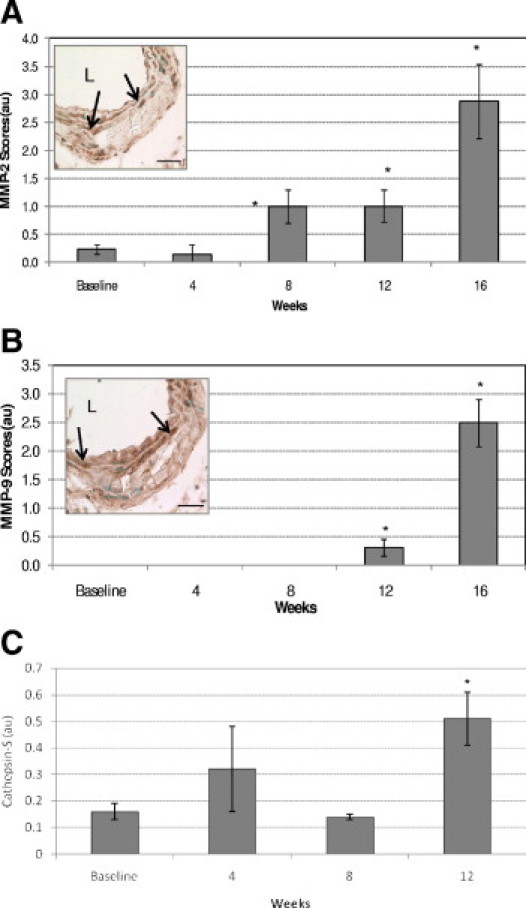
Progression of MMP activation in CKD. Quantitative analysis of MMP-2 (A) and MMP-9 (B) immunostaining. Insets: Week 16 micrograph. All sections were of the abdominal aorta region; nuclei were counterstained with methyl green. Arrows indicate positively stained cells. L, lumen. Scale bars = 30 μm. (C) Cathepsin SWestern blot quantitation normalized to internal protein control. Data are reported as means ± SEM. *P < 0.05, compared with baseline.
A representative micrograph of a MMP-9 positive aorta is presented in Figure 7B, inset, with a graph of relative quantitation of the staining. Notably, MMP-9 expression showed a delayed pattern, relative to MMP-2, with little or no specific immunostaining observed at baseline, week 4, or week 8. Faint, diffuse medial staining was observed in 3 of 8 mice at week 12 and in all samples at week 16 (Figure 7B, inset). MMP-9 staining intensity was three- to sixfold higher at week 16 than at week 12. Both medial SMCs and the extracellular matrix showed positivity. Although the classical ∼92-kDa pro form of MMP-9 was not detected by Western blot analysis, an ∼180-kDa band (likely a homodimer of pro-MMP-928) was observed at all time points, including baseline. The 65-kDa active form of MMP-9 was detected only in week 12 samples (data not shown). Finally, we were unable to detect cathepsin S in our samples by immunohistochemistry because of unacceptably low signal-to-noise ratios using a commercially available cathepsin S antibody (data not shown). Western blot analysis, however, demonstrated presence of cathepsin S in baseline samples, but levels were significantly elevated (P < 0.05) only at week 12 [0.51 ± 0.1 arbitrary units (au)], compared with control (0.16 ± 0.13 au) (Figure 7C).
Time Course of VSMC Death in Uremic HP-Fed Mice
VSMC number was determined by nuclei counting using DAPI. The VSMC number was normalized to the area (Figure 8). Baseline VSMC count (n = 6) was 52 ± 5/unit area. VSMC count at weeks 4, 8, 12, and 16 was 37 ± 5 (n = 7), 25 ± 2 (n = 7), 24 ± 2 (n = 8), and 25 ± 2 (n = 7), respectively. By week 8, the cell numbers dropped to almost half of baseline values, significantly different from baseline (P < 0.001). No statistical differences were found between week 4 and baseline, indicating that VSMC loss was probably initiated between weeks 4 and 8. Notably, no significant correlation was found between VSMC loss and calcification (r = 0.293 and 0.502 for abdominal aorta and arch, respectively; P = 0.089 and 0.171, respectively). Finally, no VSMC death was observed in uremic mice fed a NP diet for 11 weeks, compared with baseline (data not shown), suggesting that VSMC death, induced by phosphate loading, may be a prerequisite for the progression of AMC in uremic mice.
Figure 8.
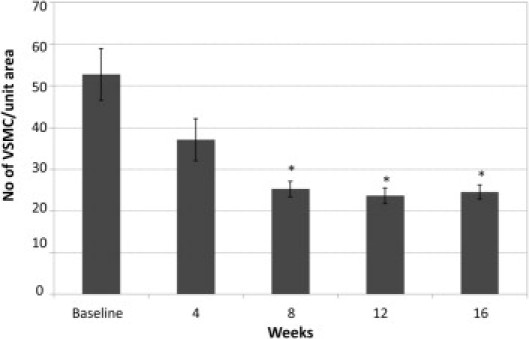
Vascular smooth muscle cell loss in CKD. Comparison of number of VSMC/unit area at baseline (n = 7) and at week 4 (n = 8), week 8 (n = 6), week 12 (n = 9), and week 16 (n = 8). Data are reported as means ± SEM. *P < 0.05, compared with baseline.
Discussion
We used a previously developed mouse model of CKD19 to examine the temporal and spatial relationships of specific serum and vascular wall events to the development of AMC. Transient elevations in serum calcium and phosphate levels were observed in uremic mice after initiation of the HP diet. Although serum phosphate levels dropped back to normal by the end of the study, we observed chronic elevation of serum FGF-23 levels, not unlike what is observed in humans at early stages of CKD.9 These elevations may also be important for early induction of the osteochondrogenic phenotype change in VSMCs reported here. An elevation of nuclear Runx2/Cbfa-1 and gradual loss of SM22α in VSMCs was observed before the appearance of AMC starting at week 4, and coincided with elevations of serum phosphate and calcium levels. Like AMC, HP feeding was required for the appearance of this osteochondrogenic phenotype in uremic mice.19
We have previously shown that treatment with elevated phosphate induces cultured VSMCs to undergo a profound phenotypic transition that involves loss of SMC lineage markers representative of the contractile phenotype, including α-SMA and SM22-α, and gain of osteochondrogenic markers such as osteopontin, Runx2/Cbfa-1, alkaline phosphatase, and osteocalcin.12,19 Elevated calcium levels have also been shown to induce SMC phenotype change in vitro, especially under conditions of hyperphosphatemia.15,16 The expression of Runx2/Cbfa1 before the appearance of vascular calcification in vivo is consistent with previous in vitro findings12,13 and was also observed in matrix Gla protein (MGP)-null mice, which undergo spontaneous AMC.25 Furthermore, VSMC osteochondrogenic phenotypic change has been observed in human vessels obtained from adolescent dialysis patients before vascular mineral deposition, and this adaptation has been suggested to protect against calcium overload.16 Runx2/Cbfa1 is a transcription factor required for osteoblast and chondrocyte differentiation,29 and has been shown to be required for SMC phenotype change and mineralization in vitro.30 Thus, early up-regulation of Runx2/Cbfa1 in SMC after uremia and phosphate feeding is consistent with a possible role for this factor as an initiating event in the calcification cascade.
One of the most exciting findings of this study was the observation of an early and striking elastin remodeling in uremic mouse arteries that occurred independent of HP feeding and development of AMC. Loss of medial arterial elastin leads to increased arterial stiffness and increases in pulse wave velocity,31 and elevated pulse wave velocity is an independent predictor of mortality in patients with end-stage renal disease.2,32 Although very few studies have examined artery wall elastin in the presence of HP feeding or hyperphosphatemia in experimental models of uremia, Amann et al33 noted that subtotally nephrectomized rats showed decreased relative content and focal rupture of elastic fibers, compared with sham-operated rats, and that these changes occurred in the absence of calcification. In humans, Ibels et al34 noted disruption and reduplication of the internal elastic lamina in autopsy specimens of elastic arteries from uremic patients. Similarly, thinning and fragmentation of medial elastic fibers was noted in epigastric arteries of dialysis patients undergoing renal transplantation.27 Neither study reported the temporal or spatial relationship of elastin degradation to the deposition of calcium. Elastin degradation may be an important early component of the vascular damage induced by CKD, and may play a role in the loss of compliance observed in the blood vessels of these patients even in the absence of calcification.
Although elastin remodeling by itself was not sufficient to cause AMC in NP-fed uremic mice, our studies suggest that degraded elastic lamellae may create sites of predilection for calcification under conditions of mineral imbalance, because calcified deposits that developed in the media were always associated with regions of elastin disorganization and degradation. These findings are consistent with studies implicating elastin degradation and elastolytic activity in nonuremic experimental models of AMC.26,35,36,37 Furthermore, elastin remodeling may play an important role in inducing and/or exacerbating SMC phenotype change. Both cathepsins and MMPs can trigger the release of soluble elastin derived peptides and TGF-β1 that promote phenotypic change of VSMCs.26,35 Recently, Hosaka et al17 showed that the elastin degradation–derived byproduct α-elastin accelerates phosphate-mediated VSMC transformation in rat VSMC culture. Because we did not observe an osteochondrogenic phenotype change in uremic mice on the NP diet, despite evidence of elastin degradation,19 we favor a two-hit model, whereby elastin remodeling and altered mineral metabolism are both important for initiation of SMC phenotype change and subsequent AMC. Additional studies are needed to test this important hypothesis.
Mechanistically, our studies suggest that at least three elastases (MMP-2, MMP-9, and cathepsin S) may be involved in uremia-induced elastin degradation. We observed baseline expression of MMP-2 and cathepsin S, indicating that these may possibly be responsible for early elastin breakdown. Chung et al27,37 reported a strong correlation between MMP-2 up-regulation and elastic fiber disorganization, stiffness, and calcification and vasomotor dysfunction in the arterial vasculature in dialysis patients,27 and up-regulation of arterial MMP-2 and MMP-9 was correlated with arterial stiffening in diabetic patients with CKD.37 Indeed, cathepsin S has been implicated in mediating elastin degradation and calcification in elegant studies of atherosclerotic arteries of uremic, ApoE−/− mice,18 and earlier Sukhova et al.38 reported reduced atherosclerosis in cathepsin S–deficient, LDL-receptor–deficient mice.
Finally, HP feeding induced VSMC loss concomitant with the appearance of AMC in uremic mice. Whether VSMC death was required for AMC or whether AMC induced VSMC death is not clear. VSMC apoptosis has been suggested to lead to calcification, due to increased local calcium concentration and loss of intracellular calcification inhibitors.15,16,39 On the other hand, calcium phosphate nanocrystals were found to be potent inducers of VSMC apoptosis.40 Our data are consistent with the possibility proposed by Shanahan's group,16 that high serum calcium and phosphate initiates an adaptive phenotype change in VSMCs that protects them against death, and that cells that fail to undergo osteochondrogenic phenotype change apoptose. A timeline of the events described above is presented in Figure 9.
Figure 9.
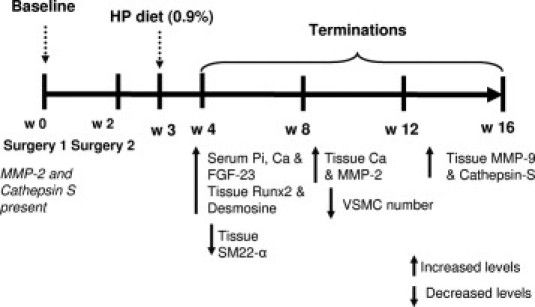
Timeline of serum and tissue biochemical changes occurring in HP-fed CKD mice from week 0 to week 16. Increased and decreased levels are relative to baseline. Ca, calcium; Pi, phosphate; HP, high phosphate.
Although the occurrence of AMC in uremia is well documented, the specific sequence of events and molecules crucial to our ultimate understanding of the process have remained elusive. Together with previous published studies, our present findings suggest the following model for the development of AMC in uremia. First, we suggest that uremia induces early damage to the vessel wall in the form of medial elastodystrophy. Elastodystrophy may by itself lead to reduced vascular compliance and increased cardiovascular mortality in CKD, but may also set the stage for elastin calcification in the context of altered mineral metabolism. Transient elevations in serum calcium and phosphate levels, such as those that occur intradialytically in patients with CKD, or as a result of calcium-containing phosphate binder use41 or vitamin D treatment,42 may directly induce VSMC transition to an osteochondrogenic phenotype, and this process may be accelerated by elastin-derived peptide fragments. This idea is similar to the accelerated atherosclerotic calcification model proposed by Aikawa et al,18 whereby elastin degradation products, in conjunction with hyperphosphatemia, accelerate elastin calcification. Thus, two hits may be important for the initiation of VSMC phenotype change toward an osteochondrogenic cell lineage. VSMCs that undergo osteochondrogenic phenotype change may directly participate in AMC by elaborating matrix vesicles, a calcification-competent matrix, and/or by down-regulating calcification inhibitors. Alternatively, VSMCs that are unable to change their phenotype die, thereby initiating calcification through increased local calcium concentrations or reduction in VSMC-derived calcification inhibitors, as proposed by Shanahan et al.15 Note that hypertension and parathyroid hormone may also play a critical role in promotion of these observed effects.
In conclusion, our studies delineate the timeline of events that precede, follow, and possibly lead to AMC in a CKD mouse model. We also report the novel finding that elastin remodeling is an early and important event in pathogenesis of AMC associated with CKD. Finally, we demonstrate the robustness of the recently developed CKD mouse model and similarity with the human disease. These studies advance our understanding of the complex events involved in the progression of AMC in CKD and suggest new therapeutic targets for ameliorating this debilitating disease.
Footnotes
Supported by NIH grants HL62329 and HL081785 (C.M.G.) and NIH training grant T32 DE07023-29.
References
- 1.Braun J., Oldendorf M., Moshage W., Heidler R., Zeitler E., Luft F.C. Electron beam computed tomography in the evaluation of cardiac calcification in chronic dialysis patients. Am J Kidney Dis. 1996;27:394–401. doi: 10.1016/s0272-6386(96)90363-7. [DOI] [PubMed] [Google Scholar]
- 2.London G.M. Cardiovascular calcifications in uremic patients: clinical impact on cardiovascular function. J Am Soc Nephrol. 2003;14:S305–S309. doi: 10.1097/01.asn.0000081664.65772.eb. [DOI] [PubMed] [Google Scholar]
- 3.London G.M. Arteriosclerosis and arterial calcifications in chronic kidney insufficiency. Nephrol Ther. 2005;1(Suppl 4):S351–S354. French. [PubMed] [Google Scholar]
- 4.Guérin A.P., Pannier B., Métivier F., Marchais S.J., London G.M. Assessment and significance of arterial stiffness in patients with chronic kidney disease. Curr Opin Nephrol Hypertens. 2008;17:635–641. doi: 10.1097/mnh.0b013e32830dcd5c. [DOI] [PubMed] [Google Scholar]
- 5.Block G.A., Hulbert-Shearon T.E., Levin N.W., Port F.K. Association of serum phosphorus and calcium x phosphate product with mortality risk in chronic hemodialysis patients: a national study. Am J Kidney Dis. 1998;31:607–617. doi: 10.1053/ajkd.1998.v31.pm9531176. [DOI] [PubMed] [Google Scholar]
- 6.Young E.W., Albert J.M., Satayathum S., Goodkin D.A., Pisoni R.L., Akiba T., Akizawa T., Kurokawa K., Bommer J., Piera L., Port F.K. Predictors and consequences of altered mineral metabolism: the Dialysis Outcomes and Practice Patterns Study. Kidney Int. 2005;67:1179–1187. doi: 10.1111/j.1523-1755.2005.00185.x. [DOI] [PubMed] [Google Scholar]
- 7.Block G.A. Prevalence and clinical consequences of elevated Ca × P product in hemodialysis patients. Clin Nephrol. 2000;54:318–324. [PubMed] [Google Scholar]
- 8.Kestenbaum B., Sampson J.N., Rudser K.D., Patterson D.J., Seliger S.L., Young B., Sherrard D.J., Andress D.L. Serum phosphate levels and mortality risk among people with chronic kidney disease. J Am Soc Nephrol. 2005;16:520–528. doi: 10.1681/ASN.2004070602. [DOI] [PubMed] [Google Scholar]
- 9.Gutierrez O.M., Januzzi J.L., Isakova T., Laliberte K., Smith K., Collerone G., Sarwar A., Hoffmann U., Coglianese E., Christenson R., Wang T.J., deFilippi C., Wolf M. Fibroblast growth factor 23 and left ventricular hypertrophy in chronic kidney disease. Circulation. 2009;119:2545–2552. doi: 10.1161/CIRCULATIONAHA.108.844506. [DOI] [PMC free article] [PubMed] [Google Scholar]
- 10.Chertow G.M., Burke S.K., Raggi P., Treat to Goal Working Group Sevelamer attenuates the progression of coronary and aortic calcification in hemodialysis patients. Kidney Int. 2002;62:245–252. doi: 10.1046/j.1523-1755.2002.00434.x. [DOI] [PubMed] [Google Scholar]
- 11.Block G.A., Raggi P., Bellasi A., Kooienga L., Spiegel D.M. Mortality effect of coronary calcification and phosphate binder choice in incident hemodialysis patients. Kidney Int. 2007;71:438–441. doi: 10.1038/sj.ki.5002059. [DOI] [PubMed] [Google Scholar]
- 12.Steitz S.A., Speer M.Y., Curinga G., Yang H.Y., Haynes P., Aebersold R., Schinke T., Karsenty G., Giachelli C.M. Smooth muscle cell phenotypic transition associated with calcification: upregulation of Cbfa1 and downregulation of smooth muscle lineage markers. Circ Res. 2001;89:1147–1154. doi: 10.1161/hh2401.101070. [DOI] [PubMed] [Google Scholar]
- 13.Chen N.X., O'Neill K.D., Duan D., Moe S.M. Phosphorus and uremic serum up-regulate osteopontin expression in vascular smooth muscle cells. Kidney Int. 2002;62:1724–1731. doi: 10.1046/j.1523-1755.2002.00625.x. [DOI] [PubMed] [Google Scholar]
- 14.Li X., Yang H.Y., Giachelli C.M. Role of the sodium-dependent phosphate cotransporter, Pit-1, in vascular smooth muscle cell calcification. Circ Res. 2006;98:905–912. doi: 10.1161/01.RES.0000216409.20863.e7. [DOI] [PubMed] [Google Scholar]
- 15.Proudfoot D., Skepper J.N., Hegyi L., Bennett M.R., Shanahan C.M., Weissberg P.L. Apoptosis regulates human vascular calcification in vitro: evidence for initiation of vascular calcification by apoptotic bodies. Circ Res. 2000;87:1055–1062. doi: 10.1161/01.res.87.11.1055. [DOI] [PubMed] [Google Scholar]
- 16.Shroff R.C., McNair R., Skepper J.N., Figg N., Schurgers L.J., Deanfield J., Rees L., Shanahan C.M. Chronic mineral dysregulation promotes vascular smooth muscle cell adaptation and extracellular matrix calcification. J Am Soc Nephrol. 2010;21:103–112. doi: 10.1681/ASN.2009060640. [DOI] [PMC free article] [PubMed] [Google Scholar]
- 17.Hosaka N., Mizobuchi M., Ogata H., Kumata C., Kondo F., Koiwa F., Kinugasa E., Akizawa T. Elastin degradation accelerates phosphate-induced mineralization of vascular smooth muscle cells. Calcif Tissue Int. 2009;85:523–529. doi: 10.1007/s00223-009-9297-8. [DOI] [PubMed] [Google Scholar]
- 18.Aikawa E., Aikawa M., Libby P., Figueiredo J.L., Rusanescu G., Iwamoto Y., Fukuda D., Kohler R.H., Shi G.P., Jaffer F.A., Weissleder R. Arterial and aortic valve calcification abolished by elastolytic cathepsin S deficiency in chronic renal disease. Circulation. 2009;119:1785–1794. doi: 10.1161/CIRCULATIONAHA.108.827972. [DOI] [PMC free article] [PubMed] [Google Scholar]
- 19.El-Abbadi M.M., Pai A.S., Leaf E.M., Yang H.Y., Bartley B.A., Quan K.K., Ingalls C.M., Liao H.W., Giachelli C.M. Phosphate feeding induces arterial medial calcification in uremic mice: role of serum phosphorus, fibroblast growth factor-23, and osteopontin. Kidney Int. 2009;75:1297–1307. doi: 10.1038/ki.2009.83. [DOI] [PMC free article] [PubMed] [Google Scholar]
- 20.Gagnon R.F., Gallimore B. Characterization of a mouse model of chronic uremia. Urol Res. 1988;16:119–126. doi: 10.1007/BF00261969. [DOI] [PubMed] [Google Scholar]
- 21.Speer M.Y., McKee M.D., Guldberg R.E., Liaw L., Yang H.Y., Tung E., Karsenty G., Giachelli C.M. Inactivation of the osteopontin gene enhances vascular calcification of matrix Gla protein-deficient mice: evidence for osteopontin as an inducible inhibitor of vascular calcification in vivo. J Exp Med. 2002;196:1047–1055. doi: 10.1084/jem.20020911. [DOI] [PMC free article] [PubMed] [Google Scholar]
- 22.Starcher B.C. Determination of the elastin content of tissues by measuring desmosine and isodesmosine. Anal Biochem. 1977;79:11–15. doi: 10.1016/0003-2697(77)90372-4. [DOI] [PubMed] [Google Scholar]
- 23.Razzaque M.S. FGF23-mediated regulation of systemic phosphate homeostasis: is Klotho an essential player. Am J Physiol Renal Physiol. 2009;296:F470–F476. doi: 10.1152/ajprenal.90538.2008. [DOI] [PMC free article] [PubMed] [Google Scholar]
- 24.Tsagalis G., Psimenou E., Manios E., Laggouranis A. Fibroblast growth factor 23 (FGF23) and the kidney. Int J Artif Organs. 2009;32:232–239. doi: 10.1177/039139880903200407. [DOI] [PubMed] [Google Scholar]
- 25.Speer M.Y., Yang H.Y., Brabb T., Leaf E., Look A., Lin W.L., Frutkin A., Dichek D., Giachelli C.M. Smooth muscle cells give rise to osteochondrogenic precursors and chondrocytes in calcifying arteries. Circ Res. 2009;104:733–741. doi: 10.1161/CIRCRESAHA.108.183053. [DOI] [PMC free article] [PubMed] [Google Scholar]
- 26.Bouvet C., Moreau S., Blanchette J., de Blois D., Moreau P. Sequential activation of matrix metalloproteinase 9 and transforming growth factor beta in arterial elastocalcinosis. Arterioscler Thromb Vasc Biol. 2008;28:856–862. doi: 10.1161/ATVBAHA.107.153056. [DOI] [PubMed] [Google Scholar]
- 27.Chung A.W., Yang H.H., Kim J.M., Sigrist M.K., Chum E., Gourlay W.A., Levin A. Upregulation of matrix metalloproteinase-2 in the arterial vasculature contributes to stiffening and vasomotor dysfunction in patients with chronic kidney disease. Circulation. 2009;120:792–801. doi: 10.1161/CIRCULATIONAHA.109.862565. [DOI] [PubMed] [Google Scholar]
- 28.Roy R., Louis G., Loughlin K.R., Wiederschain D., Kilroy S.M., Lamb C.C., Zurakowski D., Moses M.A. Tumor-specific urinary matrix metalloproteinase fingerprinting: identification of high molecular weight urinary matrix metalloproteinase species. Clin Cancer Res. 2008;14:6610–6617. doi: 10.1158/1078-0432.CCR-08-1136. [DOI] [PMC free article] [PubMed] [Google Scholar]
- 29.Karsenty G. Transcriptional control of skeletogenesis. Annu Rev Genomics Hum Genet. 2008;9:183–196. doi: 10.1146/annurev.genom.9.081307.164437. [DOI] [PubMed] [Google Scholar]
- 30.Speer M.Y., Li X., Hiremath P.G., Giachelli C.M. Runx2/Cbfa1, but not loss of myocardin, is required for smooth muscle cell lineage reprogramming toward osteochondrogenesis. J Cell Biochem. 2010;110:935–947. doi: 10.1002/jcb.22607. [DOI] [PMC free article] [PubMed] [Google Scholar]
- 31.Blacher J., Safar M.E., Guerin A.P., Pannier B., Marchais S.J., London G.M. Aortic pulse wave velocity index and mortality in end-stage renal disease. Kidney Int. 2003;63:1852–1860. doi: 10.1046/j.1523-1755.2003.00932.x. [DOI] [PubMed] [Google Scholar]
- 32.Vanholder R., Massy Z., Argiles A., Spasovski G., Verbeke F., Lameire N; European Uremic Toxin Work Group. Chronic kidney disease as cause of cardiovascular morbidity and mortality. Nephrol Dial Transplant. 2005;20:1048–1056. doi: 10.1093/ndt/gfh813. [DOI] [PubMed] [Google Scholar]
- 33.Amann K., Wolf B., Nichols C., Tornig J., Schwarz U., Zeier M., Mall G., Ritz E. Aortic changes in experimental renal failure: hyperplasia or hypertrophy of smooth muscle cells. Hypertension. 1997;29:770–775. doi: 10.1161/01.hyp.29.3.770. [DOI] [PubMed] [Google Scholar]
- 34.Ibels L.S., Alfrey A.C., Huffer W.E., Craswell P.W., Anderson J.T., Weil R.3rd. Arterial calcification and pathology in uremic patients undergoing dialysis. Am J Med. 1979;66:790–796. doi: 10.1016/0002-9343(79)91118-5. [DOI] [PubMed] [Google Scholar]
- 35.Qin X., Corriere M.A., Matrisian L.M., Guzman R.J. Matrix metalloproteinase inhibition attenuates aortic calcification. Arterioscler Thromb Vasc Biol. 2006;26:1510–1516. doi: 10.1161/01.ATV.0000225807.76419.a7. [DOI] [PubMed] [Google Scholar]
- 36.Basalyga D.M., Simionescu D.T., Xiong W., Baxter B.T., Starcher B.C., Vyavahare N.R. Elastin degradation and calcification in an abdominal aorta injury model: role of matrix metalloproteinases. Circulation. 2004;110:3480–3487. doi: 10.1161/01.CIR.0000148367.08413.E9. [DOI] [PMC free article] [PubMed] [Google Scholar]
- 37.Chung A.W., Yang H.H., Sigrist M.K., Brin G., Chum E., Gourlay W.A., Levin A. Matrix metalloproteinase-2 and -9 exacerbate arterial stiffening and angiogenesis in diabetes and chronic kidney disease. Cardiovasc Res. 2009;84:494–504. doi: 10.1093/cvr/cvp242. [DOI] [PubMed] [Google Scholar]
- 38.Sukhova G.K., Zhang Y., Pan J.H., Wada Y., Yamamoto T., Naito M., Kodama T., Tsimikas S., Witztum J.L., Lu M.L., Sakara Y., Chin M.T., Libby P., Shi G.P. Deficiency of cathepsin S reduces atherosclerosis in LDL receptor-deficient mice. J Clin Invest. 2003;111:897–906. doi: 10.1172/JCI14915. [DOI] [PMC free article] [PubMed] [Google Scholar]
- 39.Shroff R.C., McNair R., Figg N., Skepper J.N., Schurgers L., Gupta A., Hiorns M., Donald A.E., Deanfield J., Rees L., Shanahan C.M. Dialysis accelerates medial vascular calcification in part by triggering smooth muscle cell apoptosis. Circulation. 2008;118:1748–1757. doi: 10.1161/CIRCULATIONAHA.108.783738. [DOI] [PubMed] [Google Scholar]
- 40.Ewence A.E., Bootman M., Roderick H.L., Skepper J.N., McCarthy G., Epple M., Neumann M., Shanahan C.M., Proudfoot D. Calcium phosphate crystals induce cell death in human vascular smooth muscle cells: a potential mechanism in atherosclerotic plaque destabilization. Circ Res. 2008;103:e28–e34. doi: 10.1161/CIRCRESAHA.108.181305. [DOI] [PubMed] [Google Scholar]
- 41.Slatopolsky E., Weerts C., Lopez-Hilker S., Norwood K., Zink M., Windus D., Delmez J. Calcium carbonate as a phosphate binder in patients with chronic renal failure undergoing dialysis. N Engl J Med. 1986;315:157–161. doi: 10.1056/NEJM198607173150304. [DOI] [PubMed] [Google Scholar]
- 42.Berl T., Berns A.S., Hufer W.E., Hammill K., Alfrey A.C., Arnaud C.D., Schrier R.W. 1,25 dihydroxycholecalciferol effects in chronic dialysis: A double-blind controlled study. Ann Intern Med. 1978;88:774–780. doi: 10.7326/0003-4819-88-6-774. [DOI] [PubMed] [Google Scholar]