

Abstract
The mammalian target of rapamycin (mTOR) inhibitors, such as rapalogues, are a promising new tool for the treatment of metastatic gastroenteropancreatic endocrine tumors. However, their mechanisms of action remain to be established. We used two murine intestinal endocrine tumoral cell lines, STC-1 and GLUTag, to evaluate the antitumor effects of rapamycin in vitro and in vivo in a preclinical model of liver endocrine metastases. In vitro, rapamycin inhibited the proliferation of cells in the basal state and after stimulation by insulin-like growth factor-1. Simultaneously, p70S6 kinase and 4EBP1 phosphorylation was inhibited. In vivo, rapamycin substantially inhibited the intrahepatic growth of STC-1 cells, irrespectively of the timing of its administration and even when the treatment was administered after cell intrahepatic engraftment. In addition, treated animals had significantly prolonged survival (mean survival time: 47.7 days in treated animals versus 31.8 days in controls) and better clinical status. Rapamycin treatment was associated with a significant decrease in mitotic index and in intratumoral vascular density within STC-1 tumors. Furthermore, the antitumoral effect obtained after treatment with a combination of rapamycin and phosphatidylinositol 3-kinase (PI3K) inhibitor LY294002 was more significant than with rapamycin alone in both cell lines. Our results suggest that the antitumor efficacy of rapamycin in neuroendocrine tumors results from a combination of antiproliferative and antiangiogenic effects. Interestingly, a more potent antitumor efficiency could be obtained by simultaneously targeting several levels of the PI3K/mTOR pathway.
Gastroenteropancreatic (GEP) neuroendocrine tumors are uncommon and heterogeneous neoplasms of epithelial origin, in which neoplastic cells characteristically retain the capacity to synthesize and/or secrete various peptidic hormones and neuropeptides, which may result in a characteristic hypersecretion syndrome. The treatment of metastatic GEP endocrine tumors remains poorly effective. Innovative therapeutic strategies are needed that take into account some of the most characteristic biologic features of GEP neuroendocrine tumors, such as the overexpression of oncogenic receptors and the activation of their signaling pathways, which can be targeted by new selective therapeutic agents.1
At this time, the phosphatidylinositol 3-kinase (PI3K)/Akt/mammalian target of rapamycin (mTOR) signaling pathway is considered to be a promising target for cancer therapy because it is activated in many tumor types. On activation, mTOR kinase associated with raptor (mTORC1) induces the phosphorylation of two proteins involved in the control of cell growth and survival: ribosomal p70S6 kinase (p70S6K) and eukaryotic initiation factor-4E binding protein 1 (4EBP1). Rapamycin and its analogues inhibit mTOR signaling.2 The antitumor efficacy of these molecules is currently evaluated in many tumor types, including GEP neuroendocrine tumors. A recent multicentric phase II study revealed the antitumor activity of the rapamycin analog RAD001 (everolimus), alone or combined with octreotide, in patients with advanced pancreatic neuroendocrine tumors after failure of cytotoxic chemotherapy.3 However, so far, only the rapamycin analog temsirolimus (CCI-779) has received approval for therapeutic use in humans, with indications restricted to renal cell carcinoma.4
Targeting the mTOR signaling pathway in GEP neuroendocrine tumors is a new and promising approach. Preclinical studies, which are essential for the understanding of the mechanisms of action of such therapies, remain rare because of the paucity of experimental in vitro and in vivo models. Only four recent works reported on the effects of rapamycin or its analog RAD001 on endocrine cell lines on the basis of in vitro experiments.5–8
To gain further insight into the mechanisms of antitumor activity of rapalogues in GEP neuroendocrine tumors, we designed an experimental study based on two murine endocrine cell lines, STC-1 and GLUTag, which mimic the behavior of human high-grade endocrine carcinoma. After establishing the in vitro effects of rapamycin, we attempted to evaluate in vivo, using a preclinical animal model of intrahepatic dissemination developed in the laboratory,9 the relative contributions of the antiproliferative, proapoptotic, and antiangiogenic effects that may be exerted by rapamycin alone or in combination with the PI3K inhibitor LY294002, which targets the same pathway.
We report that in vitro rapamycin affects the PI3K/Akt/mTOR signaling pathway in STC-1 and GLUTag cells by inhibiting p70S6K and 4EBP1 phosphorylation, leading to the inhibition of cell proliferation. In vivo, rapamycin markedly slowed intrahepatic tumor growth, even when administered after the formation of tumor nodules, and significantly enhanced survival. Finally, combined treatment with rapamycin and LY294002 was more efficient than treatment with rapamycin alone in both cell lines.
Materials and Methods
Cell Culture
The STC-1 cell line, a gift of G. Rindi (Department of Pathology and Laboratory Medicine, Rome, Italy), and the GLUTag cell line, a gift of D. Drucker (Department of Medicine, Mt. Sinai Hospital, Toronto, Ontario, Canada), are derived from endocrine intestinal tumors developed in transgenic mice.10,11
Cells were routinely cultured in Dulbecco's modified Eagle's medium (DMEM) supplemented with 5% or 10% fetal calf serum (FCS) (for STC-1 and GLUTag cells, respectively), 2 mmol/L glutamine, and antibiotics (100 UI/ml of penicillin, 100 μg/ml of streptomycin).
Reagents
Insulin-like growth factor-1 (IGF-1) was purchased from Richter-Helm BioLogics (Hamburg, Germany). Inhibitors were obtained from Stressgen (Victoria, British Columbia, Canada) (PD98059) and LC Labs (Woburn, MA) (LY294002, rapamycin). Antibodies against phospho-Akt (Ser473), Akt, phospho-p70S6K (Thr389), p70S6K, phospho-4EBP1 (Ser65), and 4EBP1 were purchased from Cell Signaling Technology (Beverly, MA). The antibody against CD31 (clone MEC7.46) was from Cell Science (Ventura, CA), vascular endothelial growth factor (VEGF) antibody was from Zymed Laboratories (San Francisco, CA), and antimouse Ki-67 antibody (clone TEC3) was from Dako (Glostrup, Denmark).
Cell Proliferation Assay
Cells were seeded at a density of 6000 cells per well in 96-well plates and maintained 72 hours in normal culture conditions. The medium was then replaced by 0.05% FCS-containing DMEM medium. Growth factors and drugs (IGF-I, LY294002, rapamycin, PD98059) alone or in combination were then added for 24 or 48 hours. A 20 μL sample of 3-(4,5-dimethylthiazol-2-yl)−2,5-diphenyltetrazolium bromide (MTT) solution (5 mg/ml) was added to each well, and the plates were incubated at 37°C for 2.5 hours. The supernatant was discarded, and 100 μL of DMSO was added to dissolve formazan crystals, generating a blue-purple color. The absorbance was measured at 540 nm.
Cell Cycle Analysis
Cells in growth phase were synchronized by exposing the culture to 0.05% FCS-containing DMEM for 24 hours. Growth factors and drugs (IGF-1, LY294002, rapamycin, and PD98059) alone or in combination were then added for 24 hours. Nuclei were isolated and stained with propidium iodide using the BD Cycle TESTPLUS Reagent Kit (BD Biosciences, Le Pont de Claix, France) according to the manufacturer's instructions. Flow cytometry was then performed using a Dako Galaxy apparatus.
Protein Extraction and Western Blot Analysis
Cells were washed with cold PBS and lysed in cold solubilization buffer (pH 8) containing 150 mmol/L NaCl, 50 mmol/L Tris-base, 2 mmol/L EDTA, 0.5% deoxycholate, 0.1% SDS, 1% NP40, 2 mmol/L Orthovanadate, and 20 mmol/L NaF. Cell lysates were resolved on 7.5% to 10% SDS polyacrylamide gel and blotted to polyvinylidene difluoride membranes (Millipore) as previously described.12 Saturation was achieved in 0.1% Tween in Tris-buffered saline with 5% milk for 1 hour. The membranes were probed with primary antibodies overnight at 4°C, washed, and incubated with appropriate immunoperoxidase-conjugated secondary antibodies (Jackson ImmunoResearch Laboratories; Beckman Coulter France, Roissy, France) for 1 hour at room temperature. Antibody binding was detected using electrochemiluminescence (ECL Western Blotting Detection System; Covalab, Villeurbanne, France).
Animal Studies
Four-week-old female Swiss nu/nu mice were obtained from Charles River Laboratories (L'Arbresle, France). The animals were maintained in a sterile environment and treated in accordance with ethical recommendations and guidelines of the Animal Welfare Committee of University Lyon 1. Animals were anesthetized before all surgical procedures. After surgery, animals were allowed to recover in a sterile atmosphere and were fed ad libitum with a sterile diet.
For STC-1 cells, the xenografting procedure was as previously described.9 The same procedure was used for GLUTag cells. Briefly, 50 μL of a solution containing tumor cells adjusted to a final concentration of 5 × 10⁷ cells/ml were injected into the spleen, from where they disseminated into the liver through the portal vein to form intrahepatic tumor nodules. Rapamycin and LY294002 were administered intraperitoneally at the dose of 1.5 mg/kg daily and 25 mg/kg three times a week, respectively, in accordance with previous studies.13–17
Three protocols of administration were tested in STC-1 tumor–bearing mice. In the first protocol, 8 days after intrasplenic STC-1 injection to allow liver engraftment and early growth of tumor cells, mice were randomized into two groups. Some mice were sacrificed at day 8 to constitute the control day 8 group. In remaining animals, treatment was started at day 8 with rapamycin or vehicle only; animals were sacrificed at day 25. In the second protocol, in view of the results of the above protocol, a survival study was performed: 14 animals received intrasplenic injection of STC-1 cells. For eight of them, rapamycin treatment was started 8 days after cell injection, whereas the control group (six animals) received vehicle injection. The animals were weighted daily and euthanized when the body weight loss reached 20% of the initial weight, in accordance with ethical recommendations. In the third protocol, to assess the efficacy of a treatment combining rapamycin and LY294002, mice were randomized into treatment and nontreatment groups 3 days after intrasplenic injection of STC-1 cells. Treatment groups received rapamycin alone or in combination with LY294002, whereas the nontreatment group received vehicle only. The mice were treated until day 22. At this date, the animals were sacrificed; the spleen and liver were excised, weighed, and prepared for histologic analysis. With GLUTag cells, only the third protocol of administration of rapamycin and LY294002 was used.
Histologic Analysis and Morphometry
In all animals, tissue samples were fixed in 10% buffered formalin and embedded in paraffin. In addition, some tissue samples were immediately snap frozen in liquid nitrogen. For histologic examination, 4-μm-thick tissue sections were prepared according to conventional procedures. Sections were then stained with hematoxylin and eosin and examined with a light microscope. For the determination of the mitotic index, the number of mitoses was counted in at least 5 high-power fields in the reference tissue section. For the determination of the apoptotic index, the number of apoptotic cells was evaluated in at least 5 high-power fields in the reference tissue section.18
The amount of intrahepatic tumor tissue was evaluated by morphometry (Histolab; Microvision Instruments, Evry, France). The surface of each individual lesion was measured; the total surface occupied by tumor tissue was defined as the sum of the surfaces of each individual lesion and was expressed as a percentage of the total surface of the corresponding reference tissue section.
Immunohistochemical Analysis
The following markers were tested by immunohistochemistry: VEGF, Ki-67, and CD31.
VEGF and Ki-67 antibodies were applied to deparaffinized sections of formalin-fixed tissue samples and revealed according to an indirect immunoperoxidase technique, using diaminobenzidine as a chromogen. CD31 was applied to acetone-fixed cryostat sections of frozen tissue samples and revealed according to the same technique.
The proliferation index of tumor cells was determined by counting the number of nuclei positive for Ki-67 antigen in 1000 cells; the result was expressed as the percentage of labeled cells.
The intratumoral microvascular density was determined in each individual lesion after immunostaining with anti-CD31 antibody as previously described.9 VEGF expression was determined after immunostaining with anti-VEGF antibody. The area of VEGF-positive structures in each individual lesion was expressed as a ratio of the total tumor tissue surface in the corresponding tissue section (Histolab; Microvision Instruments).
Statistical Analysis
Results are presented as mean ± SEM. Significant differences were analyzed by using Mann-Whitney and Student's t-tests. P < 0.05 was required for statistical significance.
Results
In Vitro Antiproliferative Effects of Rapamycin and PI3K Inhibitor LY294002
In Vitro, Rapamycin Inhibits Basal Cell Proliferation in a Dose-Dependent Manner
Cells growing in basal culture condition were treated with increasing doses of rapamycin from 5 to 50 nmol/L for 48 hours, and the number of viable cells at the end of the treatment period was estimated through an MTT test. As shown in Figure 1A, rapamycin treatment resulted in a dose-dependent decrease of the number of viable STC-1 and GLUTag cells (approximately 40% and 50% respectively, using 50 nmol/L rapamycin), confirming that mTOR protein is a target to inhibit proliferation of these cells (P < 0.05).
Figure 1.
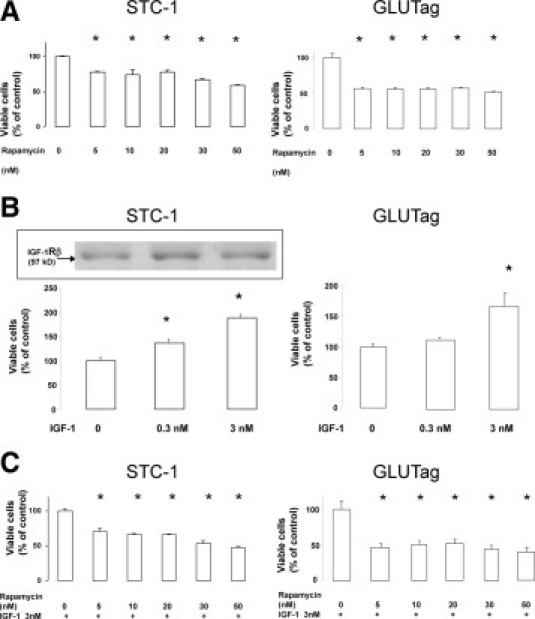
Effect of rapamycin on cell proliferation, estimated by measuring the number of viable cells (MTT test). A: STC-1 and GLUTag cells were incubated with increasing doses of rapamycin for 48 hours. B: Cells were incubated with exogenous IGF-1 for 48 hours, and the expression of IGF-1 receptor was checked by Western blot in STC-1 cells (insert). C: STC-1 and GLUTag cells were incubated with increasing doses of rapamycin for 48 hours in the presence of 3 nmol/L IGF-1 (*P < 0.05 vs control).
Rapamycin Inhibits Cell Proliferation Induced in Vitro by IGF-1
We were prompted to evaluate the capacity of rapamycin to inhibit proliferation on exogenous stimulation. For this purpose, IGF-1 was chosen to stimulate the mTOR pathway. Incubation of STC-1 cells with IGF-1 at 0.3 or 3 nmol/L induced a significant increase in viable cell numbers of 128% and 178% of control, respectively (Figure 1B) (P < 0.05). We verified that IGF-1 receptor levels displayed no significant variation in the presence of high concentrations of IGF-1 (Figure 1B). For GLUTag cells, incubation with 3 nmol/L IGF-1 only resulted in a significant increase of viable cells (168% of control) (Figure 1B) (P < 0.05). Treatment with increasing doses of rapamycin from 5 to 50 nmol/L for 48 hours in the presence of 3 nmol/L IGF-1 led to a dose-dependent decrease of the number of viable STC-1 cells (approximately 50% using 50 nmol/L rapamycin) (Figure 1C) (P < 0.05); we verified the absence of significant changes in IGF-1 receptor expression levels (data not shown). In the same way, incubation with rapamycin resulted in a significant decrease in the number of viable GLUTag cells (approximately 60% using 50 nmol/L rapamycin) (Figure 1C) (P < 0.05).
The Effect of Rapamycin on IGF-1–Dependent Proliferation Depends on the Inhibition of thePI3K/mTOR Pathway in the STC-1 Cell Line
We then determined the intracellular signaling pathway activated by IGF-1 stimulation in STC-1 cells. Cells were treated with 3 nmol/L IGF-1 in the presence of inhibitors targeting either mitogen-activated protein kinase or PI3K. Treatment with the mitogen-activated protein kinase inhibitor PD98059 (15 μmol/L) did not modify the proliferative response to IGF-1. In contrast, the PI3K inhibitor LY294002 (5 μmol/L) significantly reduced viable cell number in the presence of IGF-1 by approximately 40%, as did the mTOR inhibitor rapamycin (11 nmol/L) (P < 0.05) (Figure 2A). Concurrent results were obtained by cell cycle analysis (Figure 2B). As expected on IGF-1 stimulation, the proportion of cells in S phase increased to 44% versus 37% in controls, and the proportion of cells in G0/G1 phase significantly decreased to 48% versus 59% in untreated cells (P < 0.05). The addition of PD98059 (15 μmol/L) together with IGF-1 did not modify the effect of IGF-1 alone. The modifications induced by IGF-1 were significantly suppressed in the presence of LY294002 (5 μmol/L) or rapamycin (11 nmol/L) (P < 0.05). These results demonstrated that the blockade of the PI3K/mTOR pathway is an efficient way to inhibit the proliferative response of STC-1 cells to exogenous IGF-1.
Figure 2.
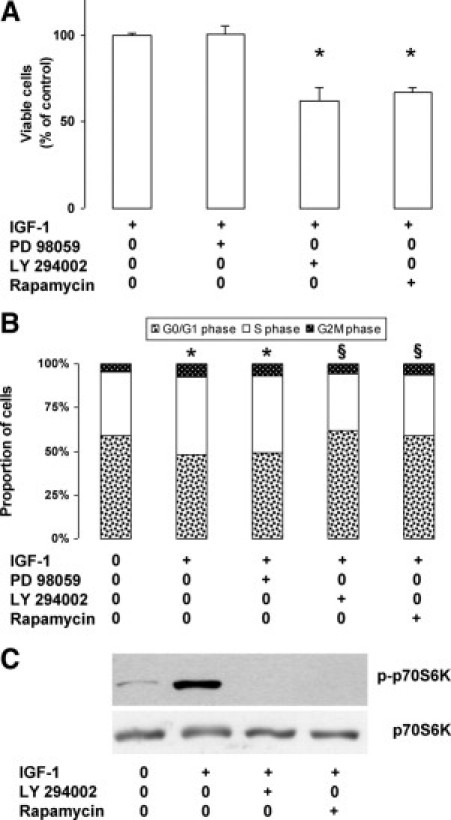
Activation of the PI3K/mTOR pathway by IGF-1 in STC-1 cells. A: Cells were incubated for 24 hours with 3 nmol/L IGF-1 in the presence of specific inhibitors: PD98059, 15 μmol/L; LY294002, 5 μmol/L; or rapamycin, 11 nmol/L; proliferation rate was estimated by measuring the number of viable cells (MTT test) (*P < 0.05 versus control with IGF-1 alone). B: Cells were incubated for 24 hours without or with 3 nmol/L IGF-1 in the presence of inhibitors. The proportion of cells in the different phases of the cell cycle was measured by flow cytometry after staining of the nuclei with propidium iodide (*P < 0.05 versus control without IGF-1; §P < 0.05 verus IGF-1 alone). C: Total protein extracts prepared from cells incubated for 24 hours without or with 3 nmol/L IGF-1 in the presence of 5 μmol/L LY294002 or 11 nmol/L rapamycin were submitted to Western blot analysis using specific antibodies.
To gain further insight into these observations, we assessed the effect of LY294002 and rapamycin on the phosphorylation of p70S6 kinase, one of the two major effectors of mTOR, 24 hours after the addition of the inhibitors. As shown in Figure 2C, IGF-1 induced a strong increase in the phosphorylated form of p70S6K, which completely disappeared in the presence of LY294002 (5 μmol/L) or rapamycin (11 nmol/L).
Rapamycin Acts Synergistically With Upstream Inhibitors of Akt to Block the Phosphorylation of mTOR Effectors
The phosphorylation level of p70S6K, 4EBP1, and Akt was examined after increasing time of treatment with 11 nmol/L rapamycin from 1 to 8 hours in basal culture conditions. In both cell lines, phosphorylation of p70S6K and 4EBP1 was inhibited as soon as 1 hour after the addition of rapamycin. In the same time, in STC-1 cells but not in GLUTag cells, a transient increase of phosphorylated Akt level was observed, followed by a return to the basal level between 6 and 8 hours (Figure 3A).
Figure 3.
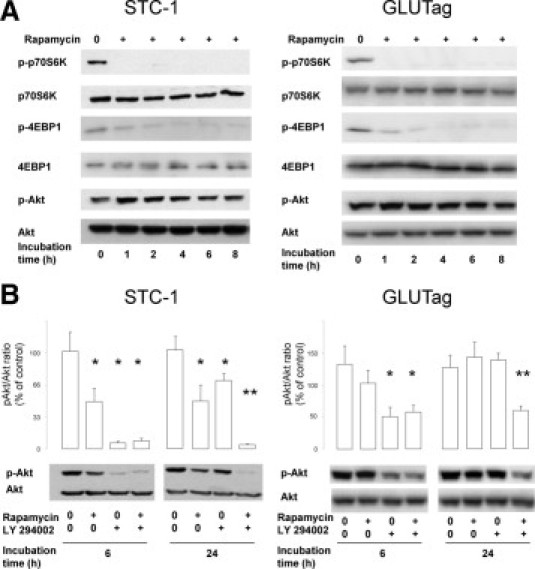
Effect of rapamycin and LY294002 on the phosphorylation of key proteins of the PI3K/mTOR pathway. A: STC-1 and GLUTag cells were incubated with 11 nmol/L rapamycin for 0 to 8 hours. Protein expression level of phosphorylated and total p70S6K, 4EBP1, and Akt was examined using Western blot analysis. B: The effects or rapamycin alone (11 nmol/L), LY294002 alone (5 μmol/L), or the combination of both were assessed at 6 and 24 hours on the phosphorylation of Akt using Western blot analysis and illustrated by densitometric analysis (*P < 0.05 versus control without rapamycin and LY294002; **P < 0.05 versus rapamycin alone and LY294002 alone). Representative of at least three independent experiments.
We then studied the effects of rapamycin on the phosphorylation of Akt after 6 and 24 hours of incubation. The amounts of phospho-Akt detected by Western blotting were significantly reduced in the presence of rapamycin in STC-1 cells but not in GLUTag cells (Figure 3B). We therefore hypothesized that the transient increase in phospho-Akt may limit the efficacy of rapamycin to block mTOR and its downstream effectors. We thus assessed the combination of 5 μmol/L LY294002, acting upstream of Akt, with 11 nmol/L rapamycin. As shown in Figure 3B, in both STC-1 and GLUTag cells, the phosphorylation of Akt was markedly inhibited by the combination of rapamycin and LY294002 at 6 and 24 hours compared with the control. At 6 hours, in both cell lines, the inhibition was markedly higher with the combination than with rapamycin alone. At 24 hours, in both cell lines, the inhibitory effect of the combination was much higher than those of rapamycin and LY294002 alone. These results strongly suggest that the combination of rapamycin with inhibitors acting upstream of mTOR may improve the efficiency of the molecule in a synergistic way.
Inhibition of the PI3K/mTOR Pathway Blocks Cell Growth in Vivo
In Vivo, Rapamycin Inhibits Intrahepatic Cell Growth of STC-1 Cells
Because rapamycin (or its analogues) is currently being evaluated as an antitumor drug in many cancer types, we next evaluated the effect of this drug in an experimental model of intrahepatic dissemination after intrasplenic injection of tumoral cells. As previously described, the intrahepatic growth of STC-1 cells could be divided into three stages: engraftment until day 7; early, slow growth until day 17; and late, rapid growth after day 17.9
According to these kinetics, we first evaluated the effects of rapamycin administration from day 8 onward (ie, in animals with established and rapidly growing intrahepatic nodules). At the date of sacrifice (day 25), tumor development was strongly reduced by rapamycin treatment: the size of primary tumors developed in the spleen was smaller; the spleen weight decreased from 0.22 ± 0.04 g (n = 5) in untreated animals to 0.14 ± 0.1 g (n = 5) in treated animals. As exemplified in Figure 4A (inserts), the number of macroscopically visible liver metastases was much lower in rapamycin-treated animals. Histologic analyses demonstrated that the liver of treated animals contained only small tumor nodules, whereas the liver of control animals exhibited the combination of large and small nodules usually observed at this stage (Figure 4A).9 As shown in Figure 4B, the total tumor tissue surface evaluated to 9.55% ± 2.86% in control animals significantly decreased (P < 0.05) to 2.18% ± 1.16% in rapamycin-treated animals (77% inhibition). In the survival study (Figure 4C), weight loss was considerably delayed in treated animals compared with controls and survival was much longer. Mean survival time increased from 31.8 ± 0.2 days in control animals to 47.7 ± 1.8 days in treated animals: the difference between the two groups was statistically significant (log-rank test: P < 0.002).
Figure 4.
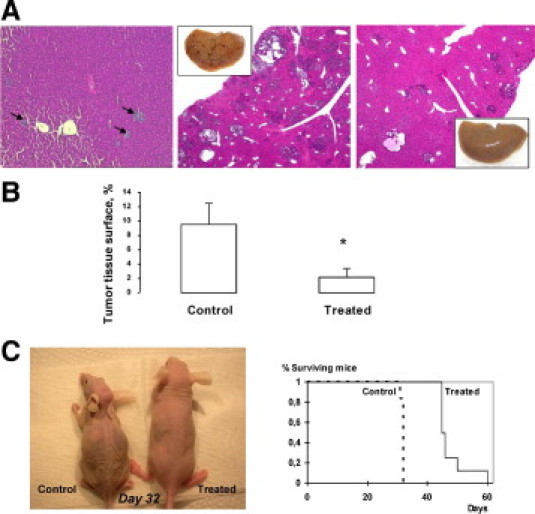
In vivo effects of rapamycin on intrahepatic cell growth. Rapamycin (1.5 mg/kg daily) was administrated from day 8, to allow engraftment of tumor cells in the liver, to day 25. A, left: histologic examination of day 8 control mice: small early nodules are visible in the liver (arrows); middle and right: histologic examination of control and treated mice sacrificed at day 25: many nodules of variable size are present in the liver of control mice (middle), whereas only few small nodules are visible in rapamycin-treated mice (right) (H&E staining, original magnification, ×4); inserts: macroscopic view showing a strong decrease of the number of visible liver nodules. B: Morphometric analysis: the total tumor tissue surface is strongly reduced on rapamycin treatment (*P < 0.05). C: Survival study: Mice received either vehicle or rapamycin injection (1.5 mg/kg daily) from day 8 after STC-1 intrasplenic injection. Left: morphologic aspect of a control and a rapamycin-treated mouse 32 days after STC-1 intrasplenic injection. Right: Kaplan-Meier curve showing a significant difference of survival between control and rapamycin-treated mice (P < 0.002).
The in Vivo Effects of Rapamycin Result From a Combination of Antiproliferative and Antiangiogenic Mechanisms
We then attempted to investigate the mechanisms involved in the antitumor effect of rapamycin. We assessed the effects of rapamycin on cell proliferation and apoptosis. As shown in Figure 5A, the mitotic index in STC-1 nodules was significantly lower in rapamycin-treated animals than in controls (P < 0.05). In the same way, the Ki-67 index was significantly decreased in rapamycin-treated animals (P < 0.05). In contrast, the number of STC-1 apoptotic cells was not significantly different in rapamycin-treated animals and in controls, as shown by both the apoptotic index and the identification of cleaved caspase 3–positive cells by immunohistochemical analysis (not shown). Finally, we evaluated the effects of rapamycin on tumor angiogenesis. As shown in Figure 5B, VEGF expression was decreased in tumor nodules of rapamycin-treated animals. Furthermore, the intratumoral microvascular density evaluated by CD31 staining was significantly lower in rapamycin-treated animals than in controls (Figure 5C) (P < 0.05).
Figure 5.
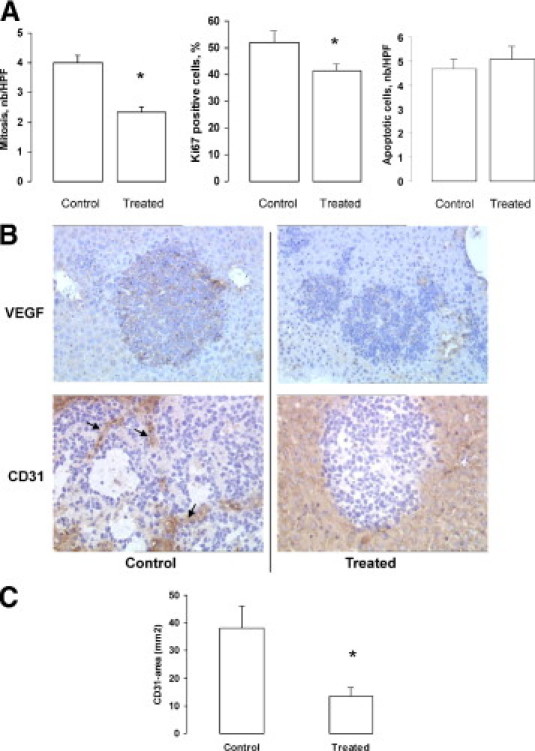
In vivo effects of rapamycin: combination of antiproliferative and antiangiogenic mechanisms. A: Morphometric analyses of intrahepatic lesions: the mitotic index and the proliferative index (Ki-67 immunoreactive cells) were significantly decreased on rapamycin treatment (*P < 0.05), whereas the apoptotic index was not modified. B: Representative immunostainings for VEGF and CD31 (arrows) in tumor nodules (original magnification, ×10). C: Morphometric analysis showing the decrease of intratumoral microvascular density on rapamycin treatment (*P < 0.05).
In Vivo, the Combination Between Rapamycin and LY294002 Is More Effective Than Rapamycin Alone in Both STC-1 and GLUTag Tumor–Bearing Animals
In view of the in vitro results demonstrating a synergistic effect of rapamycin and LY294002 on the phosphorylation of the PI3K/mTOR effectors pathway, we evaluated the effect of this drug combination on tumor development in vivo after injection of STC-1 or GLUTag cells. Treatments were started from day 3, during the cell engraftment period, to compare the effect of early or delayed rapamycin treatment. For each cell line, three groups of five animals each received vehicle only, rapamycin, or rapamycin and LY294002; one animal in the group injected with GLUTag and receiving rapamycin and LY294002 died of postoperative complications. Figure 6A shows the distribution of tumor tissue surface values for the different groups of animals. Like in the first series of experiments, rapamycin strongly decreased the development of STC-1 intrahepatic nodules, with a 76% mean decrease in tumor tissue surface. Four of the five mice treated with the combination rapamycin and LY294002 exhibited a tumor tissue surface lower than the mean surface observed with rapamycin alone. In the same way, the combination of rapamycin and LY294002 induced a marked and significant decrease of tumor tissue surface in the livers of animals injected with GLUTag cells compared with controls.
Figure 6.
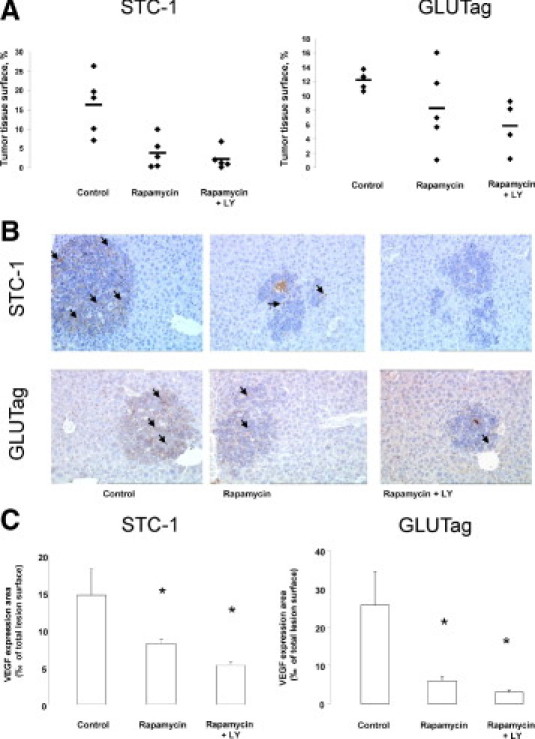
In vivo effects of the combination between rapamycin and LY294002. Rapamycin (1.5 mg/kg daily) and LY294002 (25 mg/kg three times a week) were administrated from day 3 to day 22. A: Morphometric analysis showing the distribution of tumor tissue surface values for the three groups of mice for both cell lines. In STC-1 tumor–bearing mice, rapamycin alone strongly decreased tumor tissue surface. Four of the five mice treated with the combination rapamycin and LY294002 exhibited a tumor tissue surface lower than the mean surface observed with rapamycin alone. In GLUTag tumor–bearing mice, three of the five mice treated with rapamycin alone exhibited a reduced tumor tissue surface, whereas the combination rapamycin and LY294002 induced a significant decrease of tumor tissue surface. B: Representative immunostaining for VEGF (arrows) in tumor nodules of each group of mice (original magnification, ×10). C: The expression of VEGF was lower when the combination rapamycin and LY294002 were used to treat the mice (*P < 0.05).
Furthermore, VEGF expression was more decreased in tumor nodules of mice injected with STC-1 or GLUTag cells and treated with the combination rapamycin and LY294002 than in tumor nodules of mice treated with rapamycin alone (Figure 6, B and C).
Discussion
In neuroendocrine tumors, promising results of phase 2 trials evaluating the efficacy of a rapamycin derivative, RAD001, in combination with the somatostatin analog octreotide, have been recently reported.3 It is therefore important to gain insight into the mechanisms responsible for the potential antitumor effect of rapamycin and its analogues. So far, only a few preclinical reports, mainly based on in vitro experiments, have appeared.5–8 In this context, the objective of our study was to evaluate, in vitro and in vivo, the effects of rapamycin on intestinal endocrine tumor cell lines, representative of the human high-grade endocrine carcinomas that are putative targets for treatment by rapamycin analogues.19 Our results suggest that rapamycin may act through several coordinated mechanisms.
Our in vitro results showed that even if STC-1 and GLUTag cells have a high proliferative rate in the basal state, inhibition of mTOR with rapamycin proved to be effective in blocking cell proliferation. Because many human neuroendocrine tumors demonstrate high expression of IGF-1, IGF-2 and IGF-1 receptor,20,21 we selected IGF-1, which is known to activate the PI3K/Akt/mTOR signaling pathway, to evaluate the effects of rapamycin on growth factor–stimulated cell proliferation. Rapamycin significantly decreased IGF-1–induced proliferation of both STC-1 and GLUTag cells. The proliferative response to IGF-1 involved PI3K signaling because specific inhibitors of PI3K and mTOR, LY294002 and rapamycin, respectively, significantly reduced the IGF-1–induced proliferation and totally abrogated the phosphorylation of p70S6K. IGF-1 receptor signaling pathway could thus be regarded as a potential target to inhibit proliferation in murine enteroendocrine cell lines. In the same way, a recent study demonstrated the capacity of the tyrosine kinase inhibitor NVP-AEW541 to inhibit IGF1-receptor–dependent proliferation of the human neuroendocrine tumor cell lines BON and CM.22
Beside the antiproliferative effect of rapamycin, some recent reports demonstrated that mTOR inhibition may result in an up-regulation of Akt through the suppression of mTOR/p70S6K-dependent feedback inhibition of the pathway, resulting in Akt activation.23,24 In STC-1 cells but not in GLUTag cells, we observed a transient activation of Akt after rapamycin treatment; another difference observed between the two cell lines lies in the inhibitory effect exerted by rapamycin on the phosphorylation of Akt in STC-1 but not GLUTag cells: this may suggest that, in STC-1 cells, rapamycin is able to interfere not only with mTORC1 but also with mTORC2, which has been shown to have long-term effects on the phosphorylation levels of Akt.25 These differences between the two cell lines confirm that the regulation of the PI3K/Akt/mTOR pathway is cell dependent and suggest that it may also be tumor dependent in human patients. Because the activation of Akt may limit rapamycin efficacy, we decided to interfere upstream and downstream of Akt by combining LY294002 with rapamycin. This combination completely suppressed rapamycin-induced Akt phosphorylation in the two cell lines used. Targeting the PI3K/mTOR pathway upstream of Akt thus appeared to be a promising strategy to improve the effects of mTOR inhibitors: this lends further support to the use of PI3K inhibitors that are currently in clinical trials.26
Preclinical studies with rapamycin or its analogues have usually been performed only in vitro, except for the work by Moreno et al.6 These authors used a subcutaneous xenograft model to demonstrate a significant decrease in tumor size in mice treated with rapamycin for 30 days. However, the subcutaneous model has little physiopathologic relevance. In our study, we used a xenograft model that mimics the major adverse event in the natural history of neuroendocrine tumors, the intrahepatic dissemination and growth of tumor cells, resulting into the formation of liver metastases. Indeed, as recently shown by our group, the intrasplenic injection of STC-1 cells into the spleen of athymic nude mice makes it possible to obtain their secondary dissemination into the liver through the portal vein and the development of multiple liver tumors, which closely mimics the clinical situation.9 The kinetics of intrahepatic growth of STC-1 cells in this model is divided into three main stages: (1) engraftment; (2) early growth characterized by the presence of small, infralobular, well-delimited tumor nodules; and (3) late growth resulting into the development of large nodules, which progressively merge with the adjacent ones to give rise to very large masses, especially into the subcapsular area.9 This model can be used with other cell lines, as shown here for GLUTag cells. We used this experimental approach to assess the effects or rapamycin on the growth of liver metastases.
To be as close as possible of the clinical challenge, which is the control of metastases, we therefore evaluated the effect of rapamycin on the evolution of established intrahepatic STC-1 tumors. Rapamycin treatment was started during the early growth period, 8 days after intrasplenic injection, and maintained until day 25. With this protocol, the total tumor tissue surface showed a more than fourfold decrease in rapamycin-treated animals compared with untreated animals. Moreover, the survival was considerably enhanced in mice receiving rapamycin treatment. This significant antitumor effect likely resulted from several mechanisms, including antiproliferative and antiangiogenic but not proapoptotic effects.
We first verified that, in keeping with the effects observed in vitro, the mitotic index and the proliferative index were significantly decreased in vivo on rapamycin treatment. In contrast, no change was detected in the apoptotic index in the same conditions. In addition, VEGF expression and intratumoral microvascular density were much lower in intrahepatic nodules of rapamycin-treated mice. This strongly suggests that the antitumor effects of rapamycin in vivo are, at least in part, mediated through indirect antiangiogenic effects. It is interesting to recall that we have previously demonstrated that rapamycin is able to inhibit in vitro VEGF secretion by STC-1 cells.27
Our in vitro results showing a synergistic effect of rapamycin and LY294002 in the control of cell proliferation prompted us to test this combination in vivo. The drug combination, administered during the engraftment period, resulted in a stronger inhibition of tumor growth than rapamycin alone and in a concomitant stronger decrease in VEGF expression. This effect was verified for the two cell lines, STC-1 and GLUTag. This suggests that targeting the PI3K/Akt/mTOR pathway at both upstream and downstream steps may be beneficial in clinical practice.
Altogether, the in vivo results demonstrated the capacity of rapamycin to delay the progression of liver nodules. Indeed, even when the treatment was started after the formation of liver metastases, rapamycin was able to slow tumor growth, likely as a result of a combination of a direct antiproliferative action and of possible indirect effects, such as antiangiogenic properties.13,14 The inhibitory effects of rapamycin on tumor growth in vivo resulted in prolonged survival and improved clinical status.
In conclusion, we were able to demonstrate a marked antitumor effect in vivo in a physiologically relevant experimental animal model, which underlines and reinforces the interest of rapamycin and its analogues for the treatment of digestive endocrine tumors. Furthermore, we demonstrated a more potent antitumor efficiency by targeting simultaneously several levels of the PI3K/mTOR pathway. Further preclinical studies testing different potential inhibitors are thus needed to confirm such promising therapeutic strategies.
Footnotes
Supported by a grant from the Comité de la Drôme de la Ligue contre le Cancer (C.R.).
None of the authors disclosed any relevant financial relationships.
References
- 1.Hopfner M., Schuppan D., Scherubl H. Treatment of gastrointestinal neuroendocrine tumors with inhibitors of growth factor receptors and their signaling pathways: recent advances and future perspectives. World J Gastroenterol. 2008;14:2461–2473. doi: 10.3748/wjg.14.2461. [DOI] [PMC free article] [PubMed] [Google Scholar]
- 2.Guertin D.A., Sabatini D.M. Defining the role of mTOR in cancer. Cancer Cell. 2007;12:9–22. doi: 10.1016/j.ccr.2007.05.008. [DOI] [PubMed] [Google Scholar]
- 3.Yao J.C., Phan A.T., Chang D.Z., Wolff R.A., Hess K., Gupta S., Jacobs C., Mares J.E., Landgraf A.N., Rashid A., Meric-Bernstam F. Efficacy of RAD001 (everolimus) and octreotide LAR in advanced low- to intermediate-grade neuroendocrine tumors: results of a phase II study. J Clin Oncol. 2008;26:4311–4318. doi: 10.1200/JCO.2008.16.7858. [DOI] [PMC free article] [PubMed] [Google Scholar]
- 4.Rini B.I. Temsirolimus, an inhibitor of mammalian target of rapamycin. Clin Cancer Res. 2008;14:1286–1290. doi: 10.1158/1078-0432.CCR-07-4719. [DOI] [PubMed] [Google Scholar]
- 5.Grozinsky-Glasberg S., Franchi G., Teng M., Leontiou C.A., Ribeiro de Oliveira A., Jr, Dalino P., Salahuddin N., Korbonits M., Grossman A.B. Octreotide and the mTOR inhibitor RAD001 (everolimus) block proliferation and interact with the Akt-mTOR-p70S6K pathway in a neuro-endocrine tumour cell line. Neuroendocrinology. 2008;87:168–181. doi: 10.1159/000111501. [DOI] [PubMed] [Google Scholar]
- 6.Moreno A., Akcakanat A., Munsell M.F., Soni A., Yao J.C., Meric-Bernstam F. Antitumor activity of rapamycin and octreotide as single agents or in combination in neuroendocrine tumors. Endocr Relat Cancer. 2008;15:257–266. doi: 10.1677/ERC-07-0202. [DOI] [PubMed] [Google Scholar]
- 7.Zitzmann K., De Toni E.N., Brand S., Goke B., Meinecke J., Spottl G., Meyer H.H., Auernhammer C.J. The novel mTOR inhibitor RAD001 (everolimus) induces antiproliferative effects in human pancreatic neuroendocrine tumor cells. Neuroendocrinology. 2007;85:54–60. doi: 10.1159/000100057. [DOI] [PubMed] [Google Scholar]
- 8.Zitzmann K., Ruden J., Brand S., Goke B., Lichtl J., Spottl G., Auernhammer C.J. Compensatory activation of Akt in response to mTOR and Raf inhibitors - a rationale for dual-targeted therapy approaches in neuroendocrine tumor disease. Cancer Lett. 2010;295:100–109. doi: 10.1016/j.canlet.2010.02.018. [DOI] [PubMed] [Google Scholar]
- 9.Pourreyron C., Poncet G., Roche C., Gouysse G., Nejjari M., Walter T., Villaume K., Jacquier M.F., Bernard C., Dumortier J., Chayvialle J.A., Bachelot T., Scoazec J.Y. The role of angiogenesis in endocrine liver metastases: an experimental study. J Surg Res. 2008;144:64–73. doi: 10.1016/j.jss.2007.02.045. [DOI] [PubMed] [Google Scholar]
- 10.Rindi G., Grant S.G., Yiangou Y., Ghatei M.A., Bloom S.R., Bautch V.L., Solcia E., Polak J.M. Development of neuroendocrine tumors in the gastrointestinal tract of transgenic mice: heterogeneity of hormone expression. Am J Pathol. 1990;136:1349–1363. [PMC free article] [PubMed] [Google Scholar]
- 11.Drucker D.J., Jin T., Asa S.L., Young T.A., Brubaker P.L. Activation of proglucagon gene transcription by protein kinase-A in a novel mouse enteroendocrine cell line. Mol Endocrinol. 1994;8:1646–1655. doi: 10.1210/mend.8.12.7535893. [DOI] [PubMed] [Google Scholar]
- 12.Ratineau C., Bernard C., Poncet G., Blanc M., Josso C., Fontaniere S., Calender A., Chayvialle J.A., Zhang C.X., Roche C. Reduction of menin expression enhances cell proliferation and is tumorigenic in intestinal epithelial cells. J Biol Chem. 2004;279:24477–24484. doi: 10.1074/jbc.M401835200. [DOI] [PubMed] [Google Scholar]
- 13.Guba M., von Breitenbuch P., Steinbauer M., Koehl G., Flegel S., Hornung M., Bruns C.J., Zuelke C., Farkas S., Anthuber M., Jauch K.W., Geissler E.K. Rapamycin inhibits primary and metastatic tumor growth by antiangiogenesis: involvement of vascular endothelial growth factor. Nat Med. 2002;8:128–135. doi: 10.1038/nm0202-128. [DOI] [PubMed] [Google Scholar]
- 14.Lang S.A., Gaumann A., Koehl G.E., Seidel U., Bataille F., Klein D., Ellis L.M., Bolder U., Hofstaedter F., Schlitt H.J., Geissler E.K., Stoeltzing O. Mammalian target of rapamycin is activated in human gastric cancer and serves as a target for therapy in an experimental model. Int J Cancer. 2007;120:1803–1810. doi: 10.1002/ijc.22442. [DOI] [PubMed] [Google Scholar]
- 15.Nelsen C.J., Rickheim D.G., Tucker M.M., Hansen L.K., Albrecht J.H. Evidence that cyclin D1 mediates both growth and proliferation downstream of TOR in hepatocytes. J Biol Chem. 2003;278:3656–3663. doi: 10.1074/jbc.M209374200. [DOI] [PubMed] [Google Scholar]
- 16.Furuya F., Lu C., Willingham M.C., Cheng S.Y. Inhibition of phosphatidylinositol 3-kinase delays tumor progression and blocks metastatic spread in a mouse model of thyroid cancer. Carcinogenesis. 2007;28:2451–2458. doi: 10.1093/carcin/bgm174. [DOI] [PubMed] [Google Scholar]
- 17.Li B., Tsao S.W., Li Y.Y., Wang X., Ling M.T., Wong Y.C., He Q.Y., Cheung A.L. Id-1 promotes tumorigenicity and metastasis of human esophageal cancer cells through activation of PI3K/AKT signaling pathway. Int J Cancer. 2009;125:2576–2585. doi: 10.1002/ijc.24675. [DOI] [PubMed] [Google Scholar]
- 18.Mazelin L., Bernet A., Bonod-Bidaud C., Pays L., Arnaud S., Gespach C., Bredesen D.E., Scoazec J.Y., Mehlen P. Netrin-1 controls colorectal tumorigenesis by regulating apoptosis. Nature. 2004;431:80–84. doi: 10.1038/nature02788. [DOI] [PubMed] [Google Scholar]
- 19.Poncet G., Villaume K., Walter T., Pourreyron C., Theillaumas A., Lepinasse F., Hervieu V., Cordier-Bussat M., Scoazec J.Y., Roche C. Angiogenesis and tumor progression in neuroendocrine digestive tumors. J Surg Res. 2009;154:68–77. doi: 10.1016/j.jss.2008.03.055. [DOI] [PubMed] [Google Scholar]
- 20.Wulbrand U., Remmert G., Zofel P., Wied M., Arnold R., Fehmann H.C. mRNA expression patterns of insulin-like growth factor system components in human neuroendocrine tumours. Eur J Clin Invest. 2000;30:729–739. doi: 10.1046/j.1365-2362.2000.00700.x. [DOI] [PubMed] [Google Scholar]
- 21.Zhang H., Yee D. The therapeutic potential of agents targeting the type I insulin-like growth factor receptor. Expert Opin Investig Drugs. 2004;13:1569–1577. doi: 10.1517/13543784.13.12.1569. [DOI] [PubMed] [Google Scholar]
- 22.Hopfner M., Baradari V., Huether A., Schofl C., Scherubl H. The insulin-like growth factor receptor 1 is a promising target for novel treatment approaches in neuroendocrine gastrointestinal tumours. Endocr Relat Cancer. 2006;13:135–149. doi: 10.1677/erc.1.01090. [DOI] [PubMed] [Google Scholar]
- 23.O'Reilly K.E., Rojo F., She Q.B., Solit D., Mills G.B., Smith D., Lane H., Hofmann F., Hicklin D.J., Ludwig D.L., Baselga J., Rosen N. mTOR inhibition induces upstream receptor tyrosine kinase signaling and activates Akt. Cancer Res. 2006;66:1500–1508. doi: 10.1158/0008-5472.CAN-05-2925. [DOI] [PMC free article] [PubMed] [Google Scholar]
- 24.Sun S.Y., Rosenberg L.M., Wang X., Zhou Z., Yue P., Fu H., Khuri F.R. Activation of Akt and eIF4E survival pathways by rapamycin-mediated mammalian target of rapamycin inhibition. Cancer Res. 2005;65:7052–7058. doi: 10.1158/0008-5472.CAN-05-0917. [DOI] [PubMed] [Google Scholar]
- 25.Sarbassov D.D., Ali S.M., Sengupta S., Sheen J.H., Hsu P.P., Bagley A.F., Markhard A.L., Sabatini D.M. Prolonged rapamycin treatment inhibits mTORC2 assembly and Akt/PKB. Mol Cell. 2006;22:159–168. doi: 10.1016/j.molcel.2006.03.029. [DOI] [PubMed] [Google Scholar]
- 26.Folkes A.J., Ahmadi K., Alderton W.K., Alix S., Baker S.J., Box G., Chuckowree I.S., Clarke P.A., Depledge P., Eccles S.A., Friedman L.S., Hayes A., Hancox T.C., Kugendradas A., Lensun L., Moore P., Olivero A.G., Pang J., Patel S., Pergl-Wilson G.H., Raynaud F.I., Robson A., Saghir N., Salphati L., Sohal S., Ultsch M.H., Valenti M., Wallweber H.J., Wan N.C., Wiesmann C., Workman P., Zhyvoloup A., Zvelebil M.J., Shuttleworth S.J. The identification of 2-(1H-indazol-4-yl)-6-(4-methanesulfonyl-piperazin-1-ylmethyl)-4-morpholin -4-yl-thieno[3,2-d]pyrimidine (GDC-0941) as a potent, selective, orally bioavailable inhibitor of class I PI3 kinase for the treatment of cancer. J Med Chem. 2008;51:5522–5532. doi: 10.1021/jm800295d. [DOI] [PubMed] [Google Scholar]
- 27.Villaume K., Blanc M., Gouysse G., Walter T., Couderc C., Nejjari M., Vercherat C., Cordier-Bussat M., Roche C., Scoazec J.Y. VEGF secretion by neuroendocrine tumor cells is inhibited by octreotide and by inhibitors of the PI3K/AKT/mTOR pathway. Neuroendocrinology. 2010;91:268–278. doi: 10.1159/000289569. [DOI] [PubMed] [Google Scholar]