Abstract
Objectives
Sonoporation uses ultrasound (US) and ultrasound contrast agents (UCAs) to enhance cell permeabilization, thereby allowing delivery of therapeutic compounds non-invasively into specific target cells. The objective of this study was to elucidate the biophysical mechanism of sonoporation, specifically the role of UCAs as well as exposure frequency. The inertial cavitation (IC) thresholds of the lipid-shelled octafluoropropane UCA were directly compared to the levels of generated sonoporation to determine the involvement of UCAs in producing sonoporation.
Methods
Chinese hamster ovary cells were exposed as a monolayer in a solution of the UCA, 500,000-Da fluorescein isothiocyanate-dextran, and phosphate-buffered saline to 30 seconds of pulsed US (pulse duration, 5 cycles; pulse repetition frequency, 10 Hz) at 3 frequencies (0.92, 3.2, and 5.6 MHz). The peak rarefactional pressure (Pr) was varied over a range from 4 kPa to 4.1 MPa, and 5 to 7 independent replicates were performed at each pressure.
Results
The experimental observations demonstrated that IC was likely not the physical mechanism for sonoporation. Sonoporation activity was observed at pressure levels below the threshold for IC of the UCA (1.27 ± 0.32 MPa at 0.92 MHz, 0.84 ± 0.19 MPa at 3.2 MHz, and 2.57 ± 0.26 MPa at 5.6 MHz) for all 3 frequencies examined. The Pr values at which the peak sonoporation activity occurred were 1.4 MPa at 0.92 MHz, 0.25 MPa at 3.2 MHz, and 2.3 MPa at 5.6 MHz. The UCA collapse thresholds followed a similar trend. A 1-way analysis of variance test confirmed that sonoporation activity differed among the 3 frequencies examined (P = 10−8).
Conclusions
These results thus suggest that sonoporation is related to linear and/or nonlinear oscillation of the UCA occurring at pressure levels below the IC threshold.
Keywords: Chinese hamster ovary cells, inertial cavitation, sonoporation, thresholds, ultrasound contrast agent
Ultrasound contrast agents (UCAs), originally designed to improve the contrast in an ultrasonic image, have an increasing potential for use in applications such as drug delivery, gene therapy, blood clot dissolution,1,2 angiogenesis,3,4 and blood-brain barrier permeation,5,6 to name a few. Sonoporation involves the use of ultrasound (US) and UCAs to deliver therapeutic compounds noninvasively into specific target cells.
The presence of a UCA is necessary to induce a significant sonoporation event.7-9 Ultrasound contrast agents undergo complex behaviors in the presence of US. These behaviors are dependent on the US frequency10-13 and peak rarefactional pressure (Pr). The behaviors include linear oscillations, nonlinear oscillations, and inertial cavitation (IC). Each of these UCA behaviors has the potential to provide mechanisms for bioeffects. Microstreaming, microjets,14 increased temperatures, 15 free radical production,16-18 and mechanical stresses19-22 are among the potential mediators of sonoporation, and each has been shown to produce bioeffects. The future use of sonoporation in clinical applications depends on knowing which of those mediators produces the permeability change and designing exposures that maximize that effect.
Recent studies suggest that oscillating UCAs, not IC, are responsible for sonoporation.23 Linear and nonlinear oscillations of the UCA lead to local steady flows that are termed microstreaming. When the UCA is close to a cell, this microstreaming can lead to shearing motions on the cell membrane. Nonlinear oscillation also produces the potential for microjets. However, because of the known irregularities of formation,24,25 it is unlikely that microjets could be wholly responsible for published sonoporation trends.
Theoretical and experimental studies have shown that microstreaming near a cell boundary can adversely affect a cell membrane. A longitudinally vibrating needle in erythrocyte, Tetrahymena pyriformis, Escherichia coli, algae, Nitella, and onion skin suspensions displayed varying degrees of cellular injury depending on the degree of shearing from eddying motions.26,27 Microstreaming from a transversely vibrating Mason horn demonstrated reparable sonoporation in Jurkat lymphocytes. A threshold shear stress occurred at 12 ± 4 Pa for a 21.4-kHz and 7-minute exposure.28 A study by Williams29 also mentioned sub-lethal damage to ascites cells below the threshold for membrane disruption that was consistent with a change in membrane permeability.
Hughes and Nyborg27 introduced the first experimental setup for creating sustainable bubbles and observing bioeffects due to their low-amplitude oscillations. They disrupted E coli at levels where no collapse was observed among the bubbles, and free radical formation did not occur. Rooney30 used a single hemispherical bubble in a 20-kHz field. The hemolysis resulting from treatment of erythrocyte suspensions occurred at a threshold of 4500 dynes/cm2 (450 Pa). Also, under single-bubble controlled conditions (10 kPa at 180 kHz), Marmottant and Hilgenfeldt31 demonstrated that linear microbubble oscillations were sufficient to rupture unilamellar lipid membranes due to large velocity gradients.
Several parameters have been shown to influence the degree of bioeffects produced by microstreaming. The threshold intensity for hemolysis decreased with increasing temperatures (>40°C) at all frequencies studied and for both an oscillating wire and a bubble.32 Between 23°C and 40°C, the threshold remained fairly consistent. Rooney32 also showed that there is an upper limit to the viscosity of the medium in that solutions of high viscosity prevent adequate transport of cells into the region of the bubble. The time of exposure and the level of shear stress have an inverse relationship; as the time of exposure is decreased, the greater is the threshold shear stress for sonoporation.28
Experimental studies concerning microstreaming from UCAs are limited. Monolayer BR14 bovine endothelial cells exposed to 1-MHz US at a Pr of 0.4 MPa for 5 seconds in the presence of the UCA experienced deformation caused by the vibrating UCAs.33 These cells became locally permeable to small extracellular molecules only for the short period of bubble vibration. Unique to this study was that the UCAs and the cells were visually observed during exposure, allowing verification that liquid jets did not occur before permeabilization.
The experimental work presented above revealed that shearing flow can deform cells and large molecules, sometimes irreversibly. Rooney32 verified that it is indeed the microstreaming due to an oscillating bubble or wire that is producing these bioeffects, not the bulk acoustic streaming caused by the US wave. Forbes et al23 also verified that bulk acoustic streaming did not alter the permeability of cells. Therefore, microstreaming due to the oscillation of UCAs in a sound field could cause the cell membrane permeability changes observed in sonoporation.
Sonoporation is a promising drug delivery and gene therapy technique, limited chiefly by a lack of understanding regarding the biophysical mechanism that causes the cell membrane permeability change. The objective of this study was to expand the work by Forbes et al23 to include a different UCA, Definity (Lantheus Medical Imaging, North Billerica, MA), and 3 acoustic frequencies (0.92, 3.2, and 5.6 MHz).
Materials and Methods
Experimental Design
The objective of this project was to determine the relationship between sonoporation and the behavior of UCAs. By varying the frequency and Pr, the sonoporation results were determined for a variety of UCA conditions. These results were used in a direct comparison to UCA collapse thresholds. The experimental design was the same as that outlined in detail in Forbes et al,23 with a few exceptions, including the choice of contrast agents and exposure frequencies. Therefore, the procedure outlined here will be brief.
Cell Culture
Chinese hamster ovary cells (American Type Culture Collection, Manassas, VA) were cultured in F-12K Medium (American Type Culture Collection) with 10% vol/vol fetal bovine serum (American Type Culture Collection), 1% penicillin/streptomycin (Sigma-Aldrich, St Louis, MO), and 0.1% fungizone (Invitrogen, Carlsbad, CA). The Chinese hamster ovary cells were propagated as a monolayer in 75-cm3 tissue culture flasks at 37°C and a humidified atmosphere of 5% carbon dioxide.
Contrast Agent
Definity contains octafluoropropane and is stabilized by a phospholipid shell. The concentration of Definity in the vial is 120 × 108 mL−1 gas bodies. The mean diameter ranges from 1.1 to 3.3 μm, with 98% of the microbubbles smaller than 10 μm.
The size distribution of Definity was measured in our laboratory using an algorithm developed to measure the radius of the microbubbles on an image. Figure 1 graphically presents the distribution. The radii of Definity varied between 0.025 and 2.23 μm, and the average radius was 0.82 μm. This is similar to the commercial printout that accompanied the Definity vial.
Figure 1.
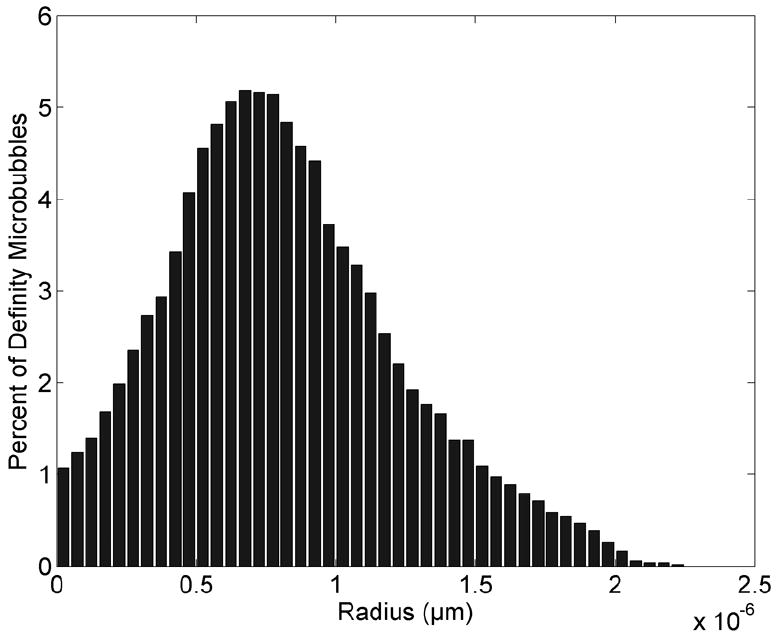
Size distribution of Definity bubbles immediately after activation.
Permeability Marker
To monitor the cell permeability, molecules that are typically membrane impermeant are added to the solution surrounding the cells. Uptake of these molecules by the cell signifies a permeability change. The permeability marker used in this study was 500,000-Da fluorescein isothiocyanate (FITC)-dextran (FD500S; Sigma-Aldrich). This marker is normally unable to cross the cell membrane. Dextran is a hydrophilic polysaccharide with good water solubility and low toxicity and is biologically inert. The approximate Stokes radius is greater than 100 angstroms (0.01 μm).
Ultrasound Exposure Vessels and Cell Preparation
The sample vessel was a 96-well cell culture microplate (BD Falcon, San Jose, CA) constructed from medical-grade polystyrene. Each well is flat bottomed, holds 0.37 mL, and has a diameter of 6.4 mm, 4.25 times the −6-dB focal beam width for all 3 frequencies. The open face of the microplate was covered by plastic cling wrap, forming a barrier between the external water bath and internal cell solution, as well as an acoustic window for the US to pass into the well unperturbed.
Chinese hamster ovary cells were harvested, and 0.3 × 10⁶ cells/mL in 0.37 mL of growth medium were added to each well of a clean, sterilized exposure vessel. The vessel was incubated overnight to form the monolayer of greater than 90% confluence.
Thirty-six wells were loaded with cells, leaving empty wells to prevent interaction between adjacent samples. On the day of the experiment, the growth medium was removed, and the monolayer was rinsed twice with phosphate-buffered saline (PBS) to remove any dead cells and debris. The exposure medium was then added to each well: 0.05 mL of FITC-dextran solution, 700,000 (0.57 μL) Definity microbubbles, and PBS to fill the remaining well volume. The plate was then sealed with plastic cling wrap.
The vessel was placed in a room temperature degassed water bath with the plastic cling wrap located near the transducer (Figure 2). The cell monolayer was located on the back window of the chamber, allowing the UCAs to rise to the monolayer due to buoyancy and be pushed toward the monolayer by the radiation force. The focus of the transducer was positioned at the bottom of the well, where the cells were located, and centered in the exposed well with respect to the US beam.
Figure 2.
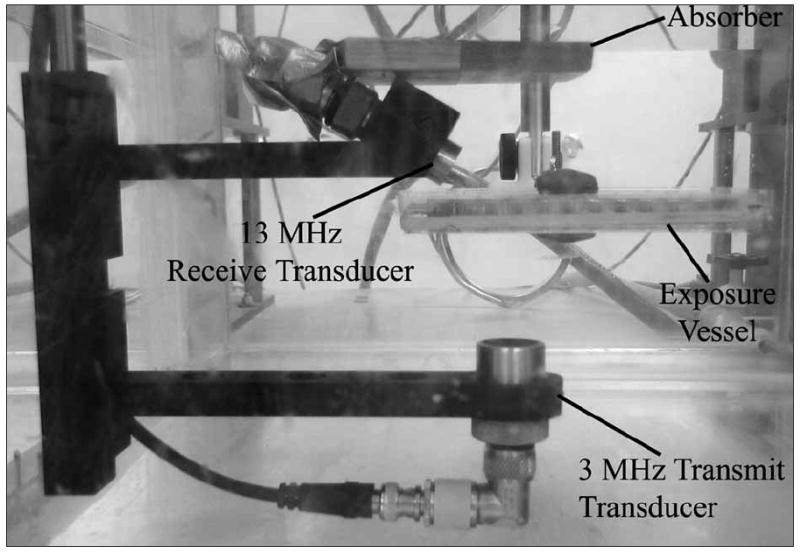
Experimental setup.
Each well was independently exposed or sham exposed (US turned off) at the predetermined conditions. The order of well exposure was varied to avoid any influences regarding the order of exposure.
Ultrasound Exposure
Ultrasound was produced by 1 of 3 single-element 19-mm-diameter focused transducers (Valpey Fisher, Hopkinton, MA): 0.92-MHz f/1, 3.2-MHz f/3, and 5.6-MHz f/5 transducers. The f-number was chosen such that the −6-dB beam width at the focus was 1.5 mm for all exposure frequencies, eliminating the beam width as a variable. The depth of focus for the 0.92-MHz transducer was 18 mm; for the 3.2-MHz transducer it was 29 mm; and for the 5.6-MHz transducer it was 96 mm. Both the beam width and depth of focus were measured quantities.34
The calibrated transmit pressure amplitude at the focus was varied using the output control settings of the pulser-receiver (RAM5000; Ritec, Warwick, RI). To obtain smaller changes in the pressure amplitude, a step-variable attenuation was used. The transmit pressure waveforms were calibrated at the field’s focus for each exposure condition. Calibrations were routinely performed according to well-established calibration techniques,35,36 using a National Physical Laboratory–calibrated polyvinylidene difluoride bilaminar shielded membrane hydrophone (diameter of the active element, 0.5 mm; Marconi 699/1/00001/100; GEC Marconi Ltd, Great Baddow, England). The hydrophone was located in the field’s focus at the same position that the exposure vessel was located during experiments. Evaluation of the attenuation of the plastic cling wrap and reflection coefficient of the polystyrene exposure vessel was previously discussed by Forbes et al.23
Five-cycle sinusoidal tone bursts were generated by the Ritec pulser-receiver. For all exposures, the pulse repetition frequency was 10 Hz, and the exposure duration was 30 seconds. The Pr was varied over a range from 0.004 to 4.1 MPa (Table 1), and 5 to 7 independent replicates were performed at each Pr value. These Pr ranges were chosen to encompass the threshold ranges for Definity collapse.37
Table 1.
Calibrated Peak Rarefactional Pressure Range Used in Sonoporation Studies for the 3 Transducers
| Center Frequency, MHz | Pr Range Examined, MPa |
|---|---|
| 0.92 | 0.004–3.2 |
| 3.2 | 0.013–4.1 |
| 5.6 | 0.08–4.0 |
Postexposure Analysis
After exposure, the vessel was removed from the water bath. The exposure medium in each of the wells was transferred to correspondingly labeled microcentrifuge tubes and placed on ice. Trypsin-EDTA (0.1 mL) was added to the monolayer in each well, and after 5 minutes, the trypsinized cells were added to the same microcentrifuge tube as the exposure medium. Each cell suspension was immediately washed twice with 1 mL of cold PBS to remove the permeability marker from the solution.
The method for analysis was flow cytometry (Epics XL-MCL; Beckman Coulter, Inc, Fullerton, CA). To assess cell viability, 1 μL of propidium iodide (Sigma-Aldrich) was added to each sample. Results from flow cytometry were expressed in percentages of positively labeled cells, using the software program Summit Version 3.1 for MoFlo Acquisition and Sort Control (Cytomation, Inc, Fort Collins, CO).
The data returned the percentage of fluorescent cells in the viable cell population and dead cells in the entire population. The control histogram was from the sham-exposed sample (US turned off), and the exposed histogram was from the sample exposed to US. Both the control and exposed histograms were normalized to 18,000 counts. To determine the sonoporated cells, the control histogram was subtracted from the exposed histogram to remove the background fluorescence of the cells. This subtraction was performed using the software program Summit Version 3.1 For MoFlo Acquisition and Sort Control. The resulting histogram will be referred to as the “subtraction histogram” because nonfluorescing cells (nonsonoporated cells) have been subtracted out. The number of cells in the subtraction histogram was divided by the number of cells in the exposed histogram to obtain the percentage of sonoporated cells.
Measurement of Acoustic Pressure Thresholds for Collapse of Definity Microbubbles
The pressure threshold for UCAs has been shown to increase with frequency, ambient pressure, and viscosity and decrease with temperature and gas content.10-13,38 A passive cavitation detector39 was previously used to determine collapse thresholds of Definity37 in degassed water. The exposure medium used in this study contains a permeability agent that changes the viscosity of the exposure medium, which subsequently influences the IC threshold. Therefore, the collapse threshold was determined for the exposure media and settings used in this study. A t test was used to compare the collapse thresholds of the exposure medium and water.
For a concentration of 0.30% dextran with a 500-kDa molecular weight, the shear viscosity is around 0.002 to 0.003 Pa/s, whereas water has a shear viscosity of 0.001 Pa/s. To determine the impact of the external FITC-dextran media on the UCA thresholds, a series of experiments was conducted for Definity using ultrasonic frequencies of 0.92, 3.2, and 5.6 MHz. The exposure parameters were identical to the sonoporation studies. The passive cavitation detector was used to find the thresholds for bubble collapse; the detailed procedure for using the passive cavitation detector to determine collapse thresholds was outlined by Ammi et al.10 The transmit transducer was aimed upward at the vessel. A 13-MHz focused transducer (12.7-mm diameter and 15.4-mm focal length) was mounted confocal and at a 115° angle to the transmit beam axis and used to passively collect emissions from the bubbles injected into the exposure vessel (Figure 2). The focal zones of the two transducers were aligned, and the approximate confocal volume was 0.12 mm3. The concentration of UCAs in the exposure vessel was such that approximately one UCA was located in the focal region at one time.
It was found that the polystyrene construction of the sonoporation exposure vessel attenuated the emissions from the bubbles; as a result, the UCA signals could not be identified from the background even with amplification. Therefore, another exposure vessel was used for the threshold studies. This vessel was made of an acrylic ring with plastic cling wrap attached to both faces of the ring with O rings. The exposure vessel was filled with the exposure medium minus the cells.
The outputs from both transducers were amplified (44 dB), digitized (12 bit, 200 MHz; UF 3025 digitizing board; Strategic Test, Cambridge, MA) and saved to a computer. The data were processed offline using MAT-LAB (The MathWorks, Natick, MA).
The collapse thresholds were determined with a technique using postexcitation broadband signals to identify microbubble destruction. These postexcitation signals are linked to IC of bubbles released after UCA shell rupture. The minimum Pr value leads to the minimum collapse threshold.
For each setting, 750 waveforms were acquired from the receive transducer. Spectrograms were generated from the waveforms by implementation of a MATLAB function. The spectrograms were sorted into 4 classes: noise, oscillation of a single bubble, collapse of a single bubble, and multiple bubbles. To identify a bubble, a 2-microsecond window that corresponded to the passive cavitation detector response of the scattered microbubble echo was examined. In the spectrogram during this window, if the fundamental mode and harmonic modes were visible, this indicated the presence of an oscillating bubble. The harmonic modes may have been generated by both nonlinear bubble dynamics and nonlinear propagation of the exciting pulse and scattered echo. To identify a bubble as collapsed, an additional broadband signal (rebound) occurs approximately 1 microsecond after the frequency bands corresponding to the fundamental and harmonic modes.
The IC threshold was then defined as the lowest Pr level from the “collapse of a single bubble” data set. Figure 3 presents examples of the 3 typical cases observed. These collapse thresholds were used in the analysis of sonoporation correlation to IC for the studies using FITC-dextran as the permeability marker.
Figure 3.
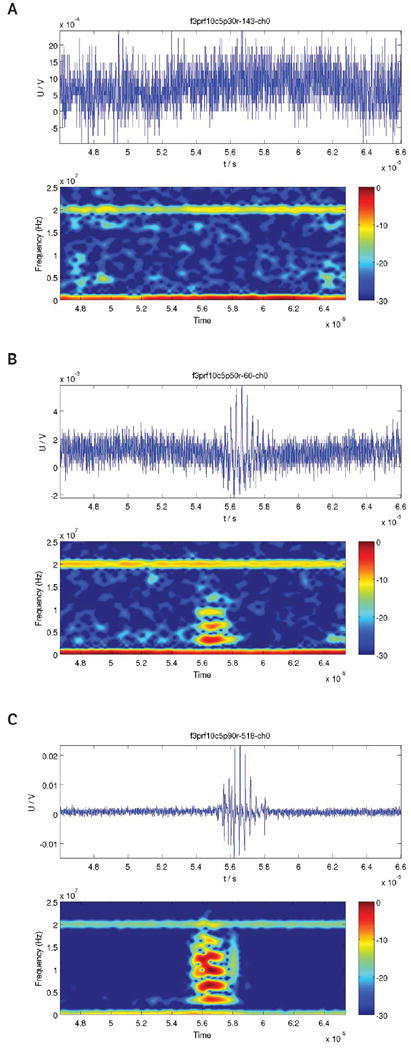
Examples of waveforms observed during cavitation studies. A, Waveform showing noise only. B, Waveform showing a single oscillating ultrasound contrast agent. C, Waveform showing a collapsing ultrasound contrast agent; notice the broadband rebound signal. U/V denotes the echo signal in volts.
Data Analysis
All sonoporation experiments were independently repeated 5 to 7 times at each exposure condition. The data were calculated as the percentage of fluorescent cells in the live population and the percentage of dead cells in the entire population. The error was calculated using the SEM for the 5 to 7 independent replicate samples. Results at each exposure condition were reported as mean ± SEM. A 1-way analysis of variance test was performed to compare the sonoporation activity at the 3 frequencies examined.
Results
Acoustic Pressure Collapse Thresholds for Definity
A study was conducted using 3.2-MHz and 5-cycle pulses to determine the collapse threshold for Definity in the FITC-dextran exposure medium. Three independent replicates were performed at each Pr to obtain the collapse data over a Pr range of 14 kPa to 7.1 MPa. Each replicate had a minimum of 30 samples with a single bubble present. The collapse threshold was found to be 0.95 ± 0.22 MPa. The collapse threshold of Definity in water (Figure 4)37 is contained within the error margin for the collapse threshold of Definity in FITC-dextran. A t test, comparing the collapse thresholds in water and FITC-dextran at 3.2-MHz, returned a P value of .70 (α = .05). Therefore, the collapse threshold of Definity is not significantly different between water and the FITC-dextran medium.
Figure 4.
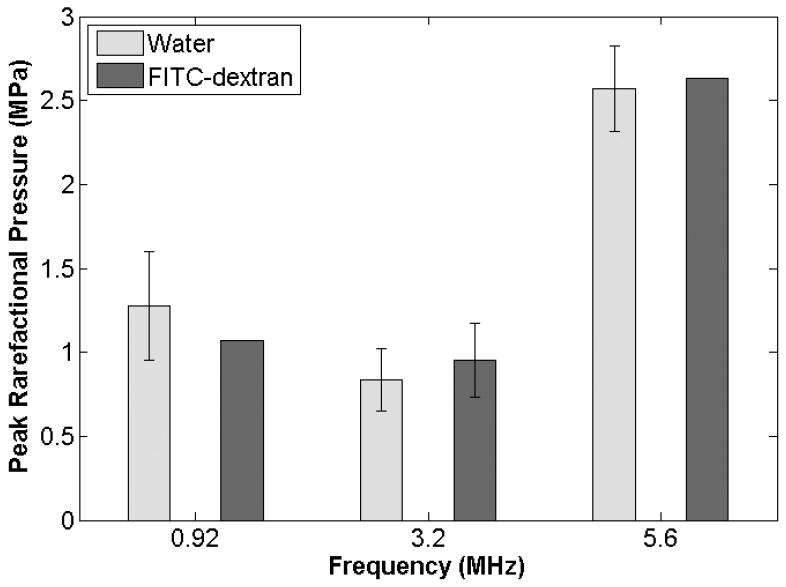
Definity collapse thresholds for a 5-cycle pulse duration at 0.92, 3.2, and 5.6 MHz in degassed water and the FITC-dextran solution.
Sonoporation studies in the FITC-dextran medium were also conducted for 5-cycle pulses at 0.92 and 5.6 MHz; therefore, collapse thresholds were obtained for those settings. As the 3.2-MHz threshold was essentially the same for the water and FITC-dextran media, it was expected that this would hold true for 0.92 and 5.6 MHz. As such, a single experiment was conducted at each frequency in the FITC-dextran medium. If the threshold found from this one trial differed from that found in water, additional independent replications would be performed to determine a collapse threshold at those frequencies in FITC-dextran with an appropriate statistical analysis. However, for both frequencies, additional replications were not warranted.
For the 0.92-MHz study, 1.1 MPa was the lowest Pr examined that exhibited Definity collapse. The next lowest Pr examined was 0.8 MPa, and Definity did not undergo collapse at this lower pressure. Therefore, the collapse threshold for Definity at 0.92 MHz and 5 cycles in the FITC-dextran medium is between 0.8 and 1.1 MPa. The collapse threshold found in water for the same exposure settings was 1.27 ± 0.32 MPa.37 By the same measure, the collapse threshold for Definity at 5.6 MHz and 5 cycles in FITC-dextran lies between 2.5 and 2.6 MPa. The collapse threshold in water was found to be 2.57 ± 0.26 MPa.37 Thus, for both frequencies, the collapse threshold found in the FITC-dextran medium was within the error range for the collapse thresholds found in water (Figure 4). From this we can conclude that the collapse threshold in 0.30% FITC-dextran is not significantly different from that in water.
Sonoporation Results for Chinese Hamster Ovary Cells and 3 Frequencies (0.92, 3.2, and 5.6 MHz)
Chinese hamster ovary cells exposed to US in the presence of Definity were observed by means of FITC-dextran internalization to have undergone sonoporation. All samples were exposed to 5-cycle pulses for 30 seconds at a pulse repetition frequency of 10 Hz. Three center frequencies were examined: 0.92, 3.2, and 5.6 MHz. For each frequency, a threshold-type study examining sonoporation activity as a function of the Pr was performed. The Pr ranged from 4 kPa to 4.1 MPa. The results reveal a sonoporation trend that is consistent among the 3 frequencies (Figure 5). For all frequencies, the fraction of sonoporated cells among the total viable population increased as the Pr was increased to a maximum value. At Pr levels above this maximal sonoporation activity, a decrease in sonoporation activity was observed.
Figure 5.
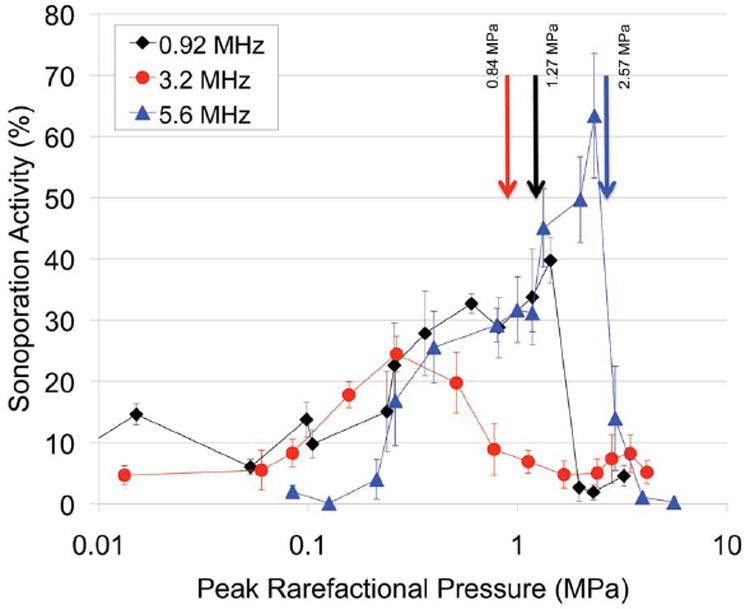
Percentage of sonoporated cells after exposure with 0.92-, 3.2-, and 5.6-MHz center frequencies at 5 cycles, a 10-Hz pulse repetition frequency, and a 30-second exposure duration with Definity. The arrows denote the collapse thresholds for Definity.
For 0.92-MHz US, the fraction of sonoporated cells was 2.12% for the lowest Pr of 4 kPa. The maximum sonoporation activity was 39.8% and was observed at a Pr of 1.4 MPa. Above this Pr, the sonoporation activity dropped to 2.7%. The 0.92-MHz 5-cycle collapse threshold of Definity in degassed water was 1.27 ± 0.32 MPa.37 At this threshold pressure, sonoporation was at its maximum activity. These results indicate that significant sonoporation was taking place at Pr levels where IC of Definity was not occurring. At a Pr above 1.4 MPa, a marked decrease in sonoporation activity was observed. This decrease corresponds to pressures of Definity collapse. The percentage of nonviable cells at each Pr is plotted in Figure 6. For the Pr range examined, the nonviable cells varied between 4.4% and 6.6%, with no distinct pattern emerging with respect to the Pr. Sonoporation is not immediately lethal to the cells, and cell death is not related to the activity of the UCA, nor is cell death a contributor to the drop in sonoporation seen above 1.4 MPa.
Figure 6.
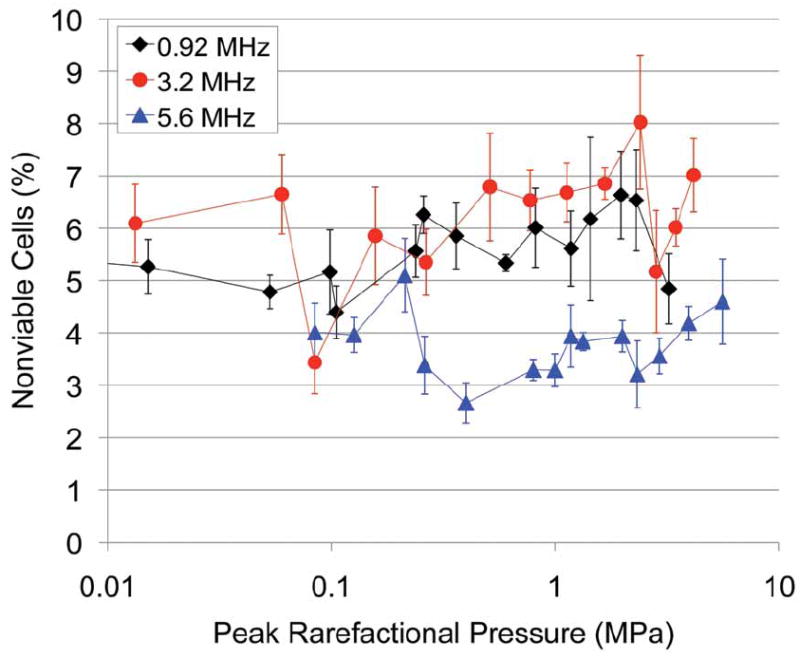
Percentage of nonviable cells immediately after exposure to 0.92-, 3.2-, and 5.6-MHz 5-cycle ultrasound for 30 seconds at a 10-Hz pulse repetition frequency in the presence of Definity.
Chinese hamster ovary cells exposed to 3.2- and 5.6-MHz US in the presence of Definity also underwent sonoporation, showing the same response to the Pr as was seen with the 0.92-MHz exposure. The sonoporation activity increased as the Pr increased up to a maximum of 24.5% (at 260 kPa) and 63.4% (at 2.3 MPa), respectively (Figure 5). Compared to the Definity collapse threshold pressure for both frequencies, significant sonoporation was taking place at Pr levels where IC of Definity was not occurring. As the Pr was increased above the collapse threshold, a marked decrease in sonoporation activity was observed. At 3.2 MHz, from 260 kPa to 1.7 MPa, sonoporation dropped from 24.5% to 4.8%. At 5.6 MHz, the sonoporation activity dropped to 14.0% at 2.9 MPa and then to 1.1% at 4.0 MPa. For both frequencies, the percentage of nonviable cells revealed no distinct pattern with respect to the Pr.
One-way analysis of variance analysis was performed to test for differences among the 3 applied frequencies. The resulting P value was 10−8 (α = .05). Therefore, there is a statistically significant difference between the sonoporation activities at the 3 frequencies.
Discussion
Previous work by Forbes et al23 revealed that IC is not the mechanism for sonoporation. Instead, microstreaming from oscillating Optison (GE Healthcare, Princeton, NJ) resulted in shear stress on the cell membranes, which produced sonoporation. Additionally, direct observation revealed that oscillating BR14 UCAs at 1 MHz and 0.4 MPa sonoporated cells.33 The results of the study presented here, using Definity, support the same conclusion. For all 3 frequencies studied, sonoporation occurred below the collapse threshold for Definity, while microbubbles were still intact. At 0.92 and 5.6 MHz, the sonoporation activity reached its maximum value around the collapse threshold. Therefore, essentially all of the sonoporation activity for these 2 cases occurred while Definity microbubbles were intact. For the 3.2-MHz study, the sonoporation activity had reached its maximum activity below the collapse threshold. These 3 independent studies established the same conclusion: sonoporation is occurring while the UCA microbubbles are still intact. Thus, IC is not required for sonoporation to occur.
At a Pr greater than the collapse thresholds, a drop in sonoporation activity occurs. If IC were the sonoporation mechanism, then it would be expected that sonoporation would be maximized when all of the bubbles were collapsing. That, however, is not the case. Sonoporation is maximized at a Pr of less than where 100% of the UCAs are collapsing. It is also important to note that the Pr at which the maximum sonoporation occurs and the subsequent drop in sonoporation occurs tracks very closely to the collapse threshold for the UCA. Definity exposed at 3.2 MHz has the lowest collapse threshold of the 3 frequencies; consequently, this frequency shows the maximum sonoporation activity occurring at the lowest Pr. The 5.6-MHz collapse threshold occurred at the highest Pr, and the maximum sonoporation activity occurred at the highest Pr of the 3 studies.
For all 3 cases, Pr levels greater than that for maximum sonoporation activity revealed a drop in sonoporation. A similar drop in sonoporation activity was seen in a study by Hallow et al40 using 1.7 vol% Optison, 1.1 MHz, and a 3-second exposure duration. Furthermore, it has been shown in a study by Kamaev et al41 that as the percentage of Optison destroyed increases, the uptake of macromolecules by cells in suspension decreases. Therefore, it can be concluded that when UCAs are undergoing IC, sonoporation is minimized.
The evidence provided suggests that the sonoporation effect was caused by linear or nonlinear oscillation of the UCA. These responses occur at lower pressure amplitudes and could thus explain the presence of sonoporation at the lower pressure levels. Additionally, among the 3 center frequencies examined, the Pr of the maximum sonoporation activity correlates with the IC threshold for Definity. Therefore, we conclude that microbubble oscillation is the responsible mechanism for sonoporation, not IC.
Acknowledgments
This work was supported in part by an Illinois distinguished fellowship for predoctoral students, by National Institutes of Health fellowship F31EB06634, and by National Institutes of Health grant R37EB02641. Cell culture facilities were provided by the Imaging Technology Group of the Beckman Institute for Advanced Science and Technology at the University of Illinois at Urbana-Champaign.
Abbreviations
- FITC
fluorescein isothiocyanate
- IC
inertial cavitation
- PBS
phosphate-buffered saline
- Pr
peak rarefactional pressure
- UCA
ultrasound contrast agent
- US
ultrasound
References
- 1.Datta S, Coussios CC, Ammi AY, Mast TD, de Courten-Myers GM, Holland CK. Ultrasound-enhanced thrombolysis using Definity as a cavitation nucleation agent. Ultrasound Med Biol. 2008;34:1421–1433. doi: 10.1016/j.ultrasmedbio.2008.01.016. [DOI] [PMC free article] [PubMed] [Google Scholar]
- 2.Maxwell AD, Cain CA, Duryea AP, Yuan L, Gurm HS, Xu Z. Noninvasive thrombolysis using pulsed ultrasound cavitation therapy: histotripsy. Ultrasound Med Biol. 2009;35:1982–1994. doi: 10.1016/j.ultrasmedbio.2009.07.001. [DOI] [PMC free article] [PubMed] [Google Scholar]
- 3.Barzelai S, Sharabani-Yosef O, Holbova R, et al. Low-intensity ultrasound induces angiogenesis in rat hind-limb ischemia. Ultrasound Med Biol. 2006;32:139–145. doi: 10.1016/j.ultrasmedbio.2005.08.010. [DOI] [PubMed] [Google Scholar]
- 4.Young SR, Dyson M. The effect of therapeutic ultrasound on angiogenesis. Ultrasound Med Biol. 1990;16:261–269. doi: 10.1016/0301-5629(90)90005-w. [DOI] [PubMed] [Google Scholar]
- 5.Choi JJ, Pernot M, Small SA, Konofagou EE. Noninvasive, transcranial and localized opening of the blood-brain barrier using focused ultrasound in mice. Ultrasound Med Biol. 2007;33:95–104. doi: 10.1016/j.ultrasmedbio.2006.07.018. [DOI] [PubMed] [Google Scholar]
- 6.Liu HL, Pan CH, Ting CY, Hsiao MJ. Opening of the blood-brain barrier by low-frequency (28-kHz) ultrasound: a novel pinhole-assisted mechanical scanning device. Ultrasound Med Biol. 2010;36:325–335. doi: 10.1016/j.ultrasmedbio.2009.10.004. [DOI] [PubMed] [Google Scholar]
- 7.Bao S, Thrall BD, Miller DL. Transfection of a reporter plasmid into cultured cells by sonoporation in vitro. Ultrasound Med Biol. 1997;23:953–959. doi: 10.1016/s0301-5629(97)00025-2. [DOI] [PubMed] [Google Scholar]
- 8.Greenleaf WJ, Bolander ME, Sarkar G, Goldring MB, Greenleaf JF. Artificial cavitation nuclei significantly enhance acoustically induced cell transfection. Ultrasound Med Biol. 1998;24:587–595. doi: 10.1016/s0301-5629(98)00003-9. [DOI] [PubMed] [Google Scholar]
- 9.Kim HJ, Greenleaf JF, Kinnick RR, Bronk JT, Bolander ME. Ultrasound-mediated transfection of mammalian cells. Hum Gene Ther. 1996;7:1339–1346. doi: 10.1089/hum.1996.7.11-1339. [DOI] [PubMed] [Google Scholar]
- 10.Ammi AY, Cleveland RO, Mamou J, Wang GI, Bridal SL, O’Brien WD., Jr Ultrasonic contrast agent shell rupture detected by inertial cavitation and rebound signals. IEEE Trans Ultrason Ferroelectr Freq Control. 2006;53:126–136. doi: 10.1109/tuffc.2006.1588398. [DOI] [PMC free article] [PubMed] [Google Scholar]
- 11.Chen WS, Brayman AA, Matula TJ, Crum LA, Miller MW. The pulse length-dependence of inertial cavitation dose and hemolysis. Ultrasound Med Biol. 2003;29:739–748. doi: 10.1016/s0301-5629(03)00029-2. [DOI] [PubMed] [Google Scholar]
- 12.Chomas JE, Dayton P, May D, Ferrara K. Threshold of fragmentation for ultrasonic contrast agents. J Biomed Opt. 2001;6:141–150. doi: 10.1117/1.1352752. [DOI] [PubMed] [Google Scholar]
- 13.Giesecke T, Hynynen K. Ultrasound-mediated cavitation thresholds of liquid perfluorocarbon droplets in vitro. Ultrasound Med Biol. 2003;29:1359–1365. doi: 10.1016/s0301-5629(03)00980-3. [DOI] [PubMed] [Google Scholar]
- 14.Prentice P, Cuschieri A, Dholakia K, Prausnitz MR, Campbell P. Membrane disruption by optically controlled microbubble cavitation. Nat Phys. 2005;1:107–110. [Google Scholar]
- 15.Hynynen K. The threshold for thermally significant cavitation in dog’s thigh muscle in vivo. Ultrasound Med Biol. 1991;17:157–169. doi: 10.1016/0301-5629(91)90123-e. [DOI] [PubMed] [Google Scholar]
- 16.Clarke PR, Hill CR. Physical and chemical aspects of ultrasonic disruption of cells. J Acoust Soc Am. 1970;47:649–653. doi: 10.1121/1.1911940. [DOI] [PubMed] [Google Scholar]
- 17.Miller DL, Thomas RM. Ultrasonic gas body activation in elodea leaves and the mechanical index. Ultrasound Med Biol. 1993;19:343–351. doi: 10.1016/0301-5629(93)90106-x. [DOI] [PubMed] [Google Scholar]
- 18.Prise KM, Davies S, Michael BD. Cell killing and DNA damage in Chinese hamster V79 cells treated with hydrogen peroxide. Int J Radiat Biol. 1989;55:583–592. doi: 10.1080/09553008914550631. [DOI] [PubMed] [Google Scholar]
- 19.Brayman AA, Strickler PL, Luan H, et al. Hemolysis of 40% hematocrit, Albunex-suplemented human erythrocytes by pulsed ultrasound: frequency, acoustic pressure and pulse length dependence. Ultrasound Med Biol. 1997;23:1237–1250. doi: 10.1016/s0301-5629(97)00126-9. [DOI] [PubMed] [Google Scholar]
- 20.Deng CX, Xu Q, Apfel RE, Holland CK. In vitro measurements of inertial cavitation thresholds in human blood. Ultrasound Med Biol. 1996;22:939–948. doi: 10.1016/0301-5629(96)00104-4. [DOI] [PubMed] [Google Scholar]
- 21.Miller DL, Gies RA, Chrisler WB. Ultrasonically induced hemolysis at high cell and gas body concentrations in a thin-disc exposure chamber. Ultrasound Med Biol. 1997;23:625–633. doi: 10.1016/s0301-5629(97)00042-2. [DOI] [PubMed] [Google Scholar]
- 22.Miller DL, Thomas RM. Contrast-agent gas bodies enhance hemolysis induced by lithotripter shock waves and high-intensity focused ultrasound in whole blood. Ultrasound Med Biol. 1996;22:1089–1095. doi: 10.1016/s0301-5629(96)00126-3. [DOI] [PubMed] [Google Scholar]
- 23.Forbes MM, Steinberg RL, O’Brien WD., Jr Examination of inertial cavitation of Optison in producing sonoporation of Chinese hamster ovary cells. Ultrasound Med Biol. 2008;34:2009–2018. doi: 10.1016/j.ultrasmedbio.2008.05.003. [DOI] [PMC free article] [PubMed] [Google Scholar]
- 24.Brujan E, Nahen K, Schmidt P, Vogel A. Dynamics of laser-induced cavitation bubbles near elastic boundaries: influence of the elastic modulus. J Fluid Mech. 2001;433:293–314. [Google Scholar]
- 25.Prosperetti A. A new mechanism for sonoluminescence. J Acoust Soc Am. 1997;101:2003–2007. [Google Scholar]
- 26.Él’Piner IY, Faikin IM, Basurmanova OK. Intracellular microflow produced by ultrasonic radiation. Biophysics. 1965;10:889–897. [Google Scholar]
- 27.Hughes DE, Nyborg WL. Cell disruption by ultrasound: streaming and other activity around sonically induced bubbles is a cause of damage to living cells. Science. 1962;138:108–114. doi: 10.1126/science.138.3537.108. [DOI] [PubMed] [Google Scholar]
- 28.Wu J, Ross JP, Chiu J. Reparable sonoporation generated by microstreaming. J Acoust Soc Am. 2002;111:1460–1464. doi: 10.1121/1.1420389. [DOI] [PubMed] [Google Scholar]
- 29.Williams AR. Disorganization and disruption of mammalian and amoeboid cells by acoustic microstreaming. J Acoust Soc Am. 1971;51:688–693. [Google Scholar]
- 30.Rooney JA. Hemolysis near an ultrasonically pulsating gas bubble. Science. 1970;169:869–871. doi: 10.1126/science.169.3948.869. [DOI] [PubMed] [Google Scholar]
- 31.Marmottant P, Hilgenfeldt S. Controlled vesicle deformation and lysis by single oscillating bubbles. Nature. 2003;423:153–156. doi: 10.1038/nature01613. [DOI] [PubMed] [Google Scholar]
- 32.Rooney JA. Shear as a mechanism for sonically induced biological effects. J Acoust Soc Am. 1972;52:1718–1724. doi: 10.1121/1.1913306. [DOI] [PubMed] [Google Scholar]
- 33.van Wamel A, Kooiman K, Harteveld M, et al. Vibrating microbubbles poking individual cells: drug transfer into cells via sonoporation. J Control Release. 2006;112:149–155. doi: 10.1016/j.jconrel.2006.02.007. [DOI] [PubMed] [Google Scholar]
- 34.Raum K, O’Brien WD., Jr Pulse-echo field distribution measurements technique for high-frequency ultrasound sources. IEEE Trans Ultrason Ferroelectr Freq Control. 1997;44:810–815. [Google Scholar]
- 35.Preston RC, Bacon DR, Livett AJ, Rajendran K. PVDF membrane hydrophone performance properties and their relevance to the measurement of the acoustic output of medical ultrasound equipment. J Phys E Sci Instrum. 1983;16:786–796. [Google Scholar]
- 36.Zachary JF, Sepsrott JM, Frizzell LA, Simpson DG, O’Brien WD., Jr Superthreshold behavior and threshold estimation of ultrasound-induced lung hemorrhage in adult mice and rats. IEEE Trans Ultrason Ferroelectr Freq Control. 2001;48:581–592. doi: 10.1109/58.911741. [DOI] [PubMed] [Google Scholar]
- 37.Haak A, O’Brien WD., Jr Automatic detection of microbubble ultrasound contrast agent destruction applied to Definity. Paper presented at International Congress on Ultrasound; Vienna, Austria. 2007. [Google Scholar]
- 38.Coakley WT, Nyborg WL. Cavitation; dynamics of gas bubbles; applications. In: Fry FJ, editor. Ultrasound: Its Applications in Medicine and Biology. Amsterdam, the Netherlands: Elsevier Scientific Publishing Co; 1978. pp. 77–159. [Google Scholar]
- 39.Madanshetty SI, Roy RA, Apfel RE. Acoustic microcavitation: its active and passive acoustic detection. J Acoust Soc Am. 1991;90:1515–1526. doi: 10.1121/1.401891. [DOI] [PubMed] [Google Scholar]
- 40.Hallow DM, Mahajan AD, McCutchen TE, Prausnitz MR. Measurement and correlation of acoustic cavitation with cellular bioeffects. Ultrasound Med Biol. 2006;32:1111–1122. doi: 10.1016/j.ultrasmedbio.2006.03.008. [DOI] [PubMed] [Google Scholar]
- 41.Kamaev PP, Hutcheson JD, Wilson ML, Prausnitz MR. Quantification of Optison bubble size and lifetime during sonication: dominant role of secondary cavitation bubbles causing acoustic bioeffects. J Acoust Soc Am. 2004;115:1818–1825. doi: 10.1121/1.1624073. [DOI] [PubMed] [Google Scholar]


