

Fluorescence labeling of proteins enables the visualization of dynamic cellular processes. Labeling is most often accomplished by fusing the protein of interest to a fluorescent protein, such as green fluorescent protein (GFP),[1] or to a short peptide tag that directs attachment of a small-molecule fluorescent probe.[2] These methods are ideal for the study of preselected proteins. However, because these proteins require genetic manipulation, they are not well suited to studies of global cellular processes, such as protein synthesis or post-translational modification.
Strategies have been developed to enable tagging of proteins with ketone,[3] azide,[4, 5] or alkyne[6] functional groups in complex biological mixtures. Glycosylated,[7] phosphorylated,[8] farnesylated,[9] and fatty-acylated[10] proteins have been isolated after the incorporation of reactive analogues. These post-translational modifications are regulated dynamically, and metabolic tagging has enabled proteome-level analyses that were not accessible by genetic manipulation.
Similarly, reactive amino acid analogues can be incorporated into proteins on a proteome-wide basis; this enables selective modification of newly synthesized proteins.[11] The methionine (Met) analogues azidohomoalanine (Aha) and homopropargylglycine (Hpg) have been used to visualize and identify temporally defined subsets of the proteome.[12] Proteins containing Aha or Hpg can be labeled with fluorophores or affinity reagents by efficient and selective copper-catalyzed azide–alkyne ligation.[13] While this reaction has been used successfully to label purified proteins, complex cellular extracts, and fixed cells, the toxicity of copper raises concerns about the use of this method to label live cells.[14, 15] The Staudinger ligation[5, 16] and the strain-promoted, copper-free azide–alkyne cycloaddition[14, 17–21] provide excellent alternatives for live-cell labeling. Here, we describe the use of the copper-free azide–alkyne cycloaddition to label newly synthesized proteins in live cells with a set of cell-permeable coumarin–cyclooctyne conjugates.
The tagging of azide-containing glycans with cyclooctyne conjugates has been explored previously,[14] and it has been shown that the reactivity of the cyclooctyne can be raised by the use of dibenzocyclooctynes[20] or by fluorination adjacent to the alkyne.[17, 19,21] Activated cyclooctynes have enabled rapid and sensitive labeling of cell-surface azides for dynamic cell imaging. These “next-generation” probes have been used to monitor glycan trafficking in live cells[17] and zebrafish embryos.[22] In all previous reports, the fluorinated cyclooctyne probes were membrane impermeable due to the charged nature of the appended fluorophores; this necessarily limits the labeling reaction to cell-surface-exposed azides.
We anticipated that conjugation of coumarin, a small, membrane-permeable fluorophore, to a variety of cyclooctyne moieties would yield a set of molecules that could both enter live cells and ligate to azides displayed on proteins. Commercially available dimethylaminocoumarin (DMAC) was conjugated to various cyclooctyne acids by a short linker segment by using standard coupling chemistry to give coumarin–cyclooctyne conjugates 1–3. The linker segment was included to improve the solubility of the dye and to increase the distance between the dye and its protein target, which might enhance the fluorescence signal.[23] Each of the three probes was submitted for Caco-2 permeability analysis; the Caco-2 assay is typically used to predict the permeability and bioavailability of small molecules across the epithelium of the small intestine.[24] The results of this assay confirmed that conjugates 1–3 all cross Caco-2 cell monolayers, consistent with their expected membrane permeability (see Table S1 in the Supporting Information).

Coumarin cyclooctynes 1–3 were assessed for their ability to label newly synthesized proteins in a mammalian Rat-1 fibro-blast line by using confocal fluorescence microscopy (Figure 1). Cells were treated for 4 h with 1 m M Aha, Met, or Aha that had been pretreated with the protein synthesis inhibitor anisomycin ([Aha +aniso]). The [Aha +aniso] control was included as a means to assess the contribution of free Aha to the fluorescence signal. After the 4 h pulse, cells were washed and incubated with one of the coumarin conjugates for 10 min at 37 °C. Following incubation, the cells were washed again and treated with MitoTracker Red, a membrane-permeable dye that localizes to functional mitochondria. This counterstain aids in delineating individual cells, distinguishing the cytoplasmic space from the nucleus, and assessing mitochondrial morphology as a measure of cell health. After counterstaining, cells were washed a final time and examined by confocal microscopy, which enabled the acquisition of three-dimensional images of intracellular labeling in live cells.[25]Substantial labeling of cells was observed after 10 min of treatment with conjugates 1–3. The fluorescence of cells treated with Aha alone was much brighter than that of cells treated with either Met or [Aha +aniso]; this indicates that the observed labeling is specific to Aha, and that most of the coumarin-labeled Aha is associated with proteins that are generated during the Aha pulse. Examination of individual confocal slices and fractionation of cellular proteins confirms that labeling occurs throughout the cell, and is not confined to the cell membrane (Figures S1–S3 and Tables S2 and S3). We observed more-uniform staining of cells labeled with 3 compared to 1 or 2, and 3 also showed higher levels of azide-independent staining.
Figure 1.

Confocal fluorescence imaging of Rat-1 fibroblasts grown for 4 h in medium containing 1 mm Met (first column), 1 m M Aha pretreated with the protein synthesis inhibitor anisomycin (aniso; second column), or 1 m M Aha (last two columns). After the Aha pulse, cells were dye-labeled for 10 min with 50 μM 1 (row 1), 50 μM 2 (row 2), or 10 μM 3 (row 3). Cells were counterstained with MitoTracker Red before imaging. The images for each dye (1, 2, or 3) were acquired under identical conditions to capture either coumarin or MitoTracker Red fluorescence [fourth column, Mito(Aha)]. The scale bar represents 20 μm. Projection images and individual slices from each stack are available in the Supporting Information (Figures S1 and S2).
We used flow cytometry to evaluate conditions for the labeling of newly synthesized proteins as a function of dye concentration, amino acid pulse length, and fluorophore-labeling time. Cells were pulse-labeled for 4 h with Aha or Met before treatment with each of the conjugates 1–3 for 10 min at concentrations of 0.5–50 μM (Figure 2). The mean coumarin fluorescence increased with increasing dye concentration for all three dyes. The fluorescence enhancement, which is defined as the mean fluorescence for Aha-treated cells divided by the mean fluorescence for Met-treated cells, increased with increasing concentration of 1 and 2. In contrast, the optimal enhancement for cells treated with 3 was not at the highest dye concentration, but rather at 10 μM 3. We believe that the higher background labeling for cells treated with 3 could be attributed to side reactions with cellular nucleophiles (vide infra).
Figure 2.

Flow cytometric analysis of coumarin fluorescence as a function of dye concentration for cells pulse-labeled for 4 h with Aha or Met. A) Mean fluorescence enhancement for cells dye-labeled for 10 min (1 gray bars, 2 hashed bars, and 3 black bars). B) Mean fluorescence values for cells dye-labeled for 10 min with either 10 or 50 μM of each dye. For each sample, 20 000 events were collected.
The optimal pulse length for the reactive amino acids prior to exposure to coumarin cyclooctynes was determined by examining four time intervals (15 min, 30 min, 1 h, and 4 h; Figure S4). Longer pulses (1 and 4 h) with Aha gave the largest enhancements, but significant labeling could be achieved with shorter pulse lengths. Aha pulses of 30 min gave a fourfold enhancement in mean fluorescence for 50 μM 2 or a twofold enhancement with 10 μM 3. More modest enhancements (1.3-to 1.5-fold) were observed after a 15 min Aha pulse and treatment with 10 μM 3. Improved conditions for the use of short pulse lengths might be revealed through further adjustments to the system, and considering factors such as local application of the reactive amino acid, increasing the concentration of amino acid, or utilizing different cell lines.
We used an amino acid pulse length of 4 h and a dye concentration of 10 μM to examine the effect of dye-labeling time on the system (Figure S4). Cells were examined after exposure to each dye for periods of 6, 10, 30, or 60 min. After 10 min of dye labeling, cells expressing proteins containing Aha showed enhancements in fluorescence. Modest labeling was also observed at 6 min, which is the shortest labeling time examined. Labeling for as long as 60 min yielded further increases in mean fluorescence for samples stained with 1 and 2, but non-specific labeling with 3 became more substantial. For 1 and 2, short labeling times can be combined with increased dye concentration (50 μM) to achieve higher fluorescence enhancements (data not shown).
The extent of labeling under optimized conditions for each of the three dyes was quantified by flow cytometry. After a 4 h Aha pulse, cells were dye-labeled for 10 min with 10 μM 3 or 50 μM 1 or 2 (Figure 3). Cells treated with Aha and labeled with 10 μM 3 displayed a mean fluorescence tenfold higher than that of control cells treated with Met. Cells treated with 50 μM 1 or 2 gave enhancements of 15- and 20-fold, respectively. Exposure to anisomycin prior to pulse-labeling with Aha reduced the fluorescence to levels comparable to those observed for cells treated with Met.
Figure 3.
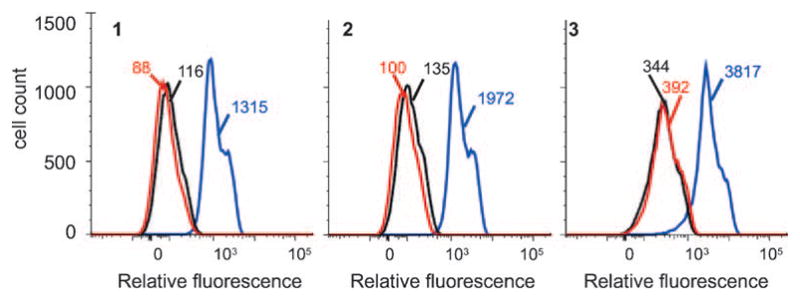
Histograms of coumarin fluorescence from flow cytometry. Cells were pulsed for 4 h in media supplemented with 1 m M Met (red), 1 m M Aha +anisomycin (aniso; black), or 1 m M Aha (blue). After the pulse, cells were dye-labeled for 10 min with 50 μM 1, 50 μM 2, or 10 μM 3. Values given indicate the mean fluorescence for each population of cells.
To explore the origin of the elevated background labeling observed for cells treated with 3, we used HPLC to characterize in vitro the reactions of 1–3 with Aha, Met, and Cys (a model cellular nucleophile, see the Supporting Information). Both 1 and 3 were stable in phosphate buffered saline (PBS) for 24 h, however, as previously observed, conjugate 2 showed evidence of defluorination in PBS over a period of 24 h,[19] The extent of defluorination of 2 under the conditions used for labeling of cellular proteins is insignificant (data not shown). All three dyes reacted with Aha, but only 3 showed evidence of reactivity toward Cys, reacting at a rate comparable to that observed with Aha (Figure S5). No product was observed for reactions of 3 with Met after 24 h. We used tandem mass spectrometry (TMS) to analyze the products of reaction of 3 with cysteine and with glutathione, a ubiquitous cellular nucleophile. Glutathione is a thiol-containing tripeptide found in cells at low millimolar concentrations (1–8 mM).[26] TMS analysis revealed products that are consistent with thiol addition to the strained alkyne of 3 (Figure S6). Although the high reactivity of 3 offers the prospect of sensitive labeling of cellular targets, care must be exercised in the use of this reagent.
In order to gain useful biological information, it is important to minimize the extent to which a labeling method perturbs cell viability. Three distinct methods confirmed that treatment of cells with 1–3 and subsequent imaging did not compromise viability. First, MitoTracker Red was used to stain active mitochondria and to ensure that mitochondrial morphology was normal during imaging. Second, cells were counterstained with propidium iodide to confirm that membranes remained intact after labeling with the coumarin-cyclooctynes (Figure S7). Finally, phase-contrast microscopy was used to verify that cells divided and remained well spread after imaging experiments (data not shown).
In summary, we have prepared a new class of reactive dyes capable of labeling azide-tagged proteins in living cells. After brief exposure to 1–3, cells that are pulse-labeled with Aha were characterized by substantial enhancements in fluorescence relative to cells treated with Met. The optimal conditions described here resulted in mean fluorescence enhancements of eightfold or higher. We believe that this labeling method can be used to visualize other intracellular biomolecules, thereby providing a useful tool for imaging dynamic protein modifications previously inaccessible to researchers.
Supplementary Material
Acknowledgments
We thank Rebecca E. Connor, Julie C. Liu, Marissa L. Mock, Tae Hyeon Yoo, Jay A. Codelli, and Brian C. Dickinson for advice and assistance. We thank Scott E. Fraser, Chris Waters, and the Biological Imaging Center of the Beckman Institute at Cal-tech for advice on microscopy, Mona Shahgholi for assistance with mass spectrometry, and Rochelle Diamond and Diana Perez for assistance with flow cytometry. We thank Mandy K. S. Vink for Aha and Stacey A. Maskarinec for cell lines. This work was supported by NIH grant GM62523 to D.A.T. and GM66047 to C.R.B., by the ARO Institute for Collaborative Biotechnologies, by a Hertz Foundation Fellowship and PEO Scholar Award to K.E.B., by NIH postdoctoral fellowships to J.D.F. and B.P.S., an NSF and NDSEG fellowship to J.M.B., and an NDSEG fellowship to M.J.H.
Footnotes
Supporting information for this article is available on the WWW under http://dx.doi.org/10.1002/cbic.201000419.
References
- 1.a) Tsien RY. Annu Rev Biochem. 1998;67:509. doi: 10.1146/annurev.biochem.67.1.509. [DOI] [PubMed] [Google Scholar]; b) Shaner NC, Steinbach PA, Tsien RY. Nat Methods. 2005;2:905. doi: 10.1038/nmeth819. [DOI] [PubMed] [Google Scholar]
- 2.a) Chen I, Ting AY. Curr Opin Biotechnol. 2005;16:35. doi: 10.1016/j.copbio.2004.12.003. [DOI] [PubMed] [Google Scholar]; b) Foley TL, Burkart MD. Curr Opin Chem Biol. 2007;11:12. doi: 10.1016/j.cbpa.2006.11.036. [DOI] [PubMed] [Google Scholar]; c) Prescher JA, Bertozzi CR. Nat Chem Biol. 2005;1:13. doi: 10.1038/nchembio0605-13. [DOI] [PubMed] [Google Scholar]; d) Johnsson N, Johnsson K. ACS Chem Biol. 2007;2:31. doi: 10.1021/cb6003977. [DOI] [PubMed] [Google Scholar]
- 3.a) Lemieux GA, Bertozzi CR. Trends Biotechnol. 1998;16:506. doi: 10.1016/s0167-7799(98)01230-x. [DOI] [PubMed] [Google Scholar]; b) Rodriguez EC, Marcaurelle LA, Bertozzi CR. J Org Chem. 1998;63:7134. doi: 10.1021/jo981351n. [DOI] [PubMed] [Google Scholar]; c) Datta D, Wang P, Carrico IS, Mayo SL, Tirrell DA. J Am Chem Soc. 2002;124:5652. doi: 10.1021/ja0177096. [DOI] [PubMed] [Google Scholar]; d) Wang L, Zhang ZW, Brock A, Schultz PG. Proc Natl Acad Sci USA. 2003;100:56. doi: 10.1073/pnas.0234824100. [DOI] [PMC free article] [PubMed] [Google Scholar]
- 4.a) Kiick KL, Saxon E, Tirrell DA, Bertozzi CR. Proc Natl Acad Sci USA. 2002;99:19. doi: 10.1073/pnas.012583299. [DOI] [PMC free article] [PubMed] [Google Scholar]; b) Chin JW, Santoro SW, Martin AB, King DS, Wang L, Schultz PG. J Am Chem Soc. 2002;124:9026. doi: 10.1021/ja027007w. [DOI] [PubMed] [Google Scholar]; c) Speers AE, Cravatt BF. Chem Biol. 2004;11:535. doi: 10.1016/j.chembiol.2004.03.012. [DOI] [PubMed] [Google Scholar]
- 5.Saxon E, Bertozzi CR. Science. 2000;287:2007. doi: 10.1126/science.287.5460.2007. [DOI] [PubMed] [Google Scholar]
- 6.a) Kiick KL, Weberskirch R, Tirrell DA. FEBS Lett. 2001;502:25. doi: 10.1016/s0014-5793(01)02657-6. [DOI] [PubMed] [Google Scholar]; b) van Hest JCM, Kiick KL, Tirrell DA. J Am Chem Soc. 2000;122:1282. [PubMed] [Google Scholar]; c) Deiters A, Schultz PG. Bioorg Med Chem Lett. 2005;15:1521. doi: 10.1016/j.bmcl.2004.12.065. [DOI] [PubMed] [Google Scholar]
- 7.a) Khidekel N, Ficarro SB, Clark PM, Bryan MC, Swaney DL, Rexach JE, Sun YE, Coon JJ, Peters EC, Hsieh-Wilson LC. Nat Chem Biol. 2007;3:339. doi: 10.1038/nchembio881. [DOI] [PubMed] [Google Scholar]; b) Khidekel N, Ficarro SB, Peters EC, Hsieh-Wilson LC. Proc Natl Acad Sci USA. 2004;101:13132. doi: 10.1073/pnas.0403471101. [DOI] [PMC free article] [PubMed] [Google Scholar]; c) Dube DH, Prescher JA, Quang CN, Bertozzi CR. Proc Natl Acad Sci USA. 2006;103:4819. doi: 10.1073/pnas.0506855103. [DOI] [PMC free article] [PubMed] [Google Scholar]
- 8.Green KD, Pflum MKH. J Am Chem Soc. 2007;129:10. doi: 10.1021/ja066828o. [DOI] [PubMed] [Google Scholar]
- 9.Kho Y, Kim SC, Jiang C, Barma D, Kwon SW, Cheng J, Jaunbergs J, Weinbaum C, Tamanoi F, Falck J, Zhao Y. Proc Natl Acad Sci USA. 2004;101:12479. doi: 10.1073/pnas.0403413101. [DOI] [PMC free article] [PubMed] [Google Scholar]
- 10.a) Hang HC, Geutjes EJ, Grotenbreg G, Pollington AM, Bijlmakers MJ, Ploegh HL. J Am Chem Soc. 2007;129:2744. doi: 10.1021/ja0685001. [DOI] [PubMed] [Google Scholar]; b) Martin DDO, Vilas GL, Prescher JA, Rajaiah G, Falck JR, Bertozzi CR, Berthiaume LG. FASEB J. 2008;22:797. doi: 10.1096/fj.07-9198com. [DOI] [PMC free article] [PubMed] [Google Scholar]
- 11.a) Beatty KE, Tirrell DA. In: Protein Engineering. Köhrer C, Rajbhandary UL, editors. Vol. 22. Springer; Berlin: 2009. [Google Scholar]; b) Hohsaka T, Sisido M. Curr Opin Chem Biol. 2002;6:809. doi: 10.1016/s1367-5931(02)00376-9. [DOI] [PubMed] [Google Scholar]; c) Hendrickson TL, de Crecy-Lagard V, Schimmel P. Annu Rev Biochem. 2004;73:147. doi: 10.1146/annurev.biochem.73.012803.092429. [DOI] [PubMed] [Google Scholar]; d) Budisa N. Angew Chem. 2004;116:6586. doi: 10.1002/anie.200300646. [DOI] [PubMed] [Google Scholar]; Angew Chem Int Ed. 2004;43:6426. [Google Scholar]
- 12.a) Dieterich DC, Link AJ, Graumann J, Tirrell DA, Schuman EM. Proc Natl Acad Sci USA. 2006;103:9482. doi: 10.1073/pnas.0601637103. [DOI] [PMC free article] [PubMed] [Google Scholar]; b) Beatty KE, Liu JC, Xie F, Dieterich DC, Schuman EM, Wang Q, Tirrell DA. Angew Chem. 2006;118:7524. doi: 10.1002/anie.200602114. [DOI] [PubMed] [Google Scholar]; Angew Chem Int Ed. 2006;45:7364. [Google Scholar]; c) Beatty KE, Tirrell DA. Bioorg Med Chem Lett. 2008;18:5995. doi: 10.1016/j.bmcl.2008.08.046. [DOI] [PMC free article] [PubMed] [Google Scholar]
- 13.a) Rostovtsev VV, Green LG, Fokin VV, Sharpless KB. Angew Chem. 2002;114:2708. doi: 10.1002/1521-3773(20020715)41:14<2596::AID-ANIE2596>3.0.CO;2-4. [DOI] [PubMed] [Google Scholar]; Angew Chem Int Ed. 2002;41:2596. [Google Scholar]; b) Tornøe CW, Christensen C, Meldal M. J Org Chem. 2002;67:3057. doi: 10.1021/jo011148j. [DOI] [PubMed] [Google Scholar]
- 14.Agard NJ, Prescher JA, Bertozzi CR. J Am Chem Soc. 2004;126:15046. doi: 10.1021/ja044996f. [DOI] [PubMed] [Google Scholar]
- 15.Link AJ, Tirrell DA. J Am Chem Soc. 2003;125:11164. doi: 10.1021/ja036765z. [DOI] [PubMed] [Google Scholar]
- 16.Köhn M, Breinbauer R. Angew Chem. 2004;116:3168. doi: 10.1002/anie.200401744. [DOI] [PubMed] [Google Scholar]; Angew Chem Int Ed. 2004;43:3106. [Google Scholar]
- 17.Baskin JM, Prescher JA, Laughlin ST, Agard NJ, Chang PV, Miller IA, Lo A, Codelli JA, Bertozzi CR. Proc Natl Acad Sci USA. 2007;104:16793. doi: 10.1073/pnas.0707090104. [DOI] [PMC free article] [PubMed] [Google Scholar]
- 18.a) Link AJ, Vink MKS, Agard NJ, Prescher JA, Bertozzi CR, Tirrell DA. Proc Natl Acad Sci USA. 2006;103:10180. doi: 10.1073/pnas.0601167103. [DOI] [PMC free article] [PubMed] [Google Scholar]; b) Sletten EM, Bertozzi CR. Org Lett. 2008;10:3097. doi: 10.1021/ol801141k. [DOI] [PMC free article] [PubMed] [Google Scholar]; c) Neef AB, Schultz C. Angew Chem. 2009;121:1526. doi: 10.1002/anie.200805507. [DOI] [PubMed] [Google Scholar]; Angew Chem Int Ed. 2009;48:1498. [Google Scholar]
- 19.Agard NJ, Baskin JM, Prescher JA, Lo A, Bertozzi CR. ACS Chem Biol. 2006;1:644. doi: 10.1021/cb6003228. [DOI] [PubMed] [Google Scholar]
- 20.a) Ning X, Guo J, Wolfert MA, Boons GJ. Angew Chem. 2008;120:2285 – 2287. doi: 10.1002/anie.200705456. [DOI] [PMC free article] [PubMed] [Google Scholar]; Angew Chem Int Ed. 2008;47:2253–2255. doi: 10.1002/anie.200705456. [DOI] [PMC free article] [PubMed] [Google Scholar]; b) Debets MF, van Berkel SS, Schoffelen S, Rutjes FPJT, van Hest JCM, van Delft FL. Chem Commun. 2010;46:97. doi: 10.1039/b917797c. [DOI] [PubMed] [Google Scholar]; c) Jewett JC, Sletten EM. J Am Chem Soc. 2010;132:3688. doi: 10.1021/ja100014q. [DOI] [PMC free article] [PubMed] [Google Scholar]
- 21.Codelli JA, Baskin JM, Agard NJ, Bertozzi CR. J Am Chem Soc. 2008;130:11486. doi: 10.1021/ja803086r. [DOI] [PMC free article] [PubMed] [Google Scholar]
- 22.Laughlin ST, Baskin JM, Amacher SL, Bertozzi CR. Science. 2008;320:664. doi: 10.1126/science.1155106. [DOI] [PMC free article] [PubMed] [Google Scholar]
- 23.Hermanson GT. Bioconjugate Techniques. Academic Press; San Diego: 1996. [Google Scholar]
- 24.Stenberg P, Norinder U, Luthman K, Arturrson P. J Med Chem. 2001;44:1927. doi: 10.1021/jm001101a. [DOI] [PubMed] [Google Scholar]
- 25.Individual slices and projections are included in the Supporting Information.
- 26.Griffith OW. Free Radical Biol Med. 1999;27:922. doi: 10.1016/s0891-5849(99)00176-8. [DOI] [PubMed] [Google Scholar]
Associated Data
This section collects any data citations, data availability statements, or supplementary materials included in this article.