

Abstract
Recently, we have shown that down-regulation of methylthioadenosine phosphorylase (MTAP) in hepatocellular carcinoma (HCC) cells enhances the invasive potential and the resistance against cytokines. Here, we aimed at investigating the molecular mechanism underlying this tumor-promoting effect and expanded the analysis to a large series of human HCC tissues. Liquid chromatography tandem mass spectrometry revealed that reduced MTAP expression resulted in higher intra- and extracellular concentrations of 5′-deoxy-5′-methylthioadenosine (MTA) in cultivated HCC cells and, concordantly, higher levels of MTA in HCC tissue. MTA induced matrix metalloproteinase (MMP) and interleukin-8 transcription in HCC cells in vitro, accompanied by enhanced proliferation and activation of the transcription factor NFκB. In addition, MTA secreted by HCC cells induced expression of fibroblast growth factor-2 and MMP1 in stromal myofibroblasts. In human HCC tissues, MTAP mRNA correlated inversely with MTA levels, and immunohistochemical analysis of a tissue microarray of 140 human HCCs revealed that low MTAP protein expression correlated with advanced tumor stages. In conclusion, MTAP deficiency results in accumulation of MTA, which is associated with increased tumorigenicity. These data further indicate MTAP as a tumor suppressor in HCC, and MTA as a potential biomarker for HCC progression.
Hepatocellular carcinoma (HCC) currently ranks as the third most common cause of cancer-related death worldwide.1 Given its increasing prevalence and poor prognosis, HCC constitutes a major health care problem.2–4 The etiology of HCC is well studied; the most important risk factors for HCC development are chronic hepatitis B and C infections as well as alcohol abuse accompanied by liver cirrhosis.5 However, the molecular pathogenesis of HCC is less well understood. Studies have described genomic aberrations in HCC,6 but their significance and precise role in disease progression awaits elucidation.7 Nevertheless, the identification of genes, whose altered expression is associated with clinicopathological features of HCC, is a promising endeavor that has already refined the diagnosis and prognostic predictions of HCC patients.8
Recently, we have described the down-regulation of the rate-limiting enzyme in the methionine and adenine salvage pathways, methylthioadenosine phosphorylase (MTAP; MIM 156540), in HCC.9 MTAP catalyzes the phosphorylation of 5′-deoxy-5′-methylthioadenosine (MTA), which is a by-product of polyamine synthesis, to yield adenine and methylthioribose-1-phosphate (MTR-1P). MTR-1P is then converted in a series of enzymatic reactions to regain methionine.10 Furthermore, MTAP regulates polyamine synthesis, as MTA is an inhibitor of several key enzymes in this pathway.11
Consequently, MTAP is expressed in a wide range of normal cells and tissues.12
In contrast, MTAP expression is lost in many cancer cells.13–16 We and others have demonstrated that promoter hypermethylation is responsible for incomplete loss of MTAP expression in HCC.9,17 However, as the MTAP gene is localized in the chromosome 9p21 region,12 which is frequently deleted in human malignancies, including HCC,18–20 other mechanisms such as genomic deletions may also affect MTAP expression in HCC.
In the present study, we assessed the clinicopathological significance of the down-regulation of MTAP in human HCC and examined the molecular mechanisms underlying the tumor-promoting effect of MTAP deficiency in HCC.
Materials and Methods
Cells and Cell Culture
The HCC cell lines HepG2 (ATCC HB-8065), PLC (ATCC CRL-8024), Hep3B (ATCC HB-8064), and HuH-7 (JCR B0403) were cultured as described previously.21
Primary human hepatocytes (PHH) and hepatic stellate cells (HSC) were isolated and cultured as described.22,23 In vitro activation of HSC was achieved by cell culture on uncoated tissue culture dishes as described.22,24
Human Tissues and HCC Tissue Microarray
Paired HCC and non-neoplastic liver tissues were obtained from HCC patients undergoing surgical resection. Tissue samples were immediately snap-frozen and stored at −80°C until subsequent analysis.
A tissue microarray (TMA) of paraffin-embedded HCC samples was constructed as described.21,25 Clinicopathological patient characteristics are summarized in Table 1.
Table 1.
MTAP Immunoreactivity in HCC Tissue of 140 Patients in Relation to Clinicopathological Characteristics
| MTAP IR |
||||||
|---|---|---|---|---|---|---|
| Variable | Categorization | n | % | Negative | Positive | P value⁎ |
| Age at diagnosis | ||||||
| <60 years | 52 | 37.1 | 17 | 35 | 0.157 | |
| ≥60 years | 88 | 62.9 | 40 | 48 | ||
| Sex | ||||||
| Female | 21 | 15.0 | 10 | 11 | 0.483 | |
| Male | 119 | 85.0 | 47 | 72 | ||
| Tumor stage | ||||||
| pT1 | 47 | 33.6 | 13 | 34 | 0.032 | |
| pT2 | 42 | 30.0 | 15 | 27 | ||
| pT3 | 46 | 32.9 | 25 | 21 | ||
| pT4 | 3 | 2.1 | 2 | 1 | ||
| nd | 2 | 1.4 | ||||
| Histological grade | ||||||
| G1 | 53 | 37.9 | 15 | 38 | 0.019 | |
| G2 | 70 | 50.0 | 31 | 39 | ||
| G3 | 17 | 12.1 | 11 | 6 | ||
| Tumor size | ||||||
| ≤5 cm | 70 | 50.0 | 23 | 47 | 0.339 | |
| >5 cm | 40 | 34.3 | 20 | 28 | ||
| nd | 30 | 15.7 | ||||
IR, immunoreactivity; nd, no data available.
Fisher's exact test (2-sided); boldface indicates P values ≤0.05.
Human liver tissue was obtained and experimental procedures were performed according to the guidelines of the charitable state-controlled foundation HTCR (Human Tissue and Cell Research), with the informed patient's consent.
MTA and S-Adenosylmethionine Extraction and Analysis by Liquid Chromatography–Electrospray Ionization–Tandem Mass Spectrometry
For analysis of MTA and S-adenosylmethionine (SAM) in cell culture medium, cells were cultured in serum-free medium for 24 hours. Subsequently, medium was collected, centrifuged, and the supernatant was snap-frozen and stored at −80°C. Further, cell number in corresponding cell culture plates was determined by counting the trypsinized cells.
For intracellular MTA and SAM measurements, cells were harvested by incubation in a solution containing 0.05% (w/v) trypsin and 0.02% (w/v) EDTA. Trypsinization was stopped after 5 minutes with cell culture medium. Following centrifugation, the supernatant was removed, the cell pellet was washed with PBS buffer, centrifuged again, snap-frozen, and stored at −80°C.
Samples were further processed as described.26,27 Briefly, cell culture medium was spiked with stable isotope–labeled standards, dried by means of an infrared evaporator, and the residues were reconstituted in 0.1 mol/L acetic acid. Frozen cell pellets were extracted by three repeated freeze/thaw cycles in 600 μl of MeOH/0.1 mol/L acetic acid (80:20, v/v) after the addition of stable isotope-labeled standards. After centrifugation, the supernatant was transferred into a glass vial, and the protein pellet was washed twice with MeOH/acetic acid. The combined extracts were dried and reconstituted in 0.1 mol/L acetic acid.
Tissue samples were weighed and then homogenized in 600 μl of MeOH/0.1 mol/L aqueous acetic acid (80:20, v/v) using Precelly-Keramik-Kit 1.4 mm vials (Peqlab Biotechnologie GmbH, Erlangen, Germany). The samples were centrifuged at 9000 × g for 5 minutes at 4°C. Subsequently, the supernatant was transferred to a 1.5-ml glass vial, and the pellet was washed twice. After solvent evaporation, the residues were reconstituted in 0.1 mol/L acetic acid.
Liquid chromatography–electrospray ionization–tandem mass spectrometry (LC-ESI-MS/MS) was performed as described.26 The analysis was performed using an Agilent 1200 SL HPLC system (Böblingen, Germany) and a PE Sciex API 4000 QTrap mass spectrometer (Applied Biosystems, Darmstadt, Germany). An Atlantis T3 3 μm (2.1-mm i.d. × 150 mm) reversed-phase column (Waters, Eschborn, Germany) was used. LC separation was carried out using a water-acetonitrile gradient consisting of 0.1% acetic acid and 0.025% HFBA in both solvents at a flow rate of 400 μl/minute with an injection volume of 10 μl. The API 4000 QTrap mass spectrometer was operated in positive mode, and quantitative determination was performed with multiple reaction monitoring.
Expression Analysis
Isolation of total cellular RNA from cultured cells and tissues and reverse transcription were performed as described previously.21 Quantitative real-time PCR was performed with specific sets of primers (Table 2) by means of LightCycler technology (Roche, Mannheim, Germany) as described.21 Analyses have been performed in duplicate or triplicate in at least two independent experimental sets.
Table 2.
Sets of Primers Used for Quantitative PCR Analysis
| Name | Forward primer | Reverse primer |
|---|---|---|
| β-actin | 5′-CTACGTCGCCCTGGACTTCGAGC-3′ | 5′-GATGGAGCCGCCGATCCACACGG-3′ |
| MTAP | 5′-GCGAACATCTGGGCTTTG-3′ | 5′-GCACCGGAGTCCTAGCTTC-3′ |
| IL8 | 5′-TCTGCAGCTCTGTGTGAAGGTGCAGTT-3′ | 5′-AACCCTCTGCACCCAGTTTTCCT-3′ |
| MMP-1 | 5′-TCACCAAGGTCTCTGAGGGTCAAGC-3′ | 5′-GGATGCCATCAATGTCATCCTGAGC-3′ |
| MMP-9 | 5′-GAGGTGCCGGATGCCATTCACGT-3′ | 5′-CCGAGCTGACTGGACGGTGATG-3′ |
| VEGFB | 5′-TGGTGGTGCCCTTGACTGTGGAGC-3′ | 5′-CTGTCTGGCTTCACAGCACTGTCC-3′ |
| FGF2 | 5′-AGCCTAGCAACTCTGCTGCTGATGG-3′ | 5′-ACGTAGGAGACACAGCGGTTCGAG-3′ |
| FGF 7 | 5′-GGCAATCAAAGGGGTGGA-3′ | 5′-CCTCCGTTGTGTGTCCATTTA-3′ |
| GLUT1 | 5′-AACTCTTCAGCCAGGGTCCAC-3′ | 5′-CACAGTGAAGATGATGAAGAC-3′ |
| HGF | 5′-CGAGACATAACATGGGCTCTCAACTG-3′ | 5′-GTAAATTCAGAAAAGCTGGGTAAGGGC-3′ |
| CYP 2A6 | 5′-AGGCTATGGCGTGGTATTC-3′ | 5′-CTCCGTGTTGGGGTTCTTC-3′ |
Protein Analysis
Protein extraction and Western blotting were performed as described21,25 using the monoclonal anti-MTAP antibody (Abcam, Cambridge, UK) at a dilution of 1:3000 for Western blotting and 1:500 for immunohistochemistry. Phosphorylated IκB-α was detected by Western blotting applying anti-phosphoserine RelA antibody (S536; Cell Signaling, Beverly, MA) as described.28
Immunohistochemical staining of 5-μm sections of the TMA blocks was performed using an anti-MTAP antibody and an indirect immunoperoxidase protocol according to the LSAB2-kit (Dako, Hamburg, Germany).21,25 For negative control, the primary antibody was omitted; IgG isotype control antibodies did not reveal any detectable staining. For analysis of the tissue microarray, positivity for MTAP was defined as any detectable staining, whereas cases designated as MTAP negative were devoid of any immunohistochemical staining for MTAP.
Quantification of Activated Nuclear NFκB Concentration
NFκB was quantified in nuclear extracts with the ELISA-based kit TransAm from Active Motif (Rixensart, Belgium) according to the manufacturer's instructions as described.28,29
Transient Transfection of HCC Cells with MTAP siRNA
Applying the HiPerFect method (Qiagen, Hilden, Germany), small interfering RNA (siRNA; Hs_MTAP_1-4 HP; all from Qiagen), was transiently transfected into HCC cells to deplete MTAP expression. Transfection efficiency was determined by fluorescence-activated cell sorter analysis applying Alexa Fluor 488–labeled control siRNA (AllStars Negative Control siRNA; Qiagen).
Proliferation Assay
Cell proliferation was measured using the XTT assay (Roche) as described.9,25 Briefly, based on standard dilution series, the number of cells was calculated in relation to the capacity to reduce the tetrazolium salt XTT. The analysis was performed on four consecutive days in control cells and cells incubated with various concentrations of MTA, and the doubling time of cells was calculated using GraphPad Prism Software (GraphPad Software, Inc., La Jolla, CA). Each experimental condition was performed in triplicate, and analyses were performed at least three times.
Statistical Analysis
Statistical analyses were performed using SPSS 15.0 (SPSS, Chicago, IL) and GraphPad Prism Software (GraphPad Software). Results are expressed as mean ± SE or as percentages. P values ≤0.05 were considered statistically significant. Comparisons between groups were made using one-way analysis of variance (with Bonferroni correction for multiple comparisons) or, in the case of comparisons between HCC/non-HCC pairs, the paired t-test. Fisher's exact test was used to study the statistical association between clinicopathological and immunohistochemical variables.
Results
MTA Concentrations in Human HCC Cell Lines and Tissues
We have previously shown that MTAP expression is strongly reduced in human HCC cell lines and tissues as compared to primary human hepatocytes and nontumorous tissue.9 Here, we analyzed whether this down-regulation of MTAP affected MTA levels in HCC. LC-ESI-MS/MS revealed significantly higher MTA levels in HCC as compared to nontumorous liver tissue (Figure 1A). Further, higher amounts of MTA were found in lysates of four different HCC cell lines as compared to PHH (Figure 1B). Levels of MTA were also higher in the corresponding supernatant of HCC cell cultures (Figure 1C). To confirm that MTA accumulation in HCC cells is caused by the down-regulation of MTAP, we analyzed HCC cells that had been transfected transiently with MTAP siRNA (Figure 1D). MTAP suppression led to higher MTA concentrations both in cell lysates (Figure 1E) and in supernatants (Figure 1F). Conversely, HCC cells overexpressing MTAP after stable transfection9 revealed lower MTA levels (Figure 1G).
Figure 1.

MTA concentration in human HCC cells and tissues. A: MTA levels in human HCC tissues (HCC) compared to adjacent nontumorous liver tissues (non-HCC). Fourteen paired samples were analyzed. MTA levels in cell lysates (B) and cell supernatants (C) of primary human hepatocytes (PHH) and the HCC cell lines PLC, HepG2, Hep3B, and Huh-7. Cells were cultured for 24 hours in FCS-free DMEM. D: MTAP mRNA (upper panel) and protein (Western blot, lower panel) expression in PLC cells, transiently transfected with negative control siRNA (si ctrl) or two different MTAP siRNAs (siMTAP1 and siMTAP2). The corresponding MTA levels in cell lysates (E) and supernatants (F) are depicted. G: MTA levels in cell lysates of PLC cell clones stably transfected with an MTAP expression plasmid (MTAP1 and MTAP2) and mock-transfected controls. *P ≤ 0.05 compared to non-HCC, PHH, si ctrl, or mock, respectively.
Effect of Altered MTAP Expression on HCC Cells
Next, we assessed the impact of altered MTAP levels on the expression of genes known to correlate with HCC progression and aggressiveness.30–34 Interestingly, suppression of MTAP expression by siRNA induced IL-8, MMP-1, and MMP-9 expression in HCC cells (Figure 2, A–C). On the other hand, PLC cell clones stably transfected with an MTAP expression plasmid9 revealed significantly lower IL8 (MIM 146930), MMP1 (MIM120353), and MMP9 (MIM 120361) mRNA levels than mock-transfected cell clones (Figure 2, D–F). In contrast, no regulation of glucose transporter 1 (GLUT1), vascular endothelial growth factor (VEGF; MIM 192240), and cytochrome P450 2A6 (CYP2A6) was observed (data not shown), which indicates that the effect of altered MTAP expression in HCC cells on the expression of IL-8 and MMPs is specific. ELISA technique confirmed increased IL-8 protein levels in the supernatant of HCC cells with suppressed MTAP expression and reduced IL-8 concentration in HCC cells with or increased MTAP expression, respectively (data not shown).
Figure 2.

Effect of altered MTAP expression on HCC cells. Analysis of IL-8 (A–D), MMP-1 (B, E), and MMP-9 (C, F) mRNA expression in (i) PLC cells transiently transfected with negative control siRNA (si ctrl) or two different MTAP siRNAs (siMTAP1 and siMTAP2) (A–C) or (ii) PLC cell clones stably transfected with an MTAP expression plasmid (MTAP1 and MTAP2) and mock-transfected controls (D–F). *P ≤ 0.05 compared to si ctrl or mock, respectively.
Effect of MTA on HCC Cells
Since the loss of MTAP expression in HCC cells leads to increased MTA levels, we next investigated the functional effect of MTA on the HCC cell lines HepG2 and PLC. HCC cells were treated with MTA dosages similar to those determined in HCC tissue. Incubation with MTA led to a dose-dependent induction of IL8, MMP1, and MMP9 gene expression in PLC cells (Figure 3, A–C). In contrast but in accordance with data obtained by alteration of MTAP gene expression, GLUT1, VEGF, and CYP2A6 gene expression were not affected (data not shown). However and interestingly, at a concentration of 5 μmol/L, MTA induced the proliferation of PLC cells (Figure 3D). Stimulation of HepG2 cells with MTA revealed similar results (data not shown).
Figure 3.
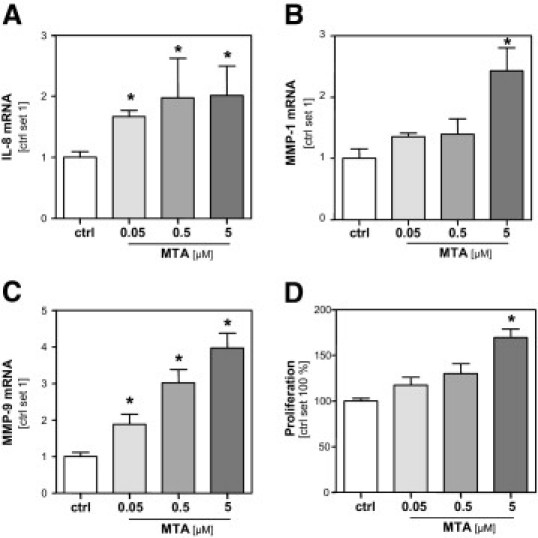
Effect of MTA on HCC cells. Analysis of (A) IL-8, (B) MMP-1, and (C) MMP-9 mRNA expression of PLC cells after treatment (24 hours) with MTA at different concentrations (0.05, 0.5, and 5 μmol/L) and untreated control cells (ctrl). D: Proliferation MTA stimulated PLC cells in relation to growth of untreated control cells (set 100%). *P ≤ 0.05 compared to ctrl.
Effect of MTA on Activated HSC
Since down-regulation of MTAP in HCC also led to higher extracellular MTA levels, we investigated whether MTA also exerted an effect on stromal cells. Here, we focused on activated hepatic stellate cells (HSC). These myofibroblast-like cells are located around tumor sinusoids and fibrous septa, and infiltrate the HCC stroma.35,36 It is known that they secrete several factors that affect HCC cells and HCC progression, respectively.29 Quantitative RT-PCR analysis revealed that incubation of HSC with 5 μmol/L MTA significantly induced the expression of the MMP1 (Figure 4A) and FGF2 (MIM 134920) genes (Figure 4B), whose expression levels had been found to correlate with HCC progression.32,33 In contrast, no regulation of hepatocyte growth factor (HGF) and fibroblast growth factor 7 (FGF7) expression was observed in MTA-stimulated HSC (data not shown).
Figure 4.
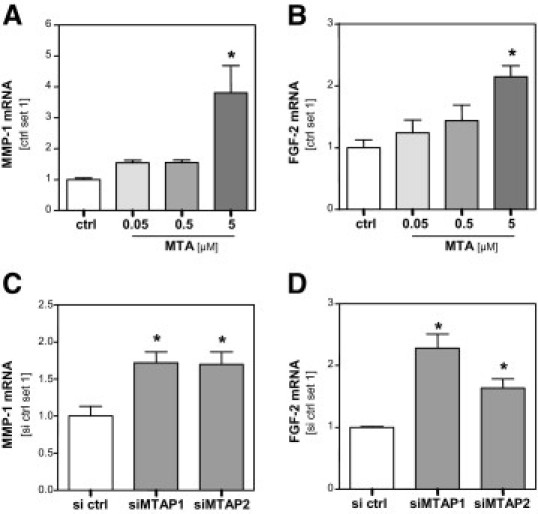
Effect of MTA on activated HSC. MMP1 (A) and FGF2 (B) mRNA expression in activated hepatic stellate cells (HSC) after treatment (24 hours) with MTA at different concentrations (0.05, 0.5, and 5 μmol/L) and untreated control cells (ctrl). MMP1 (C) and FGF2 (D) mRNA expression in HSC after stimulation (24 hours) with conditioned media derived from PLC cells in which MTAP expression was depleted by transfection with MTAP siRNA (siMTAP1 and siMTAP2) or from PLC cells transfected with control siRNA (si ctrl). *P ≤ 0.05 compared to ctrl or si ctrl, respectively.
In addition to MTA, HSC were incubated with conditioned media collected from HCC cells transiently transfected with MTAP-siRNA or control-siRNA, respectively (see Figure 1, D–F). Conditioned media from HCC cells with suppressed MTAP gene expression induced significantly higher MMP1 and FGF2 gene expression than conditioned media derived from HCC cells transfected with control-siRNA (Figure 4, C and D).
These findings indicate that down-regulation of MTAP and consequent elevation of intracellular and extracellular MTA levels are associated with augmented tumorigenesis of HCC cells and with increased expression of pro-cancerous genes in stromal cells.
Effect of MTA on NFκB Activation in HCC Cells
To get insight into the molecular mechanisms causing the tumorigenic effect of MTA on HCC cells, we analyzed NFκB activation, a major signaling pathway known to play an important role in hepatocancerogenesis. Notably, Western blot analysis revealed that stimulation with MTA induced lκB-α phosphorylation in HCC cells (Figure 5A). Next, we analyzed the concentration of activated NFκB in nuclear extracts in HCC cells stimulated with MTA and control cells using an ELISA-based technique. Here, a significantly higher NFκB activity was observed in MTA-stimulated HCC cells (Figure 5B). Together, these data indicate MTA induced NFκB as one potential mechanism of how loss of MTAP expression may contribute to HCC progression.
Figure 5.

Effect of MTA on NFκB activation and effect of diminished MTAP expression on S-adenosylmethionine levels in HCC cells. A: Effect of MTA treatment (0.5 and 5 μmol/L; 30 minutes) on IκB-α phosphorylation in PLC cells. Immunoreactive phospho-IkappBalpha (P-IκBα) was detected by Western blot analysis. Actin was analyzed on the same blot to demonstrate equal loading (bottom). B: Nuclear concentration of activated NFκB in MTA-treated (30 minutes) and control cells. S-adenosylmethionine (SAM) levels in cell lysates (C) and supernatants (D) of PLC cells, transiently transfected with negative control siRNA (si ctrl) or 2 different MTAP siRNAs (siMTAP1 and siMTAP2). *P ≤ 0.05 compared to ctrl.
In addition to MTA, diminished MTAP levels in HCC cells may affect other metabolites such as S-adenosyl-L-methionine, which is converted to MTA and which is also known to have an effect on NFκB activity in HCC cells.37 However, we did not observe an alteration of SAM levels in cellular extracts (Figure 5C) or in the supernatant (Figure 5D) of HCC cells transfected transiently with MTAP siRNA. These data indicate that protumorigenic effects of diminished MTAP expression in HCC cells are not related to altered SAM levels.
MTAP Expression in Human HCC Tissue
To further evaluate the functional effects of MTAP down-regulation in HCC in vivo, we analyzed MTAP protein expression in a series of 140 human HCC tissues, applying TMA technology. In 57 HCCs (40.7%), immunohistochemistry revealed no MTAP immunosignal. In contrast, MTAP expression was visible in all nontumorous tissue (data not shown), which confirms that in a considerable portion of human HCC, MTAP protein expression is significantly down-regulated or lost, respectively. For descriptive data analysis, HCC were separated into tissues with positive and negative MTAP immunosignal (representative examples are depicted in Figure 6A), and immunohistochemical results were correlated with clinicopathological tumor characteristics (Table 1). Loss of MTAP protein expression was significantly associated with higher tumor stage (P = 0.032) and tumor grading (P = 0.019). No correlation was found between MTAP expression and age, sex, or tumor size.
Figure 6.

MTAP expression in human HCC tissue. A: Representative MTAP immunohistochemical (IH) staining results of HCC tissue samples arranged on a tissue microarray (left panel: MTAP negative; right panel: MTAP positive). B: MTAP mRNA expression in 10 HCC tissues with negative and 15 HCC tissues with positive MTAP immunohistochemical staining (IH). *P ≤ 0.05 compared to MTAP IH negative. C: Correlation between MTA levels and MTAP mRNA expression in 19 human HCC tissue samples.
Matched data of mRNA expression and semiquantitative protein expression analyzed on the TMA were available from 25 HCC patients. MTAP mRNA expression was significantly higher in HCC cases with positive MTAP immunosignal (n = 15) compared to cases in which no MTAP expression had been detected (n = 10; Figure 6B). This finding indicates that MTAP mRNA expression correlated with protein expression detected by immunohistochemistry.
From HCCs on the TMA, no suitable tissue samples for MTA analysis were available. However, analysis of HCC specimens from another 19 patients revealed an inverse correlation between MTAP mRNA expression and MTA levels (r = −0.46; P = 0.047; Figure 6C). In line with in vitro effects of MTA and MTAP expression on HCC cells, IL-8 mRNA expression in HCC tissues correlated inversely with MTAP mRNA expression (r = −0.53; P = 0.029) and revealed a positive correlation with MTA levels (r = 0.54; P = 0.027). MMP1 and MMP9 mRNA expression revealed a similar trend; however, these associations did not reach statistical significance (data not shown).
In summary, these data indicate that in vivo down-regulation of MTAP expression results in increased MTA levels, which functionally affect HCC progression.
Discussion
In a previous study, we had shown that down-regulation of MTAP in HCC cell lines enhanced tumorigenicity in vitro. Due to the lack of a sensitive detection method, we had not been able to determine at that time the amounts of MTA in or secreted by HCC cells, and thus the molecular mechanism for the tumor-promoting effect of MTAP deficiency in HCC had remained unsolved. Here, we applied LC-ESI-MS/MS to measure MTA26 and found that intracellular as well as secreted MTA levels were higher in HCC cells than in PHH. Experimental inhibition or overexpression of MTAP expression in HCC cells caused inverse changes of MTA levels, clearly indicating that enhanced MTA levels in HCC were caused by down-regulation of MTAP.
Importantly, we found that MTA stimulation of HCC cells induced the expression of genes known to correlate with a more aggressive tumor growth32 and the induction of the transcription factor NFkappaB, which plays a critical role in HCC growth and progression.38–40
Moreover, effects of MTA were observed, not only in the tumor cells, but also in activated HSC that constitute an important cellular component of the tumor microenvironment. The MTA-mediated induction of MMP1 and FGF2 in HSC is of importance since these factors have been shown to be associated with invasive HCC growth.33
Most importantly, we could demonstrate the clinical relevance of MTAP down-regulation in HCC, which correlated with tumor staging and grading. Remarkably, in human HCC tissue also, MTAP expression correlated inversely with MTA levels.
Together, our in vitro and in vivo data indicate enhanced MTA levels as potential mechanisms of how loss of MTAP expression may contribute to HCC progression. Studies by others revealed that MTA exhibited an anti-inflammatory activity on macrophages and lymphocytes, thus further supporting a direct tumor-promoting effect of MTA.41–43 In contrast to our findings, some groups have reported proapoptotic effects of MTA on hepatoma cells, and inhibitory effects on proliferation and invasion of various cell lines as well as differentiation and growth factor receptor activation.44–49 However, in most of those studies, significantly higher, pharmacological doses had been administered, whereas the MTA levels achieved here mirrored endogenous tumor levels. In addition, the therapeutic effect of MTA seems to be dependent on the cell type and the MTAP level in the cells.50 Little is known about the molecular mechanisms of how diminished MTAP expression and increased MTA levels exert the described effects on cancer cells. Thus, uptake or recognition of MTA by a receptor in addition to induction of signaling pathways is largely undefined. With regard to this, it is interesting that exogenous MTA induced proliferation of HCC, although we did not observe altered cell proliferation in HCC cells on re-expression of MTAP by stable transfection in a previous study.9 Although manipulation of MTAP gene expression also changed extracellular MTA levels, kinetics of MTA alteration as well as absolute MTA levels in the supernatant, respectively, may not be directly comparable with exogenous MTA stimulation, and thus, dose-dependent effects may account for the seemingly controversial effects of MTA and MTAP induction on the proliferation of HCC cells. However, one may also speculate that (changes of) intracellular and extracellular MTA (levels) affect different signaling cascades. Further studies are required to completely unravel the complex mechanisms of how diminished MTAP expression affects (tumor) cells.
In conclusion, the present study demonstrates that the down-regulation of MTAP in HCC leads to increased MTA levels, which functionally affect cancerous cells and tumor stromal cells in a tumor-supportive way. Our work advances MTAP as a tumor suppressor in HCC, and MTA as potential biomarker for the progression of this highly aggressive tumor.
Acknowledgments
We thank Rudolph Jung and Marina Fink for excellent technical assistance.
Footnotes
Supported in part by grants from the German Cancer Aid and the German Research Foundation (A.K.B.), BayGene (P.O.), and the Medical Faculty of the University of Regensburg (ReForM) (P.O., A.K.B., T.S.W., and C.H.).
References
- 1.Shariff M.I.F., Cox I.J., Gomaa A.I., Khan S.A., Gedroyc W., Taylor-Robinson S.D. Hepatocellular carcinoma: current trends in worldwide epidemiology, risk factors, diagnosis and therapeutics. Expert Rev Gastroenterol Hepatol. 2009;3:353–367. doi: 10.1586/egh.09.35. [DOI] [PubMed] [Google Scholar]
- 2.Gomaa A.I., Khan S.A., Toledano M.B., Waked I., Taylor-Robinson S.D. Hepatocellular carcinoma: epidemiology, risk factors and pathogenesis. World J Gastroenterol. 2008;14:4300–4308. doi: 10.3748/wjg.14.4300. [DOI] [PMC free article] [PubMed] [Google Scholar]
- 3.Hussain K., El-Serag H.B. Epidemiology, screening, diagnosis and treatment of hepatocellular carcinoma. Minerva Gastroenterol Dietol. 2009;55:123–138. [PubMed] [Google Scholar]
- 4.Mendizabal M., Reddy K.R. Current management of hepatocellular carcinoma. Med Clin North Am. 2009;93:885–900. doi: 10.1016/j.mcna.2009.03.004. viii. [DOI] [PubMed] [Google Scholar]
- 5.Yu M.C., Yuan J.M. Environmental factors and risk for hepatocellular carcinoma. Gastroenterology. 2004;127:S72–S78. doi: 10.1016/j.gastro.2004.09.018. [DOI] [PubMed] [Google Scholar]
- 6.Lee J.S., Thorgeirsson S.S. Genetic profiling of human hepatocellular carcinoma. Semin Liver Dis. 2005;25:125–132. doi: 10.1055/s-2005-871192. [DOI] [PubMed] [Google Scholar]
- 7.Villanueva A., Newell P., Chiang D.Y., Friedman S.L., Llovet J.M. Genomics and signaling pathways in hepatocellular carcinoma. Semin Liver Dis. 2007;27:55–76. doi: 10.1055/s-2006-960171. [DOI] [PubMed] [Google Scholar]
- 8.Lee J.S., Thorgeirsson S.S. Comparative and integrative functional genomics of HCC. Oncogene. 2006;25:3801–3809. doi: 10.1038/sj.onc.1209561. [DOI] [PubMed] [Google Scholar]
- 9.Hellerbrand C., Mühlbauer M., Wallner S., Schuierer M., Behrmann I., Bataille F., Weiss T., Schölmerich J., Bosserhoff A.K. Promoter-hypermethylation is causing functional relevant downregulation of methylthioadenosine phosphorylase (MTAP) expression in hepatocellular carcinoma. Carcinogenesis. 2006;27:64–72. doi: 10.1093/carcin/bgi201. [DOI] [PubMed] [Google Scholar]
- 10.Backlund P.S., Smith R.A. Methionine synthesis from 5′-methylthioadenosine in rat liver. J Biol Chem. 1981;256:1533–1535. [PubMed] [Google Scholar]
- 11.Pascale R.M., Simile M.M., De Miglio M.R., Feo F. Chemoprevention of hepatocarcinogenesis: S-adenosyl-L-methionine. Alcohol. 2002;27:193–198. doi: 10.1016/s0741-8329(02)00227-6. [DOI] [PubMed] [Google Scholar]
- 12.Olopade O.I., Pomykala H.M., Hagos F., Sveen L.W., Espinosa R., Dreyling M.H., Gursky S., Stadler W.M., Le Beau M.M., Bohlander S.K. Construction of a 2.8-megabase yeast artificial chromosome contig and cloning of the human methylthioadenosine phosphorylase gene from the tumor suppressor region on 9p21. Proc Natl Acad Sci U S A. 1995;92:6489–6493. doi: 10.1073/pnas.92.14.6489. [DOI] [PMC free article] [PubMed] [Google Scholar]
- 13.Christopher S.A., Diegelman P., Porter C.W., Kruger W.D. Methylthioadenosine phosphorylase, a gene frequently codeleted with p16(cdkN2a/ARF), acts as a tumor suppressor in a breast cancer cell line. Cancer Res. 2002;62:6639–6644. [PubMed] [Google Scholar]
- 14.García-Castellano J.M., Villanueva A., Healey J.H., Sowers R., Cordon-Cardo C., Huvos A., Bertino J.R., Meyers P., Gorlick R. Methylthioadenosine phosphorylase gene deletions are common in osteosarcoma. Clin Cancer Res. 2002;8:782–787. [PubMed] [Google Scholar]
- 15.Hori Y., Hori H., Yamada Y., Carrera C.J., Tomonaga M., Kamihira S., Carson D.A., Nobori T. The methylthioadenosine phosphorylase gene is frequently co-deleted with the p16INK4a gene in acute type adult T-cell leukemia. Int J Cancer. 1998;75:51–56. doi: 10.1002/(sici)1097-0215(19980105)75:1<51::aid-ijc9>3.0.co;2-0. [DOI] [PubMed] [Google Scholar]
- 16.Wong Y.F., Chung T.K., Cheung T.H., Nobori T., Chang A.M. MTAP gene deletion in endometrial cancer. Gynecol Obstet Invest. 1998;45:272–276. doi: 10.1159/000009983. [DOI] [PubMed] [Google Scholar]
- 17.Berasain C., Hevia H., Fernández-Irigoyen J., Larrea E., Caballería J., Mato J.M., Prieto J., Corrales F.J., García-Trevijano E., Avila M.A. Methylthioadenosine phosphorylase gene expression is impaired in human liver cirrhosis and hepatocarcinoma. Biochim Biophys Acta. 2004;1690:276–284. doi: 10.1016/j.bbadis.2004.08.002. [DOI] [PubMed] [Google Scholar]
- 18.Bonilla F., Orlow I., Cordon-Cardo C. Mutational study of p16CDKN2/MTS1/INK4A and p57KIP2 genes in hepatocellular carcinoma. Int J Oncol. 1998;12:583–588. doi: 10.3892/ijo.12.3.583. [DOI] [PubMed] [Google Scholar]
- 19.Liew C.T., Li H.M., Lo K.W., Leow C.K., Lau W.Y., Hin L.Y., Lim B.K., Lai P.B., Chan J.Y., Wang X.Q., Wu S., Lee J.C. Frequent allelic loss on chromosome 9 in hepatocellular carcinoma. Int J Cancer. 1999;81:319–324. doi: 10.1002/(sici)1097-0215(19990505)81:3<319::aid-ijc1>3.0.co;2-k. [DOI] [PubMed] [Google Scholar]
- 20.Herath N.I., Kew M.C., Walsh M.D., Young J., Powell L.W., Leggett B.A., MacDonald G.A. Reciprocal relationship between methylation status and loss of heterozygosity at the p14(ARF) locus in Australian and South African hepatocellular carcinomas. J Gastroenterol Hepatol. 2002;17:301–307. doi: 10.1046/j.1440-1746.2002.02704.x. [DOI] [PubMed] [Google Scholar]
- 21.Hellerbrand C., Amann T., Schlegel J., Wild P., Bataille F., Spruss T., Hartmann A., Bosserhoff A.K. The novel gene MIA2 acts as a tumour suppressor in hepatocellular carcinoma. Gut. 2008;57:243–251. doi: 10.1136/gut.2007.129544. [DOI] [PubMed] [Google Scholar]
- 22.Muhlbauer M., Bosserhoff A.K., Hartmann A., Thasler W.E., Weiss T.S., Herfarth H., Lock G., Scholmerich J., Hellerbrand C. A novel MCP-1 gene polymorphism is associated with hepatic MCP-1 expression and severity of HCV-related liver disease. Gastroenterology. 2003;125:1085–1093. doi: 10.1016/s0016-5085(03)01213-7. [DOI] [PubMed] [Google Scholar]
- 23.Weiss T.S., Jahn B., Cetto M., Jauch K.W., Thasler W.E. Collagen sandwich culture affects intracellular polyamine levels of human hepatocytes. Cell Prolif. 2002;35:257–267. doi: 10.1046/j.1365-2184.2002.00248.x. [DOI] [PMC free article] [PubMed] [Google Scholar]
- 24.Mühlbauer M., Fleck M., Schütz C., Weiss T., Froh M., Blank C., Schölmerich J., Hellerbrand C. PD-L1 is induced in hepatocytes by viral infection and by interferon-alpha and -gamma and mediates T cell apoptosis. J Hepatol. 2006;45:520–528. doi: 10.1016/j.jhep.2006.05.007. [DOI] [PubMed] [Google Scholar]
- 25.Amann T., Maegdefrau U., Hartmann A., Agaimy A., Marienhagen J., Weiss T.S., Stoeltzing O., Warnecke C., Schölmerich J., Oefner P.J., Kreutz M., Bosserhoff A.K., Hellerbrand C. GLUT1 expression is increased in hepatocellular carcinoma and promotes tumorigenesis. Am J Pathol. 2009;174:1544–1552. doi: 10.2353/ajpath.2009.080596. [DOI] [PMC free article] [PubMed] [Google Scholar]
- 26.Stevens A.P., Dettmer K., Kirovski G., Samejima K., Hellerbrand C., Bosserhoff A.K., Oefner P.J. Quantification of intermediates of the methionine and polyamine metabolism by liquid chromatography-tandem mass spectrometry in cultured tumor cells and liver biopsies. J Chromatogr A. 2010;1217:3282–3288. doi: 10.1016/j.chroma.2010.01.025. [DOI] [PubMed] [Google Scholar]
- 27.Stevens A.P., Dettmer K., Wallner S., Bosserhoff A.K., Oefner P.J. Quantitative analysis of 5′-deoxy-5′-methylthioadenosine in melanoma cells by liquid chromatography-stable isotope ratio tandem mass spectrometry. J Chromatogr B. 2008;876:123–128. doi: 10.1016/j.jchromb.2008.10.038. [DOI] [PubMed] [Google Scholar]
- 28.Muhlbauer M., Allard B., Bosserhoff A.K., Kiessling S., Herfarth H., Rogler G., Scholmerich J., Jobin C., Hellerbrand C. Differential effects of deoxycholic acid and taurodeoxycholic acid on NF-kappa B signal transduction and IL-8 gene expression in colonic epithelial cells. Am J Physiol Gastrointest Liver Physiol. 2004;286:G1000–G1008. doi: 10.1152/ajpgi.00338.2003. [DOI] [PubMed] [Google Scholar]
- 29.Amann T., Bataille F., Spruss T., Mühlbauer M., Gäbele E., Schölmerich J., Kiefer P., Bosserhoff A.K., Hellerbrand C. Activated hepatic stellate cells promote tumorigenicity of hepatocellular carcinoma. Cancer Sci. 2009;100:646–653. doi: 10.1111/j.1349-7006.2009.01087.x. [DOI] [PMC free article] [PubMed] [Google Scholar]
- 30.Amann T., Hellerbrand C. GLUT1 as a therapeutic target in hepatocellular carcinoma. Expert Opin Ther Targets. 2009;13:1411–1427. doi: 10.1517/14728220903307509. [DOI] [PubMed] [Google Scholar]
- 31.Harada T., Arii S., Mise M., Imamura T., Higashitsuji H., Furutani M., Niwano M., Ishigami S., Fukumoto M., Seiki M., Sato H., Imamura M. Membrane-type matrix metalloproteinase-1(MT1-MTP) gene is overexpressed in highly invasive hepatocellular carcinomas. J Hepatol. 1998;28:231–239. doi: 10.1016/0168-8278(88)80010-2. [DOI] [PubMed] [Google Scholar]
- 32.Kubo F., Ueno S., Hiwatashi K., Sakoda M., Kawaida K., Nuruki K., Aikou T. Interleukin 8 in human hepatocellular carcinoma correlates with cancer cell invasion of vessels but not with tumor angiogenesis. Ann Surg Oncol. 2005;12:800–807. doi: 10.1245/ASO.2005.07.015. [DOI] [PubMed] [Google Scholar]
- 33.Mise M., Arii S., Higashituji H., Furutani M., Niwano M., Harada T., Ishigami S., Toda Y., Nakayama H., Fukumoto M., Fujita J., Imamura M. Clinical significance of vascular endothelial growth factor and basic fibroblast growth factor gene expression in liver tumor. Hepatology. 1996;23:455–464. doi: 10.1053/jhep.1996.v23.pm0008617424. [DOI] [PubMed] [Google Scholar]
- 34.Yang P., Yuan W., He J., Wang J., Yu L., Jin X., Hu Y., Liao M., Chen Z., Zhang Y. Overexpression of EphA2. MMP-9, and MVD-CD34 in hepatocellular carcinoma: implications for tumor progression and prognosis Hepatol Res. 2009;39:1169–1177. doi: 10.1111/j.1872-034X.2009.00563.x. [DOI] [PubMed] [Google Scholar]
- 35.Desmoiliére A., Guyot C., Gabbiani G. The stroma reaction myofibroblast: a key player in the control of tumor cell behavior. Int J Dev Biol. 2004;48:509–517. doi: 10.1387/ijdb.041802ad. [DOI] [PubMed] [Google Scholar]
- 36.Kalluri R., Zeisberg M. Fibroblasts in cancer. Nat Rev Cancer. 2006;6:392–401. doi: 10.1038/nrc1877. [DOI] [PubMed] [Google Scholar]
- 37.Garcia-Roman R., Salazar-Gonzalez D., Rosas S., Arellanes-Robledo J., Beltran-Ramirez O., Fattel-Fazenda S., Villa-Trevino S. The differential NF-kB modulation by S-adenosyl-L-methionine. N-acetylcysteine and quercetin on the promotion stage of chemical hepatocarcinogenesis Free Radic Res. 2008;42:331–343. doi: 10.1080/10715760802005169. [DOI] [PubMed] [Google Scholar]
- 38.Arsura M., Cavin L.G. Nuclear factor-kappaB and liver carcinogenesis. Cancer Lett. 2005;229:157–169. doi: 10.1016/j.canlet.2005.07.008. [DOI] [PubMed] [Google Scholar]
- 39.Luedde T., Trautwein C. Intracellular survival pathways in the liver. Liver Int. 2006;26:1163–1174. doi: 10.1111/j.1478-3231.2006.01366.x. [DOI] [PubMed] [Google Scholar]
- 40.Qiao L., Zhang H., Yu J., Francisco R., Dent P., Ebert M.P., Rocken C., Farrell G. Constitutive activation of NF-kappaB in human hepatocellular carcinoma: evidence of a cytoprotective role. Hum Gene Ther. 2006;17:280–290. doi: 10.1089/hum.2006.17.280. [DOI] [PubMed] [Google Scholar]
- 41.Cerri M.A., Beltrán-Nuñez A., Bernasconi S., Dejana E., Bassi L., Bazzoni G. Inhibition of cytokine production and endothelial expression of adhesion antigens by 5′-methylthioadenosine. Eur J Pharmacol. 1993;232:291–294. doi: 10.1016/0014-2999(93)90787-i. [DOI] [PubMed] [Google Scholar]
- 42.Di Padova F., Di Padova C., Stramentinoli G., Tritapepe R. Inhibition of lymphocyte function by a naturally occurring nucleoside: 5′-methylthioadenosine (MTA) Int J Immunopharmacol. 1985;7:193–198. doi: 10.1016/0192-0561(85)90026-8. [DOI] [PubMed] [Google Scholar]
- 43.Hevia H., Varela-Rey M., Corrales F.J., Berasain C., Martinez-Chantar M.L., Latasa M.U., Lu S.C., Mato J.M., Garcia-Trevijano E.R., Avila M.A. 5′-methylthioadenosine modulates the inflammatory response to endotoxin in mice and in rat hepatocytes. Hepatology. 2004;39:1088–1098. doi: 10.1002/hep.20154. [DOI] [PubMed] [Google Scholar]
- 44.Ansorena E., García-Trevijano E., Martínez-Chantar M.L., Huang Z.Z., Chen L., Mato J.M., Iraburu M., Lu S.C., Avila M.A. S-adenosylmethionine and methylthioadenosine are antiapoptotic in cultured rat hepatocytes but proapoptotic in human hepatoma cells. Hepatology. 2002;35:274–280. doi: 10.1053/jhep.2002.30419. [DOI] [PubMed] [Google Scholar]
- 45.Avila M.A., García-Trevijano E., Lu S., Corrales F., Mato J. Methylthioadenosine. Int J Biochem Cell Biol. 2004;36:2125–2130. doi: 10.1016/j.biocel.2003.11.016. [DOI] [PubMed] [Google Scholar]
- 46.de Ferra F., Baglioni C. Correlation between growth inhibition and presence of 5′-methylthioadenosine in cells treated with interferon. Cancer Res. 1984;44:2297–2301. [PubMed] [Google Scholar]
- 47.Maher P.A. Inhibition of the tyrosine kinase activity of the fibroblast growth factor receptor by the methyltransferase inhibitor 5′-methylthioadenosine. J Biol Chem. 1993;268:4244–4249. [PubMed] [Google Scholar]
- 48.Riscoe M.K., Schwamborn J., Ferro A.J., Olson K.D., Fitchen J.H. Inhibition of growth but not differentiation of normal and leukemic myeloid cells by methylthioadenosine. Cancer Res. 1987;47:3830–3834. [PubMed] [Google Scholar]
- 49.Shafman T.D., Sherman M.L., Kufe D.W. Effect of 5′-methylthioadenosine on induction of murine erythroleukemia cell differentiation. Biochem Biophys Res Commun. 1984;124:172–177. doi: 10.1016/0006-291x(84)90932-x. [DOI] [PubMed] [Google Scholar]
- 50.Basu I., Cordovano G., Das I., Belbin T.J., Guha C., Schramm V.L. A transition state analogue of 5′-methylthioadenosine phosphorylase induces apoptosis in head and neck cancers. J Biol Chem. 2007;282:21477–21486. doi: 10.1074/jbc.M702287200. [DOI] [PubMed] [Google Scholar]