Abstract
Objective
The ability of ultrasound (US) and ultrasound contrast agents (UCAs) to induce angiogenesis has been explored as a means of restoring blood flow to ischemic muscle. Because UCAs demonstrate an increasing percentage of collapse cavitation with increasing US pressure (Pr), this study sought to explore the effects of a US Pr that produces 100% collapse cavitation, determine the capillary density changes, and determine the time point of angiogenic rebound in a normal animal model.
Methods
Using a 1-MHz focused transducer and a peak rarefactional US Pr of 3.8 MPa, rat gracilis muscles were exposed to US, and bioeffects were assessed. Capillary density, as a measure of angiogenesis, was examined. As an additional measure, inflammatory cells were quantified via a color threshold analysis to detect the presence of CD31 and CD34 as a percentage of the total section on stained slides. Six groups (0, 3, 6, 13, 20, and 27 days postexposure [DPE]; n = 3 each) and 5 cage controls were used to characterize the angiogenic response.
Results
Ultrasound-UCA treatment caused the capillary density to decrease acutely (0 DPE) by 70% and inflammatory cells to increase by up to 250%. The angiogenic rebound was observed at 3 DPE but did not return to control levels by 27 DPE, suggesting an incomplete healing response.
Conclusions
Capillary destruction and inflammation played an important role in the angiogenic response induced by US-UCA. Exposure that causes 100% collapse cavitation causes capillary destruction from which normal rats are unable to recover and suggests a nontherapeutic effect.
Keywords: collapse cavitation, capillary damage, inflammation, proangiogenic therapy, therapeutic ultrasound
Ischemia-related heart disease affects more than 80 million people in the United States.1 Current interventions include ablation, angioplasty, revascularization, and bypass surgery. The invasive nature of these techniques excludes patients with myocardial ischemia who are not amenable to surgical intervention. For this reason, alternative methods of revascularization in ischemic cardiac muscle have been explored. Over the past 2 decades, cellular, molecular, and genetic therapy attempts have been made to find a clinically relevant treatment.2–6 Ultimately, it is the invasiveness or lack of site specificity that provides the largest obstacle for therapeutic effectiveness of angiogenic treatments.
Current research has suggested that ultrasound (US)-ultrasound contrast agent (UCA) treatment can be therapeutically beneficial, providing a noninvasive way to spatially and temporally target ischemic tissues.7–10 This type of angiogenic therapy can be used as an alternative to high-risk percutaneous intervention or bypass graft surgery. Several studies report a reparative response to US-UCA exposure and state that inertial cavitation, or microbubble collapse, is possibly required for angiogenesis to occur.8,11–14 Numerous small-scale studies have shown promising results; however, when large-scale double-blind studies were conducted, they showed limited effects.15 A major impediment for progress to clinical applicability is, perhaps, the lack of understanding of the biophysical mechanisms that connect US-UCAs to neovascularization.
It is important to establish a basic knowledge of capillary changes that occur with US-UCA exposure so that US-UCA-induced angiogenesis can be assessed for therapeutic benefit and so that existing therapies can be improved. Current studies in the literature involving US-UCA-induced angiogenesis use peak rarefactional US pressure (Pr) varying between 0.1 and 1.0 MPa.8,12,16,17 These Pr values have been shown to collapse approximately 20% to 70% of UCAs at 1 MHz.18 Therefore, the question remains as to what causes the angiogenic response. Studies involving US-UCA-induced angiogenesis show increases in the collateral blood supply ranging from 5% to 35% with respect to their controls.8–12 However, the effectiveness of the therapy used in each study cannot be correlated to Pr levels or any other parameter used. Also, these studies do not directly correlate a UCA mechanism to the angiogenic response.8–12 In addition, most studies involving US-UCA therapy use ischemic models without exploring the underlying mechanism. Furthermore, the time points for angiogenic assessment (ie, days postexposure [DPE]) were quite varied, ranging from 3 to 28 DPE.8,16,17,19,20
The goals of this study were to explore the influence of UCA collapse cavitation, the angiogenic progression in a normal animal model, and determine whether and if so when the capillary density (as a measure of angiogenesis) increases subsequent to US-UCA exposure in an effort to connect the acute (0 day) bioeffect to the end goal of angiogenesis. This study used a Pr of 3.8 MPa to collapse about 100% of the UCAs18 in an effort to correlate a mechanism with the angiogenic response. Previous work has shown effectiveness at lower Pr values; however, the underlying premise is that angiogenesis is damage induced and involves a reparative response.9,12,13 This study inspects that underlying premise. Examination of UCA collapse cavitation and subsequent angiogenic effects is integral to understanding how to increase angiogenesis. In this study, rats were randomly assigned to 0, 3, 6, 13, 20, and 27 DPE groups to investigate the progression of capillary density and inflammation in response to a Pr sufficient to cause collapse cavitation of UCAs in a normal animal model. Capillary density was quantified in capillaries per square millimeter via immunohistochemical (IHC) staining (CD31 and CD34).
Materials and Methods
Ultrasound
A 1.0-MHz single-element focused (f/3) transducer (E1051, 0.75-in diameter; Valpey Fisher, Hopkinton, MA) connected to a power source (RAM5000; Ritec, Inc, Warwick, RI) was used for the exposures. The base was removed from a cylindrical bowl, and plastic wrap (Saran; S. C. Johnson & Son, Inc, Racine, WI) was placed securely around the bowl with large rubber bands. A custom-built plastic holder for the bowl was constructed such that the bowl could be suspended from a square post. The bowl was filled with degassed water for US transmission (Figure 1). The water was heated to approximately 35°C using a proportional temperature controller (model 72; Yellow Springs Instrument Co/Cole Parmer Instrument and Equipment Co, Vernon Hills, IL). Mineral oil was then placed at the point of contact (between skin and the Saran wrap) to further ensure an air-free interface.
Figure 1.
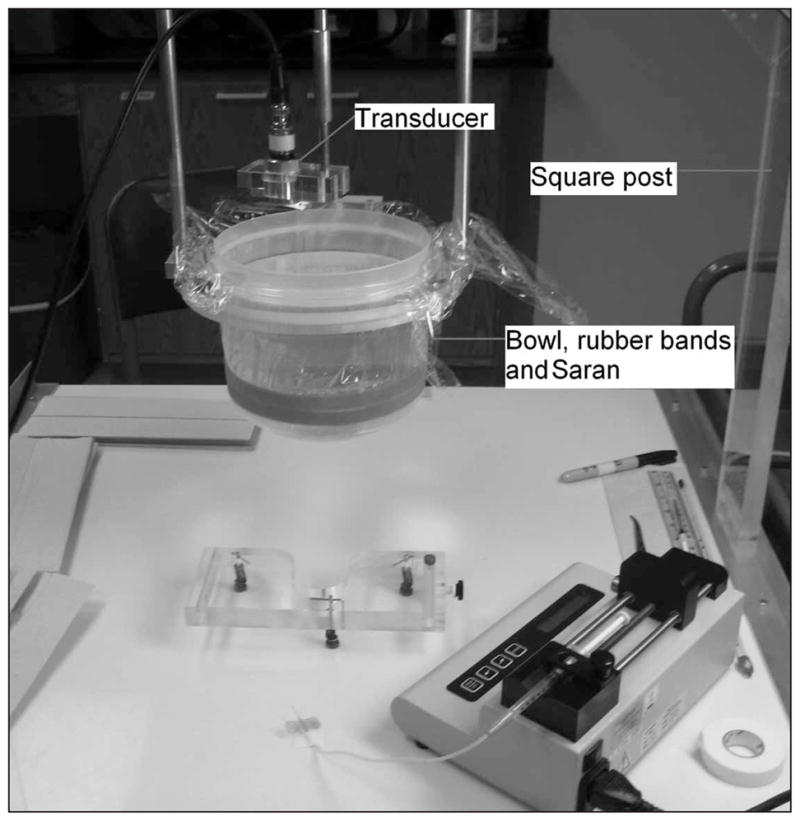
Experimental setup. The animal was restrained in the holder beneath the cylindrical container for exposures. before the infusion pump was stopped such that Definity solution was present during each 2-minute exposure.
Exposimetry
An automated procedure, based on established standards,21,22 was used to routinely calibrate the US fields.23,24 While calibrations were performed in degassed water, in situ estimation of the US exposure quantities was required to assist in evaluating exposure-effect responses and basic physical mechanisms. The in situ peak rarefactional Pr values were estimated from Pr (in situ) = Pr (in vitro) e−Ax, where Pr (in vitro) is the global-maximum water-based value, and A is the attenuation coefficient of the skin (A ≈ 2 dB/cm at 1 MHz)25 overlying the gracilis muscle, which had a thickness, x, of approximately 1 mm. Attenuation of US by intervening tissue is negligible (0.98 of in vitro Pr); thus, the reported Pr is that of the in vitro value.
Before exposures, the transducer’s peak signal was aligned with the marked exposure site. The peak signal was found visually using an attached oscilloscope (500 MS/s, model 9354TM; LeCroy, Chestnut Ridge, NY). For transducer alignment, a low Pr value (50 kPa) was used to ensure minimal US-induced damage. Parameters used during US exposure included a Pr of 3.8 MPa, a pulse duration (PD) consisting of a 10-cycle sine wave (10 microseconds), a pulse repetition frequency (PRF) of 1 Hz, and an exposure duration (ED) of 2 minutes at each of the 4 locations.
Animals
Twenty-three female Sprague Dawley rats (Harlan Laboratories, Inc, Indianapolis, IN) were used in this study. Precautions were taken to ensure that all of the rats were not only within the specified age range (11–13 weeks old), but also a specific weight range (190–250 g; mean, 200 g). Five rats were cage controls, and 3 rats were randomly assigned to each of the 6 groups: 0, 3, 6, 13, 20, and 27 DPE. The cage control animals were experimental shams, receiving no US or UCA treatment.
Rats were weighed and anesthetized with ketamine hydrochloride (87 mg/kg) and xylazine (13 mg/kg) administered intraperitoneally. Hind limb hair over the gracilis muscle was removed with an electric clipper, followed by a depilatory agent (Nair; Carter-Wallace, Inc, New York, NY) to maximize sound transmission. The rat was then placed in a custom-built holder. Two locations, approximately 5 mm apart, on both the right and left gracilis muscles were marked with a black dot to denote the US exposure location. The US transducer was visually aligned with the black dot. After US-UCA exposure at each of the 4 locations, the rats recovered for their respective group day; the 0-DPE rats were euthanized with carbon dioxide approximately 1 hour following exposure. During the study, cage control animals were randomly euthanized and examined in the same manner as exposed rats.
The experimental protocol was approved by the Institutional Animal Care and Use Committee of the University of Illinois and satisfied all campus and National Institutes of Health rules for the humane use of laboratory animals. Animals were housed in an Association for Assessment and Accreditation of Laboratory Animal Care (Rockville, MD)–approved animal facility and provided food and water ad libitum.
Microbubble Preparation
The manufacturer’s recommended dosage for infusion was used to establish the 1× concentration of Definity (Bristol-Myers Squibb Medical Imaging, North Billerica, MA). Prior to US exposure, the animal was manually infused for 30 seconds with 0.5 mL of Definity solution (0.15 mL of Definity in 0.35 mL of saline) such that UCAs were introduced into circulation. After manual infusion, 1.0 mL of Definity solution (0.3 mL of Definity in 0.7 mL of saline) was infused with an infusion pump (model 780100; KD Scientific, Holliston, MA) for 15 minutes into the rat tail vein at a rate of 4.0 mL/h. The resulting infusion rate was a maximum of 2 × 10⁸ microbubbles/min. The first of 4 US exposed sites was started approximately 5 seconds after the infusion pump was started (2 minutes per exposed site, 2 minutes for realignment with the next site, and 4 sites per rat = 14 minutes). All 4 exposures were completed
Tissue Preparation and Processing
The tissues were extracted, formalin fixed for 24 hours, and then paraffin embedded (ThermoFisher Scientific, Inc, Waltham, MA). Three-micrometer-thick sections were stained with: (1) hematoxylin and eosin (H&E) for whole tissue effect examination, and (2) CD31 (ab56299; Abcam, Cambridge, MA) and (3) CD34 (ab8158; Abcam) for capillary density counts.26
Capillary Assessment
For each rat, the following microscope slides were created: H&E, CD31, CD34, CD31 positive control, CD31 negative control, CD34 positive control, and CD34 negative control. The H&E slides were used to observe whole tissue effects such as hemorrhage (extravasation of platelets), cellular swelling, and/or tissue discoloration. CD31 and CD34 slides were used for capillary density counting. Each CD31 and CD34 slide was divided into 15 random high-power fields (HPFs) within the region of interest (the US-exposed area) for capillary assessment (Figure 2). Each IHC control slide was used to ensure proper staining and antibody activity. An Axioscope 2 upright light microscope (Carl Zeiss Microscopy, Thornwood, NY) had an HPF of 0.45 mm in diameter at 40× magnification. The 15 HPFs were averaged and reported as capillaries per square millimeter.
Figure 2.
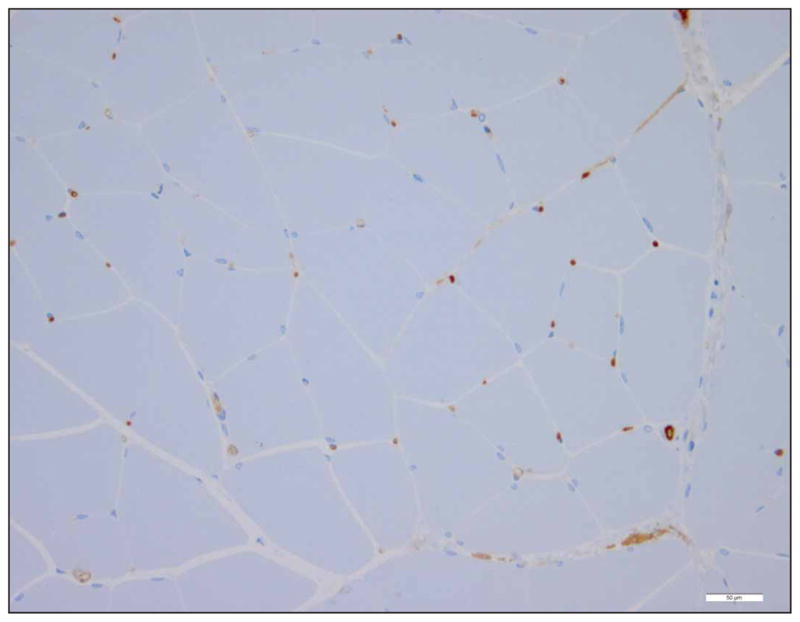
Representative IHC image (CD31 and CD34 stain similarly). Only full lumen capillaries with approximately 7-μm diameters were counted as capillaries. Scale bar indicates 50 μm.
Inflammatory Cell Assessment
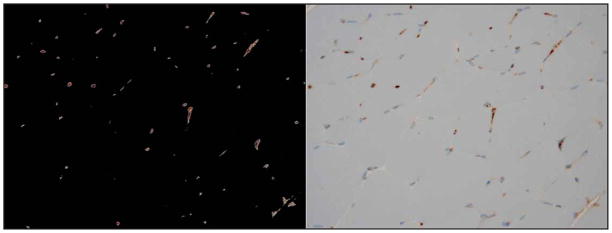
The IHC slides were digitized, and a program to analyze the presence of CD31 and CD34 from the images was generated in MATLAB (The MathWorks, Natick, MA). This program was designed to quantify the presence of the brown stain indicative of inflammation marked by CD31 and CD34 (Figure 3). The results were normalized to the cage control rats after raw percentages of inflammatory cells were gathered. The program was constructed to read in an image, and using red-green-blue threshold values, highlight only the pixels of interest. Visual examination of each image confirmed the approximate correctness of the program. The program then returned a percentage (of total pixels in the image; pixel size, 0.5 μm) of inflammatory cells with respect to the total image. This number was used to determine the extent to which inflammation was occurring.
Figure 3.
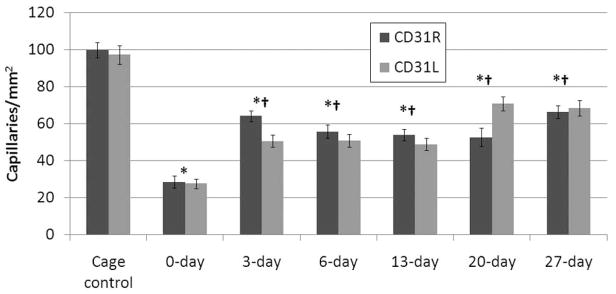
CD31 across all DPE. The capillary counts are consistent between left and right limbs but are statistically significant between 0 DPE and all other groups. Error bars indicate SEM. *Statistically different from cage control. †Statistically different from 0 DPE.
Statistical Analysis
N-way analysis of variance (ANOVA) was used in MATLAB to determine if the capillary densities and inflammatory cells for CD31 and CD34 were statistically different for each group. The main effects: DPE, limb, and stain, were tested for significance with α = .05. One-way ANOVA was also used to test whether there was a difference between 3, 6, 13, 20, and 27 DPE. Then, 1-tailed 2-sample t tests (α = .05) were used as a follow-up to compare all DPE with the control and 0 DPE. To control for the elevated family-wise error associated with performing multiple comparisons on the same data, the Bonferroni correction was used (adjusted α = .004). The SEM was calculated and displayed on relevant graphs. It is hypothesized that, for each IHC stain, the capillary densities will increase with increasing DPE. Inflammatory cells were quantified via threshold estimates using whole region of interest samples from the CD31 and CD34 slides. It is also hypothesized that the relative presence of inflammatory cells will decrease with increasing DPE opposing the trend for capillary density.
Results
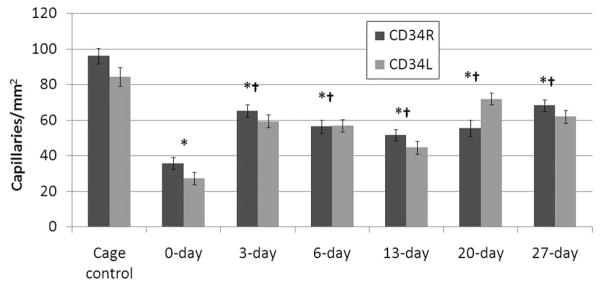
From each group of rats, capillary counts were performed on the region of interest (the US-exposed region); these counts were subsequently averaged (Figures 3 and 4). The N-way ANOVA revealed that the means were statistically different for the DPE main effect. A significant difference was not found between exposed limbs or IHC stain. There was also no significant interaction between exposed limbs, stain, and DPE. The results show an initial 70% reduction in capillary density relative to the cage control followed by an increase in capillary density over increasing DPE, not returning to cage control levels. The 0-DPE rats displayed marked hemorrhage in response to US-UCA exposure (Figure 5). Statistical significance was reached for all DPE when compared to acute exposure (0 DPE) for both stains (CD31 and CD34). However, there was no significant difference in capillary density between 3 DPE and later time points for both stains. The individual DPE points were compared to determine when the angiogenic effect began and determine if there was a subsequent decrease in capillary density after angiogenic rebound. Because 3, 6, 13, 20, and 27 DPE were not significantly different for capillary density, the angiogenic progression showed a rebound at 3 DPE. At 3 DPE, the capillary density increased to approximately 60% of the cage control.
Figure 4.
CD34 across all DPE groups. The capillary counts are consistent between left and right limbs but are statistically significant between 0 DPE and all other groups. Error bars indicate SEM. *Statistically different from cage control. †Statistically different from 0 DPE.
Figure 5.
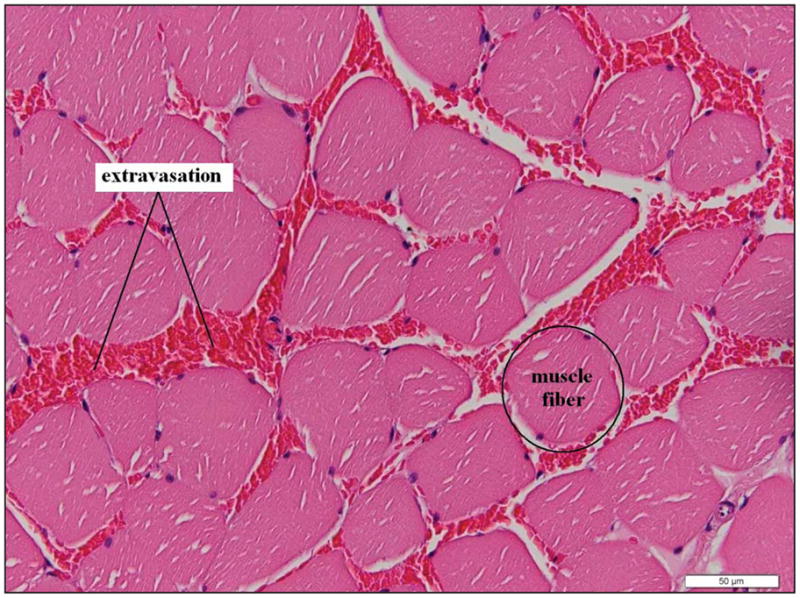
Representative image at 0 DPE exposure. Red blood cells are located between the muscle fibers, representing extravasation indicative of capillary damage. Scale bar indicates 50 μm.
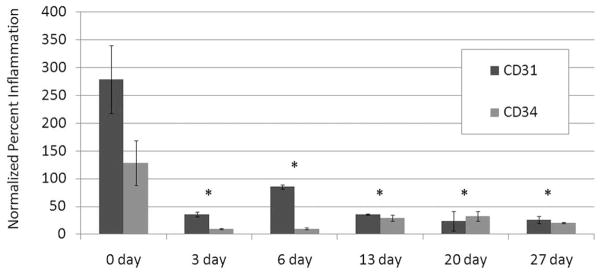
All IHC slides were digitized into images. The IHC images were analyzed for the percentage of pixels positive for CD31 and CD34 as an indicator of inflammation and normalized to the control (Figure 6). CD31 stains for endothelial cells of blood vessels, macrophages, and neutrophils. CD34 stains for endothelial cells of blood vessels and mast cells. Figure 7 shows an increase at 0 DPE but remains relatively low in all other time points. CD31 shows statistically significant higher magnitudes of inflammation markers acutely (0 DPE) than does CD34.
Figure 6.
Inflammation assessment. Images from MATLAB display identified pixels stained positively for CD31 (left) and the corresponding IHC image (right).
Figure 7.
Normalized (to cage controls) percentage of inflammatory cells. *Statistically different from 0 DPE.
Discussion
This study shows that, when collapse cavitation is used as a mechanism for inducing a biological effect in a normal rat muscle, there is an initial decrease in capillary density that is followed by a reparative mechanism causing a rebound in capillary density at 3 DPE. The rat is unable to fully recover from the initial insult to capillary density within the 27 days studied. This study also observed the involvement of inflammatory cells after US-UCA exposure. These findings are important in determining when to look for the enhancement of US-UCA-induced angiogenesis in rat skeletal muscle and the trends of effects with respect to capillary density and inflammation.
Ultrasound with UCAs8,14,16 has been used in numerous studies to promote secondary wound-healing angiogenesis that aids in augmenting the body’s normal responses. Most of these studies, however, were performed on animal models with ischemia, and the studies with UCAs typically bore a gene, a growth factor, or stem cells.9,10,14,16,27,28 Little work has been done to explore the involvement of the UCA, the progression of this reparative response under normal conditions, or when to look for these responses. It is important to first observe effects in a normal model to understand the underlying mechanism. The time point at which angiogenesis is assessed in the literature varies from 3 days after US exposure8 to 28 days after exposure.16 Furthermore, no studies to date have assessed the inflammatory response and linked that information to the angiogenic response. Therefore, this study used a predominating mechanism of collapse cavitation to assess the UCA involvement, inflammatory and angiogenic responses. Examining the mechanism and progression are important steps to determining the mechanisms by which US- and UCA-induced angiogenesis occurs. While this study did not directly link the inflammatory response to the angiogenic response, there is evidence that supports the increase in inflammation prior to increases in angiogenesis.29
The mechanism being exploited in this study to assess the angiogenic response to US and UCA exposure was dependent on a nonthermal effect, collapse cavitation. A US Pr of 3.8 MPa was chosen such that virtually all of the microbubbles underwent collapse cavitation. Independent studies have shown that 95% of Definity collapses at approximately Pr = 1.0 MPa in vitro.18 At high US exposure Pr values, the percentage of collapse cavitations occurring in vitro is large.18 As in vitro Pr values are approximately those of in situ Pr values, high US exposure Pr values are assumed to cause a large percentage of collapse cavitations in situ as well. However, when relating Pr values used in relevant literature to microbubble collapse data, most researchers expose at Pr values wherein 20% to 70% of UCAs collapse.8,10,12,16 Therefore, up to now there has been no identified predominating mechanism. This study used 100% collapse cavitation. Furthermore, whether a particular percentage of collapse cavitation is necessary for an angiogenic response remains unknown. Ultrasound-UCA-induced angiogenesis could be the result of UCA oscillation disturbing the blood flow or direct activation of factors intrinsic to angiogenesis, such as inflammation.
The importance of addressing confounding variables such as heating is of marked importance for elucidating specific biophysical mechanisms. For a single pulse, and under the assumption that no heat is lost by any removal processes, the maximum temperature increase was calculated.30 To calculate the maximum temperature increase, ΔTmax = (Q̇Δt)/Cv was used, where Δt is the ED (for a single pulse, ED is 10 microseconds); Cv is the medium’s heat capacity per unit volume (4.18 J/cm3-°C for biological tissue); and Q̇ is the rate of heat generation per unit volume given by the expression30,31: Q̇ = 2αITA = (αpp*)/(ρc), where α is the ultrasonic amplitude absorption coefficient (0.5 dB/cm at 1 MHz); ITA is the temporal-average intensity (481 W/cm2); p is approximated herein as Pr (3.8 MPa), the peak US Pr of a single pulse; ρ is density (1000 kg/m3); and c is sound speed (1500 m/s). Thus, for a single 10-microsecond pulse, ΔTmax is 0.13 m°C.
However, for repeated pulses with an ED of 120 seconds and a PRF of 1 Hz, the duty factor is PD × PRF = 10−5, thus yielding temporal-average intensity of 4.81 mW/cm2. Therefore, Q̇ is 554 W/m3, yielding ΔTmax of 16 m°C. This maximum temperature increase estimate assumes that there is no heat removal, which would not necessarily be the case for a 2-minute exposure. Thus, it is reasonable to assume that heating is not an operative biophysical mechanism.
The standard for assessing angiogenesis in animal models is increased vessel count, as demonstrated in numerous angiogeneis studies.7,8,10,16 Therefore, capillary density was used in this study. Furthermore, two stains were chosen to ensure capillary density counting consistency. Size and shape exclusion was practiced in the quantification of capillary density. CD31 and CD34 are common stains for the endothelial cells of capillaries, but these stains were also used to measure inflammation because they bind to numerous cells that are involved in inflammation or inflammation resolution, including endothelial cells, macrophages, and neutrophils (CD31) and mast cells (CD34).
Both CD31 and CD34 capillary counts follow the same trend, where after an initial insult with US there is a reduction in the capillary density with respect to the cage control. Not only do CD31 and CD34 observations follow the same trend, but also the capillary densities are comparable for a particular DPE as well.
To address inflammatory cell involvement, CD31-positive pixels were computed relative to the total number of pixels on the CD31 and CD34 digitized slides. Ultrasound has been documented to enhance the activity of cells involved in inflammation,32–34 and inflammatory cells are important contributors to angiogenesis.35 Because endothelial cells of blood vessels, monocytes, macrophages, mast cells, and neutrophils are carriers of the CD31 and/or CD34 molecules, they can provide a quantitative indication of inflammatory cell involvement. However, CD31 and CD34 demonstrated a marked difference when considering the level of inflammatory cell involvement, presumably because CD31 stains for more types of cells involved in inflammation than does CD34. When the lumen of capillaries is disturbed, blood components are released into the wound site to activate the clotting cascade. Platelets degranulate and release granules that secrete growth factors, which attract neutrophils and monocytes.28 The involvement of neutrophils, monocytes, and macrophages detected with CD31 but not with CD34.
It should be noted that artifacts and stain intensity may have affected the estimations of inflammation. There was a sharp increase in inflammatory cells in the acute rat group (0 DPE). It was expected that this sharp increase would be followed by a more gradual decrease than what was observed, but the trends of the two stains are similar. To date, bioeffects studies assess events at day 0, while angiogenesis studies assess effects at days 3 to 28. This study explored the connection between the bioeffect and angiogenesis from 0 to 27 days. Because US has been speculated to enhance inflammation, the results in this study appear to be consistent.
The results gathered in this study showed opposing trends for capillary density and inflammation after US-UCA exposure. The initial insult to capillary density was presumably due to the violent collapse that cavitation contributes to US-UCAs. Wound healing involves several stages: homeostasis, inflammation, and angiogenesis.29 Collapsing 100% of the UCAs in the exposed region likely caused an inflammatory reaction subsequent to coagulation (homeostasis), which was detected at 0 DPE when capillary density was reduced. Allowing time to heal results in endothelial cell proliferation and angiogenesis,29 which, in this study, was seen as an increase in capillary density along with a decrease in inflammation leading to wound resolution, supporting data shown herein.
Although this study observed inflammatory cell involvement, it has been speculated that hypoxia, direct vascular endothelial growth factor enhancement, endothelial cell activation, platelet activation, mechanical stress, increased permeability, and hemodynamic changes such as inflammatory cell activation and inertial cavitation contribute to US-UCA-induced angiogenesis.7,8,16,36–38 Further work to characterize the response and biophysics of US-UCA-induced angiogenesis needs to be completed to explore the mechanistic trigger.
Limitations
One limitation of this study is that a bit of uncertainty is introduced when counting capillaries, as capillaries occur in networks and form complex systems within tissues. The capillary density measurements were therefore not only a measure of angiogenesis but also tissue perfusion. Numerous studies, however, have used vessel density as a measure of both angiogenesis and tissue perfusion.8–10,13,16,17
For controls, we only studied animals that received no treatment. Ideally, controls should also include a group receiving US alone. Our intent, however, was to focus on the biophysics relating to bubble dynamics in this study.
Research shown in this study does not account for US-UCA-induced angiogenesis where there are other competing mechanisms (ie, diseased model and attached growth factors). The objectives of this study were to determine the effect of 100% collapse cavitation, progression of angiogenesis as a result of a prescribed US exposure in terms of capillary density in a temporal study.
Conclusions
This study found that the angiogenic progression began 3 days after undergoing US-UCA exposure. The optimum amount of recovery in response to collapse cavitation occurred at 3 DPE and did not return to control levels by 27 DPE in the normal rat at the Pr level of 3.8 MPa. Capillaries responded with an acute decrease in density, presumably as a result of vascular endothelial cell damage, resulting in local hemorrhage. The capillary density increase was followed by a decrease at 3 DPE and remained level until 27 DPE. This study also showed that inflammation cells (staining positively for CD31 or CD34) increased acutely with exposure to US and the UCA. The increase in inflammation decreased to control levels by 3 DPE, which opposed the trend seen for the density of capillaries. This study showed that inflammation plays a role in angiogenesis induced by US-UCA. This study also suggested that 100% collapse cavitation causes capillary destruction from which normal rats are unable to recover and thus may be too damaging to be therapeutically beneficial.
Acknowledgments
This work was funded in part by National Institutes of Health (NIH) grant R37 EB002641 and NIH fellowship F31 HL097653-01 (C.A.J.).
Abbreviations
- ANOVA
analysis of variance
- DPE
days postexposure
- ED
exposure duration
- H&E
hematoxylin and eosin
- HPF
high-power field
- IHC
immunohistochemical
- PD
pulse duration
- Pr
pressure
- PRF
pulse repetition frequency
- UCA
ultrasound contrast agent
- US
ultrasound
References
- 1.Rosamond W, Flegal K, Furie K, et al. Heart disease and stroke statistics—2008 update: a report from the American Heart Association Statistics Committee and Stroke Statistics Subcommittee. Circulation. 2008;117:e25–e146. doi: 10.1161/CIRCULATIONAHA.107.187998. [DOI] [PubMed] [Google Scholar]
- 2.Assmus B, Schächinger V, Teupe C, et al. Transplantation of progenitor cells and regeneration enhancement in acute myocardial infarction (TOPCARE-AMI) Circulation. 2002;106:3009–3017. doi: 10.1161/01.cir.0000043246.74879.cd. [DOI] [PubMed] [Google Scholar]
- 3.Grines C, Rubanyi GM, Kleiman NS, Marrott P, Watkins MW. Angiogenic gene therapy with adenovirus 5 fibroblast growth factor-4 (Ad5FGF-4): a new option for the treatment of coronary artery disease. Am J Cardiol. 2003;92:24N–31N. doi: 10.1016/s0002-9149(03)00965-2. [DOI] [PubMed] [Google Scholar]
- 4.Hiasa K, Ishibashi M, Ohtani K, et al. Gene transfer of stromal cell-derived factor-1alpha enhances ischemic vasculogenesis and angiogenesis via vascular endothelial growth factor/endothelial nitric oxide synthase-related pathway: next generation chemokine therapy for therapeutic neovascularization. Circulation. 2004;109:2454–2461. doi: 10.1161/01.CIR.0000128213.96779.61. [DOI] [PubMed] [Google Scholar]
- 5.Iwaguro H, Yamaguchi J, Kalka C, et al. Endothelial progenitor cell vascular endothelial growth factor gene transfer for vascular regeneration. Circulation. 2002;105:732–738. doi: 10.1161/hc0602.103673. [DOI] [PubMed] [Google Scholar]
- 6.Van Royen N, Hoefer I, Buschmann I, et al. Exogenous application of transforming growth factor beta 1 stimulates arteriogenesis in the peripheral circulation. FASEB J. 2002;16:432–434. doi: 10.1096/fj.01-0563fje. [DOI] [PubMed] [Google Scholar]
- 7.Barzelai S, Sharabani-Yosef O, Holbova R, et al. Low-intensity ultrasound induces angiogenesis in rat hind limb ischemia. Ultrasound Med Biol. 2006;32:139–145. doi: 10.1016/j.ultrasmedbio.2005.08.010. [DOI] [PubMed] [Google Scholar]
- 8.Chappell JC, Kilbanov AL, Price RJ. Ultrasound-microbubble-induced neovascularization in mouse skeletal muscle. Ultrasound Med Biol. 2005;31:1411–1422. doi: 10.1016/j.ultrasmedbio.2005.06.010. [DOI] [PubMed] [Google Scholar]
- 9.Chappell JC, Song J, Kilbanov AL, Price RJ. Ultrasonic microbubble destruction stimulates therapeutic arteriogenesis via the CD18-dependent recruitment of bone marrow-derived cells. Arterioscler Thromb Vasc Biol. 2008;28:1117–11122. doi: 10.1161/ATVBAHA.108.165589. [DOI] [PubMed] [Google Scholar]
- 10.Fuji H, Sun Z, Li S, et al. Ultrasound-targeted gene delivery-induced angiogenesis after a myocardial infarction in mice. JACC Cardiovasc Imaging. 2009;7:869–879. doi: 10.1016/j.jcmg.2009.04.008. [DOI] [PubMed] [Google Scholar]
- 11.Hwang JH, Brayman AA, Reidy MA, Matula TJ, Kimmey MB, Crum LA. Vascular effects induced by combined 1-MHz ultrasound and microbubble contrast agent treatments in vivo. Ultrasound Med Biol. 2005;31:553–564. doi: 10.1016/j.ultrasmedbio.2004.12.014. [DOI] [PubMed] [Google Scholar]
- 12.Korpanty G, Chen S, Shohet RV, et al. Targeting of VEGF-mediated angiogenesis to rat myocardium using ultrasonic destruction of microbubbles. Gene Ther. 2005;12:1305–1312. doi: 10.1038/sj.gt.3302532. [DOI] [PubMed] [Google Scholar]
- 13.Miyake Y, Ohmori K, Yoshida J, et al. Granulocyte colony-stimulating factor facilitates the angiogenesis induced by ultrasonic microbubble destruction. Ultrasound Med Biol. 2007;33:1796–1804. doi: 10.1016/j.ultrasmedbio.2007.05.017. [DOI] [PubMed] [Google Scholar]
- 14.Song X, Zhu H, Jin L, et al. Ultrasound-mediated microbubble destruction enhances the efficacy of bone marrow mensenchymal stem cell transplantation and cardiac function. Clin Exp Pharmacol Physiol. 2008;36:267–271. doi: 10.1111/j.1440-1681.2008.05049.x. [DOI] [PubMed] [Google Scholar]
- 15.Grines CL, Watkins MW, Helmer G, et al. Angiogenic Gene Therapy (AGENT) trial in patients with stable angina pectoris. Circulation. 2002;105:1291–1297. doi: 10.1161/hc1102.105595. [DOI] [PubMed] [Google Scholar]
- 16.Song J, Cottler PS, Klibanov AL, Kaul S, Price RJ. Microvascular remodeling and accelerated hyperemia blood flow restoration in arterially occluded skeletal muscle exposed to ultrasonic microbubble destruction. Am J Physiol Heart Circ Physiol. 2004;287:H2754–H2761. doi: 10.1152/ajpheart.00144.2004. [DOI] [PubMed] [Google Scholar]
- 17.Zen K, Okigaki M, Hosokawa Y, et al. Myocardium-targeted delivery of endothelial progenitor cells by ultrasound-mediated microbubble destruction improves cardiac function via an angiogenic response. J Mol Cell Cardiol. 2006;40:799–809. doi: 10.1016/j.yjmcc.2006.03.012. [DOI] [PubMed] [Google Scholar]
- 18.King DA, Malloy MJ, Roberts AC, Haak A, Yoder CC, O’Brien WD., Jr Determination of postexcitation thresholds for single ultrasound contrast agent microbubbles using double passive cavitation detection. J Acoust Soc Am. 2010;127:3449–3455. doi: 10.1121/1.3373405. [DOI] [PMC free article] [PubMed] [Google Scholar]
- 19.Ezaki T, Baluk P, Thurston G, La Barbara A, Woo C, McDonald DM. Time course of endothelial cell proliferation and microvascular remodeling in chronic inflammation. Am J Pathol. 2001;158:2043–2055. doi: 10.1016/S0002-9440(10)64676-7. [DOI] [PMC free article] [PubMed] [Google Scholar]
- 20.Wagatsuma A, Osawa T. Time course of changes in angiogenesis-related factors in denervated muscle. Acta Physiol (Oxf) 2006;187:503–509. doi: 10.1111/j.1748-1716.2006.01594.x. [DOI] [PubMed] [Google Scholar]
- 21.American Institute of Ultrasound in Medicine, National Electrical Manufacturers Association. Acoustic Output Measurement Standard for Diagnostic Ultrasound Equipment. Laurel, MD: American Institute of Ultrasound in Medicine; Rosslyn, VA: National Electrical Manufacturers Association; 1998. [Google Scholar]
- 22.American Institute of Ultrasound in Medicine, National Electrical Manufacturers Association. Standard for Real-Time Display of Thermal and Mechanical Acoustic Output Indices on Diagnostic Ultrasound Equipment. Revision 1. Laurel, MD: American Institute of Ultrasound in Medicine; Rosslyn, VA: National Electrical Manufacturers Association; 1998. [Google Scholar]
- 23.Sempsrott JM, O’Brien WD., Jr Experimental verification of acoustic saturation. Proc IEEE Ultrason Symp. 1999;2:1287–1290. [Google Scholar]
- 24.Zachary JF, Hartleben SA, Frizzell LA, et al. Contrast agent-induced cardiac arrhythmias in rats. Proc IEEE Ultrason Symp. 2001;2:1709–1712. [Google Scholar]
- 25.Riederer-Henderson MA, Olerud JE, O’Brien WD, Jr, et al. Biochemical and acoustical parameters of normal canine skin. IEEE Trans Biomed Eng. 1988;35:967–972. doi: 10.1109/10.8678. [DOI] [PubMed] [Google Scholar]
- 26.Bancroft J, Stevens A, editors. Theory and Practice of Histological Techniques. 2. London, England: Churchill Livingstone; 1982. Connective tissues and stains; pp. 135–179. [Google Scholar]
- 27.Hogan RD, Burke KM, Franklin TD. The effect of ultrasound on microvascular hemodynamics in skeletal muscle: effects during ischemia. Microvasc Res. 1982;23:370–379. doi: 10.1016/s0026-2862(82)80009-5. [DOI] [PubMed] [Google Scholar]
- 28.Young SR, Dyson M. The effect of therapeutic ultrasound on angiogenesis. Ultrasound Med Biol. 1990;16:261–269. doi: 10.1016/0301-5629(90)90005-w. [DOI] [PubMed] [Google Scholar]
- 29.Barrientos S, Stojadinovic O, Golinko MS, Brem H, Tomic-Canic M. Growth factors and cytokines in wound healing. Wound Repair Regen. 2008;16:585–601. doi: 10.1111/j.1524-475X.2008.00410.x. [DOI] [PubMed] [Google Scholar]
- 30.Fry WJ, Fry RB. Temperature changes produced in tissue during ultrasonic irradiation. J Acoust Soc Am. 1953;25:6–11. [Google Scholar]
- 31.Cavicchi TJ, O’Brien WD., Jr Heat generated by ultrasound in an absorbing medium. J Acoust Soc Am. 1984;70:1244–1245. doi: 10.1121/1.391374. [DOI] [PubMed] [Google Scholar]
- 32.Maxwell L. Therapeutic ultrasound: its effects on the cellular and molecular mechanisms of inflammation and repair. Physiotherapy. 1992;78:421–426. [Google Scholar]
- 33.Nussbaum EL. Ultrasound: to heat or not to heat—that is the question. Phys Ther Rev. 1997;2:59–72. [Google Scholar]
- 34.ter Haar G. Therapeutic ultrasound. Eur J Ultrasound. 1999;9:3–9. doi: 10.1016/s0929-8266(99)00013-0. [DOI] [PubMed] [Google Scholar]
- 35.Mariotti M, Maier J, editors. New Frontiers in Angiogenesis. Dordrecht, the Netherlands: Springer; 2006. Angiogenesis: an overview; pp. 2–4. [Google Scholar]
- 36.Ay T, Havux X, Van Camp G. Destruction of contrast microbubbles by ultrasound: effects on myocardial function, coronary perfusion pressure, and microvascular integrity. Circulation. 2001;104:461–466. doi: 10.1161/hc3001.092038. [DOI] [PubMed] [Google Scholar]
- 37.Mizrahi N, Seliktar D, Kimmel E. Ultrasound–induced angiogenic response in endothelial cells. Ultrasound Med Biol. 2007;33:1818–1829. doi: 10.1016/j.ultrasmedbio.2007.05.007. [DOI] [PubMed] [Google Scholar]
- 38.Skyba DM, Price RJ, Linka AZ, Skalak TC, Kaul S. Direct in vivo visualization of intravascular destruction of microbubbles by ultrasound and its local effects on tissue. Circulation. 1998;98:290–293. doi: 10.1161/01.cir.98.4.290. [DOI] [PubMed] [Google Scholar]


