

Abstract
Carbamoyl phosphate synthetase 1 (CPS1) is a liver-specific, intramitochondrial, rate-limiting enzyme in the urea cycle. A previous study showed that CPS1 is the antigen for hepatocyte paraffin 1 antibody, a commonly used antibody in surgical pathology practice; and CPS1 expression appears to be down-regulated in liver cancer tissue and cell lines. The aim of this study is to understand how the CPS1 gene is regulated in liver carcinogenesis. In this report, we show that human hepatocellular carcinoma (HCC) cells do not express CPS1, whereas cultured human primary hepatocytes express abundant levels. In addition, CPS1 was silenced or down-regulated in liver tumor tissues compared with the matched noncancerous tissues. The expression of CPS1 in HCC cells was restored with a demethylation agent, 5-azacytidine. We show that two CpG dinucleotides, located near the transcription start site, and a CpG-rich region in the first intron were hypermethylated in HCC cells. The hypermethylation of the two CpG dinucleotides was also detected in HCC tumor tissues compared with noncancerous tissues. Further molecular analysis with mutagenesis indicated that the two CpG dinucleotides play a role in promoter activity of the CPS1 gene. In conclusion, our study demonstrates that DNA methylation is a key mechanism of silencing CPS1 expression in human HCC cells, and CPS1 gene hypermethylation of the two CpG dinucleotides is a potential biomarker for HCC.
One of the major liver functions is to convert toxic ammonium into the less toxic urea. This function is performed by the urea cycle, which is highly conserved in all mammalian species.1,2 There are five key enzymes in the urea cycle: carbamoyl phosphate synthetase 1 (CPS1), ornithine transcarbamoylase (OTC), argininosuccinate synthetase 1 (ASS1), argininosuccinate lyase (ASL), and arginase 1 (ARG1). In addition, N-acetylglutamic acid (NAG), generated by, N-acetylglutamate synthetase (NAGS), is an activator of CPS1. Deficiency in any of these enzymes leads to high blood ammonium concentration, which can have detrimental effects and may cause anorexia, lethargy, central nervous system dysfunction, brain damage, coma, and even death.3,4 In addition to taking responsibility for ammonia metabolism, the biochemical reactions of the urea cycle also produce three physiologically important metabolites (ie, ornithine, citrulline, and arginine). Moreover most important, the urea cycle and the nitric oxide cycle are linked via ASS1 and ASL. Previous studies5,6 have shown that a quantitative change in urea cycle enzyme expression and function can affect nitric oxide production by limiting substrate availability. Therefore, the abnormalities within the urea cycle result in urea cycle disorder and affect other physiological systems.
CPS1 is the first rate-limiting enzyme in the urea cycle, converting ammonium into carbamoyl phosphate. In 2008, we reported that CPS1 was the antigen for hepatocyte paraffin 1 (Hep Par 1) antibody, a murine monoclonal antibody that is widely used in surgical pathology practice to determine the hepatocellular origin of neoplasms.7 During that study, we noticed that the CPS1 protein was not detectable in human hepatocellular carcinoma (HCC) cell lines while the CPS1 gene is intact. Other researchers8 have reported that 75% of human HCC tissues express low levels of CPS1. However, the underlying mechanisms of CPS1 dysregulation in HCC are completely unknown. In general, dysregulation of gene function could be caused by either gene mutation or epigenetic regulation. Recent studies have suggested that aberrant epigenetic patterns exist in many types of cancer cells. DNA methylation and modifications of the histone tails, including acetylation, methylation, phosphorylation, ubiquitination, sumoylation, proline isomerization, and ADP ribosylation, are the two main biochemical pathways involving epigenetic regulation. DNA methylation has gained importance because of the implication of aberrant DNA methylation in many human diseases.9,10 Furthermore, modifications of DNA methylation seem to be the early events in the loss of cellular homeostasis and may, in some instances, precede genetic mutations and genomic instability.11
Previous studies12–15 have shown that CPS1 transcription is subject to physiological regulation and that CPS1 activity can be inhibited by a hepatotoxic dose of acetaminophen. Studies16,17 have also suggested that an 80-bp glucocorticoid response unit located 6.3 kb upstream of the transcription start site mediates hormone responsiveness and liver-specific expression of CPS1 in rats. A recent study18 revealed that Y-box binding protein-1 negatively regulates CPS1 expression via suppression of CCAAT enhancer-binding protein-α function in fetal and injured adult mouse liver but not in normal adult liver. Nakagawa et al19 demonstrated that sirtuin5, an NAD-dependent protein deacetylase, deacetylates CPS1 and up-regulates its activity during fasting and long-term calorie restriction or a high-protein diet.
In our study, we hypothesize that an altered DNA methylation pattern may play a critical role in the regulation of CPS1 gene expression in human liver cancers. In this report, we present evidence to support the notion that DNA methylation is a key mechanism of epigenetic regulation to suppress CPS1 expression in HCC cells and we identify the precise methylation sites in the CPS1 gene. This study provides an important insight into epigenetic regulation in HCC.
Materials and Methods
Cell Culture and 5-Aza-2′-Deoxycytidine Treatment
The LH86 cells were established in our laboratory and previously published.20 The Huh7 cell line was a gift from Dr. Christopher Seeger (Fox Chase Cancer Center, Philadelphia, PA), and the Huh7.5 cell line was a gift from Dr. Charles M. Rice (Rockefeller University, New York, NY). All cell lines were grown in Dulbecco's modified Eagle medium, supplemented with 10% fetal bovine serum, 800 μmol/L l-glutamine, 10 mmol/L nonessential amino acids, and antibiotics at 37°C in 5% CO2. The primary hepatocytes were obtained from CellzDirect Inc. (Chapel Hill, NC). Cancerous and corresponding noncancerous frozen tissues were collected at Shands Hospital, University of Florida (Gainesville, FL) under an Institutional Review Board-approved protocol. For drug treatment, cell lines were treated with 5 μmol/L 5-aza-2′-deoxycytidine (Aza) (Sigma, St Louis, MO) for 3 days, changing Aza and medium every 24 hours. Control cells were incubated with culture medium.
RNA Extraction, RT-PCR, and Quantitative Real-Time PCR
RNA was extracted from cells or patient tissues using an RNA isolation reagent (TRIzol; Invitrogen, Carlsbad, CA). To prevent DNA contamination, total RNA was treated with RNase-free DNase II (Invitrogen). The human glyceraldehyde-3-phosphate dehydrogenase gene (forward primer, 5′-TCACCAGGGCTGCTTTTA-3′; and reverse primer, 5′-TTCACACCCATGACGAACA-3′) was used as an internal control in PCR amplification. A two-step RT-PCR procedure was performed in all experiments. First, total RNA samples (2 μg per reaction) were reversely transcribed into cDNAs by RT II reverse transcriptase (Invitrogen). Then, the cDNAs were used as templates in PCR with CPS1 gene-specific primers (ie, 5′-TTTAGGGCAATGGCTACAGG-3′ and 5′-GTTCTGCAAGAGCTGGGTTC-3′). The primers for hepatocyte nuclear factor 3β (HNF3β) were 5′-CACCACTACGCCTTCAACCAC-3′ and 5′-GGTAGTAGGAGGTATCTGCGG-3′. The primers for α-1 antitrypsin (AAT) were 5′-GGGTCAACTGGGCATCACTA-3′ and 5′-GGGGATAGACATGGGTATGG-3′. The primers that were used for amplification of other urea genes were as follows: NAGS, 5′-AGCGAATGCTACGGGTGCG-3′ (forward) and 5′-CAGTCCCTTGGCGTGGTTGA-3′ (reverse); OTC, 5′-CTGATTACCTCACGCTCC-3′ (forward) and 5′-TCTCCTCTTCTCGTCCCA-3′ (reverse); ASS1, 5′-CAACACCCCTGACATTCTCG-3′ (forward) and 5′-ACTTTCCCTTCCACTCGCTC-3′ (reverse); ASL, 5′-TCCCAGCACCTACAACAAAGA-3′ (forward) and 5′-TAGTCCCACACGCAGATCACG-3′ (reverse); and ARG1, 5′-TGATGTGAAGGATTATGGGG-3′ (forward) and 5′-TGGTTGTCAGTGGAGTGTTG-3′ (reverse). The amplification reactions were performed using AmpliTaq Gold DNA polymerase (Applied Biosystems, Foster City, CA). The PCR was programmed as follows: 2 minutes at 95°C and 30 to 32 cycles of 30 seconds at 94°C, 30 seconds at 58°C to 62°C, and 30 seconds at 72°C, with an extension for 10 minutes at 72°C. The PCR bands were visualized under UV light and photographed. Quantitative real-time PCR was used to measure mRNA levels of urea cycle genes for HCC cell lines and CPS1 mRNA levels for tissues on a StepOne Plus real-time PCR system with SYBR Green MasterMix (Applied Biosystems).
Bisulfite Genomic Sequencing
Genomic DNA was purified from cells with a kit (Wizard Genomic DNA Purification Kit; Promega, Madison, WI). DNA (2 μg) was bisulfite modified with another kit (EZ DNA Methylation Direct Kit; Zymo Research, Orange, CA). Sequence-specific primers to amplify the CpG-rich regions of interest were designed using a computer program (MethPrimer; http://www.urogene.org/methprimer). The primers that were used for amplification were as follows: CPS1 upstream CpG island, 5′-TTTGAGATGGAGTTTGGTTTTG-3′ (forward) and 5′-TTACCAATCCATAAAACTTATATC-3′ (reverse); CPS1 promoter, 5′-DNA Methylation Suppresses CPS1 in HCC GGAAATTTAAAG-3′ (forward) and 5′-ACCACTTTAAAAACTATCAAAATC-3′ (reverse); and CPS1 CpG island in first intron, 5′-TTAGGTTGGAGTGTAGTGTTG-3′ (forward) and 5′-TTACAAATATAAACCACCAAACT-3′ (reverse). The PCR products were amplified, purified, and cloned into a vector (pGEM-T Easy Vector; Promega). Clones were selected through blue-white screening. Finally, the colonies harboring the insert were sequenced in a 96-well plate using the M13 reverse and/or forward primers.
Methylation-Specific PCR
The bisulfite-treated DNA was amplified using primers that specifically amplify either the methylated or unmethylated sequence of CPS1 promoter containing two CpG dinucleotides. The primers for the methylated reaction were 5′-ATGGAAATTTAAAGATCGTTGTGTA-3′ and 5′-TCAAAATCCTCGTCATTTTAATAAT-3′. The primers for the unmethylated reaction were 5′-GAATGGAAATTTAAAGATTTGTT-3′ and 5′-AAATCCTCATCATTTTAATAAT-3′. The PCR was performed for 40 cycles, with annealing temperatures of 58°C for the methylated reaction and 52°C for the unmethylated reaction. The human methylated and unmethylated DNA was used as control to verify the specificity of the primers (QIAGEN, Valencia, CA).
Cloning and Plasmid Construction
A region (−400/145) of the CPS1 gene (GenBank accession number GI: 157696424; gene ID: 1373) was amplified by PCR using specific primers [5′-CCGGGTACCAGAACATTGTCTTTTTACCCC-3′ (forward) and 5′-CCCAAGCTTTTTGAAAGCTGTCAAAATCCTCGTCTTTG-3′ (reverse)] and genomic DNA extracted from Huh7 cells as template. The PCR product was purified and inserted into pGL3-basic vector (Promega) through KpnI and HindIII sites to generate a reporter construct named pGL3-CPS1 545. The plasmid was sequenced using a sequencing primer (RVprimer3). To determine the methylation status of CG dinucleotides located at −9 and 125 of CPS1 in pGL3-CPS1 545, the plasmid was linearized by BamHI digestion and bisulfite treated, followed by PCR amplification of the promoter and DNA sequencing. The bisulfite genomic sequencing primers for CPS1 promoter were used for PCR and sequencing (forward, 5′-GTAGAATGAATGGAAATTTAAAG-3′; and reverse, 5′-ACCACTTTAAAAACTATCAAAATC-3′). The two CG dinucleotides located at the −9 and 125 sites of CPS1 in pGL3-CPS1 545 were not methylated at transfection. The wild-type two CG dinucleotides were mutated to CA when the 545-bp fragment was synthesized (GeneArt, Burlingame, CA). The fragment was inserted into the same sites of the pGL3-basic vector to generate pGL3-CPS1 545m, as previously described.
To detect CPS1 function in ammonium clearance, we cloned the full-length CPS1 gene from a normal liver tissue. In brief, RNA was extracted from the liver tissue using an RNA isolation reagent (TRIzol; Invitrogen). The cDNA was synthesized using RT II reverse transcriptase (Invitrogen), and 2 μL of cDNA was used for PCR amplification. The CPS1 gene was amplified with primers (5′-ATGCGGCCGCAGCCACAAATCATCTTCAAAA-3′ and 5′-CGTCTAGATGAGAAAGTTGTGAATCAGTTCC-3′) at 94°C for 3 minutes, followed by 38 cycles of 94°C for 40 seconds, 68°C for 30 seconds, and 72°C for 5 minutes, and finished with an extension at 72°C for 10 minutes. The PCR product was then purified and cloned into a vector (pEF6/V5-His-TOPO). The expression vector (pTOPO-CPS1) was sequenced using a kit (BigDye Terminator V3.1 Kit; Applied Biosystems).
Luciferase Assay
The LH86 and Huh7.5 cells were transfected with 0.6 μg of firefly luciferase reporter plasmid and 0.05 μg of control plasmid containing renilla luciferase (pRL-TK; Promega). A promoterless basic vector (pGL3; Promega) was used as a negative control. To confirm the efficiency of transfection (Lipofectin; Invitrogen), a luciferase expression vector (pGL3-control; Promega) was used as a positive control. When indicated, the firefly and renilla luciferase activities were measured using a system (Dual-Luciferase Reporter Assay System; Promega), according to the manufacturer's instructions. The renilla luciferase activity of pRL-TK was used to normalize the firefly luciferase activity of the reporter construct.
Cell Proliferation Assay
The stable cell lines (LH86-pTOPO or LH86-pTOPO-CPS1) were dispensed into 96-well plates at a final concentration of 3 × 10³ cells/well and incubated overnight before treatment. Media were removed and replaced with new medium with or without ammonium. The final concentration of ammonium was 20 and 50 mmol/L, respectively. After 24 and 48 hours of treatment, cell viability was measured using the MTS cell proliferation assay (Promega). Cells were incubated for 3 hours after the addition of MTS/phenylmethylsulfonyl solution to allow for color development, and then the absorbance values were read at 492 nm using a plate reader (Multiscan).
Western blot analysis was performed as previously described.7
Results
Characterization of CPS1 Expression in HCC Cell Lines, Primary Hepatocytes, and Liver Cancer Tissues
A previous study7 demonstrated that human liver cancer cell lines have undetectable CPS1 protein expression. To understand the potential mechanisms by which CPS1 is regulated in HCC, we decided to characterize CPS1 expression levels at the transcription level in HCC cell lines, primary hepatocytes, and human HCC tissues using the RT-PCR approach. The results show that CPS1 was silenced in all three HCC cell lines (ie, Huh7, Huh7.5, and LH86) but was expressed at high levels in the primary hepatocyte cultures obtained from five different patients (Figure 1A). We then examined CPS1 mRNA expression in three pairs of patient tissues. The CPS1 expression was undetectable in tumor tissues compared with the matched noncancerous tissues after 32 cycles of PCR amplification (Figure 1B). All three cancer tissues exhibit poorly differentiated histological features. To further examine CPS1 expression in more HCC clinical samples, CPS1 mRNA expression was analyzed by quantitative real-time RT-PCR in human normal liver tissues and in 36 paired samples obtained from patients with HCC, including tumor tissues and adjacent noncancerous liver tissues. As shown in Figure 1C, a strong CPS1 mRNA signal could be detected in the two normal liver samples. To demonstrate the expression ratios between tumor tissue and nontumor tissue, we summarized the tumor tissue/normal tissue ratio in Figure 1D. As shown in the graph, CPS1 mRNA was detected in 29 cases with significantly lower levels (tumor tissue/normal tissue ratio, <1) than in noncancerous liver tissues [29 (80.6%) of 36]. Of tumor tissues, 15 (41.7%) of 36 showed CPS1 mRNA tumor tissue/normal tissue ratios of less than 0.048. All these cases are histologically poorly differentiated HCCs. Seven (19.4%) of the tumor samples had an increase of CPS1 expression compared with that in adjacent noncancerous specimens, and all these cases are well-differentiated HCCs. To correlate the mRNA transcription with protein expression, Western blot analysis was performed to examine the CPS1 protein expression in primary hepatocytes, LH86 cells, and patient tissues. As shown in Figure 1E, CPS1 protein was abundantly expressed in primary hepatocytes and nontumor liver tissue but was undetectable in LH86 cells and at relatively low levels in some of the examined HCC tumor tissues (Figure 1E, lanes 4, 12, 14, and 22). Overall, the protein expression profile detected by Western blot analysis matches that of the mRNA profile detected by quantitative RT-PCR (Figure 1C). The data suggest that CPS1 expression is suppressed at the gene transcriptional level in most HCCs, especially poorly differentiated HCCs.
Figure 1.
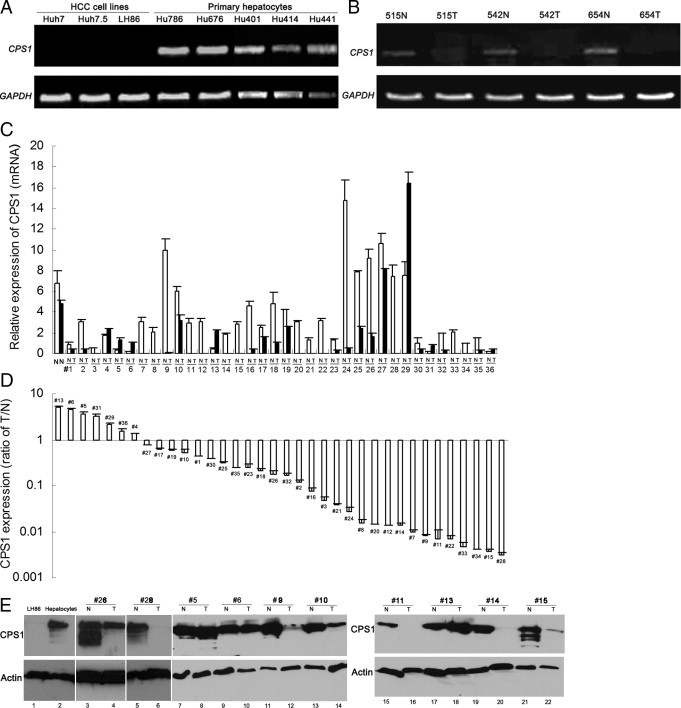
Altered CPS1 expression in HCCs. A: RT-PCR analysis of CPS1 expression in HCC cell lines (ie, Huh7, Huh7.5, and LH86) and in normal primary hepatocyte cultures (ie, Hu786, Hu676, Hu401, Hu414, and Hu441). B: RT-PCR analysis of CPS1 expression in HCC tumor tissues (T) and matched nontumor liver tissues (N). The number represents deidentified case codes. Glyceraldehyde-3-phosphate dehydrogenase (GAPDH) was used as an internal control for normalization. C: Quantitative RT-PCR analysis of CPS1 transcripts in two normal liver tissues and 36 paired N and T. The number represents deidentified case codes. All data were normalized to GAPDH mRNA levels. Data are shown as the mean ± SD (n = 3). D: The ratio of CPS1 expression level between T and matched N. E: Western blot analysis of cellular extracts from cultured cells and patient tissues using Hep Par 1 antibody. Lane 1 indicates LH86 cells; 2, primary hepatocyte culture; and 3 through 22, paired N and T. Actin serves as an internal control.
CPS1 Expression Is Regulated by DNA Methylation in HCC Tumor Cells
We found that HCC cancer cell lines (ie, Huh7, Huh7.5, and LH86) express AAT and HNF3β, two liver-specific proteins (Figure 2), suggesting that the basic liver-specific transcription machinery is functional in these cell lines. The loss/lower expression of CPS1 is unlikely because of the inadequate liver-specific transcription system in these cells. Thus, it is possible that CPS1 expression is regulated by epigenetic modification because many cancer cells exhibit aberrant epigenetic regulation. To test this hypothesis, we treated the HCC cell lines LH86 and Huh7 with a demethylating agent, Aza, followed by RNA extraction and RT-PCR assay. As shown in Figure 3A, the expression of CPS1 mRNA was induced on treatment in both cell lines. To confirm that DNA methylation regulates CPS1 expression, detailed methylation analysis of the CPS1 gene sequence was performed using genomic DNA extracted from these cells. Sequence analysis (GenBank accession number GI: 157696424; http://www.ncbi.nlm.nih.gov/mapview) indicates that the CPS1 promoter does not have typical CpG islands, but there are two CpG dinucleotides (−9 and 125) that are located near the transcription start site (1) and two other CpG-rich regions. One CpG-rich region is 20 kb upstream of the promoter (−20267 to −19935 relative to the transcription start site), and the other CpG-rich region is located in the first intron (7804 to 8125 relative to the transcription start site). As shown in Figure 3B, the results revealed that two CpG dinucleotides near the transcription start site were strongly methylated in tumor cells but hypomethylated in normal primary hepatocytes. The methylation frequency of the upstream CpG-rich region (−20267 to −19935) was more than 90% in both normal hepatocytes and HCC cell lines (Figure 3C). The methylation of the CpG-rich region in the first intron showed a significant difference between normal primary hepatocytes and tumor cell lines. The methylation frequencies are 50.7% in Hu676, 65.6% in Hu786, 91.7% in Huh7, and 93.7% in LH86 (Figure 3D). The results suggest that hypermethylation of the two CpG dinucleotides (−9 and 125) in the promoter region and in the first intron (7804 to 8125) may play a direct role in the transcription silencing of CPS1 in liver tumor cells, whereas the upstream CpG-rich region is unlikely to be important in controlling CPS1 expression.
Figure 2.
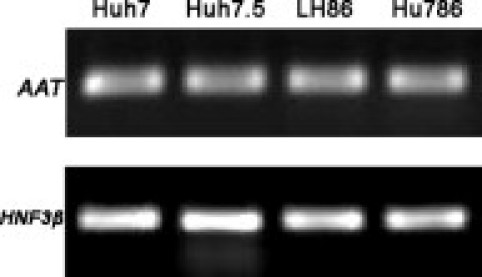
The HNF3β and AAT mRNA expression levels in HCC cells. The HNF3β and AAT mRNA expression levels were analyzed by RT-PCR in HCC cell lines (ie, Huh7, Huh7.5, and LH86) and in primary hepatocyte culture (ie, Hu786).
Figure 3.
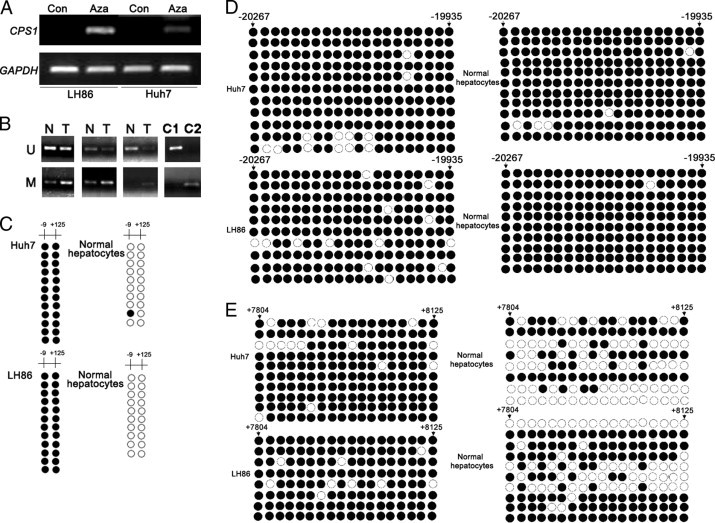
Regulation of CPS1 expression by DNA methylation in HCCs. A: The reactivation of CPS1 gene expression by a demethylation agent in liver cancer cell lines. LH86 and Huh7 were treated with or without Aza, and CPS1 expression was examined by RT-PCR. Glyceraldehyde-3-phosphate dehydrogenase (GAPDH) was used as an internal control of the RT-PCR for normalization. B: Methylation-specific PCR analysis of CPS1 promoter in liver cancer tissues. M indicates methylated specific reaction; U, unmethylated specific reaction; C1, unmethylated control human DNA; C2, methylated control human DNA. C through E: Genomic DNA extracted from normal primary hepatocytes (ie, Hu676 and Hu786) and tumor cells (ie, Huh7 and LH86) was modified with sodium bisulfate, followed by PCR amplification, cloning, and sequencing. The DNA methylation status at each CpG site within three regions is shown. Methylated sites are indicated by filled dark circles; and unmethylated sites, empty white ones.
To determine whether CPS1 promoter methylation is relevant to CPS1 expression control in clinical specimens, we performed methylation-specific PCR and compared the promoter methylation status in three tumor tissues with that in paired noncancerous tissues. Methylation of the two CpG dinucleotides in the promoter region was detectable in both the tumor tissues and paired noncancerous samples; however, methylation in noncancerous tissues is much less intense (Figure 3E). By contrast, the unmethylated promoter was easily detected in noncancerous tissues. The methylation status in the promoter region appears to be correlated with CPS1 expression levels in normal or tumor tissues.
Effect of the Two CpG Dinucleotides on CPS1 Promoter Activity
To investigate the possible effect of methylation of the two CpG dinucleotides (−9 and 125) on promoter activity, we first performed bisulfite genomic sequencing to confirm that the two CpG dinucleotides could be demethylated on Aza treatment in HCC cells. As shown in Figure 4A, methylation of these two sites was dramatically reduced after Aza treatment of the tumor cells. To determine the functional significance of the two CpG dinucleotides, we generated a reporter gene construct using a CPS1 promoter sequence (545 bp) containing both CpG dinucleotides. The reporter construct (pCPS1-545) together with pRL-TK renilla luciferase expression vector were transiently transfected in LH86 and Huh7.5 cells, followed by Aza treatment. The promoter activity was determined by luciferase assay. Firefly and renilla luciferase activities were measured at the point indicated. Renilla luciferase activity was used to normalize firefly luciferase activity of the reporter constructs. As shown in Figure 4B, Aza treatment caused a significant increase in promoter activity in both cell lines. Luciferase activity of pGL3-basic, which has no promoter element, was not affected by Aza treatment. The two CpG dinucleotides in the plasmid were not methylated at transfection. After plasmid transfection into the cells, methylation of the −9 binucleotides occurred as measured by DNA bisulfite sequencing analysis (data not shown). To determine the functional significance of the CpG sites on promoter activity, we introduced mutations in the CG site of pCPS1-545 (ie, two CGs were changed to CA), which eliminates the CpG methylation sites. The mutant plasmid exhibits much enhanced activity compared with the wild-type plasmid (Figure 4C). Thus, the data suggest that the two CG dinucleotides near the transcription start site appear to be critical for CPS1 promoter activity.
Figure 4.
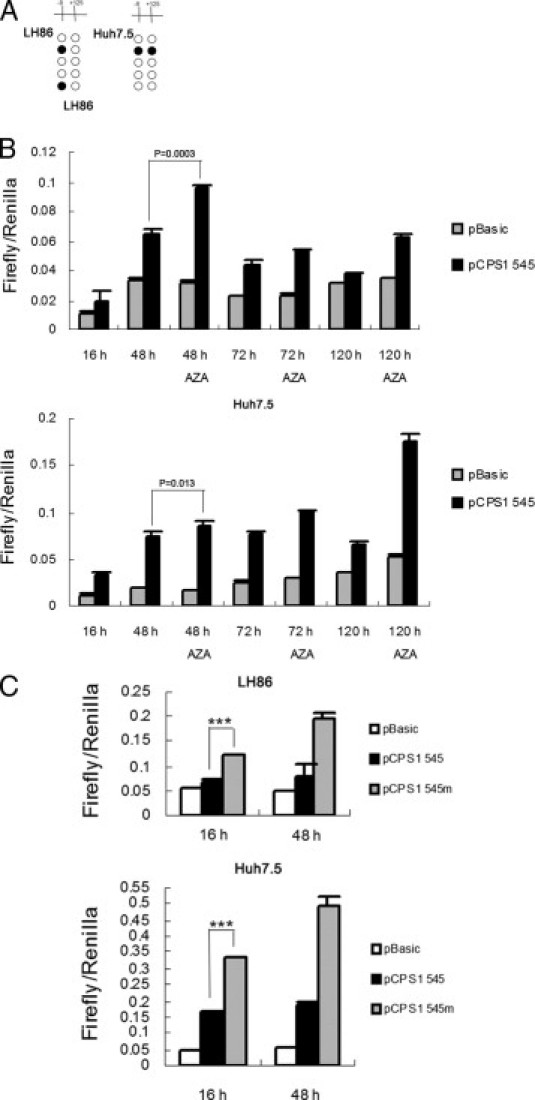
Functional characterization of the two CG dinucleotides in CPS1 promoter. A: LH86 and Huh7.5 cells were treated with 5 μmol/L Aza and harvested for genomic DNA extraction on 5 days of treatment. Bisulfite genomic sequencing of the CPS1 promoter [−400/145 relative to the transcription start site (+1)] was performed. The frequency of methylation at two CpG dinucleotides within the promoter is shown. B: Luciferase reporter assay of CPS1 minimal promoter activity. The LH86 and Huh7.5 cells were transfected with 600 ng of reporter gene plasmid (pGL3-CPS1 545), together with 50 ng of pRL-TK renilla luciferase plasmid (as an internal control). Twenty-four hours after transfection, the cells were treated with or without Aza for another 24, 48, or 96 hours. The cells were harvested, and luciferase activity was determined using a kit (Dual Luciferase). The data are presented as mean ± SD from three independent experiments in each cell line. C: Mutation of two CpG dinucleotides in the promoter increases CPS1 promoter activity. The LH86 and Huh7.5 cells were cotranfected with renilla luciferase vector and pGL3 CPS1-545, pGL3 CPS1-545m, or pGL3-basic control vector for 16 and 48 hours. The cells were harvested, and luciferase activity was determined using a kit (Dual Luciferase). The data are presented as mean ± SD from three independent experiments in each cell line. ***P < 0.001.
Function of CPS1 in Ammonium Metabolism
Because CPS1 is the essential enzyme for the urea cycle, it is uncertain how tumor cells function in the absence of this enzyme. The two key functions of the urea cycle are to metabolize ammonia and to generate an amino acid (ie, arginine). To investigate the function of CPS1 in ammonium clearance, we cloned CPS1 cDNA from a normal liver tissue. To restore CPS1, LH86 cells were transfected with the full-length CPS1 cDNA construct; and stable cells were selected by blasticidin. The CPS1 expression in the stable cells was confirmed by Western blot analysis. Because CPS1 is the Hep Par 1 antigen, CPS1 protein can be detected by both Hep Par 1 antibody and anti-CPS1 antibody (Figure 5A). Next, we investigated the effects of CPS1 expression on the proliferation of LH86 cells. Stable expression of CPS1 resulted in a significant increase in cell numbers compared with the empty vector (pTOPO) control 1 or 2 days after seeding an equal number of cells (Figure 5B). The CPS1 gene is one of the urea cycle genes that converts toxic ammonium into less toxic urea, which may offer a better capacity for cell growth. This hypothesis is supported by experiments on ammonia metabolism. When LH86 cells were treated with ammonia at 20 or 50 mmol/L, we found that the number of cells, both LH86-pTOPO and LH86-pTOPO CPS1, was significantly reduced compared with the untreated culture (Figure 5C). However, the survival percentage of CPS1-transfected cells was much higher than that of LH86-pTOPO controls, indicating that CPS1 expression renders the cells to metabolize the toxic ammonium.
Figure 5.
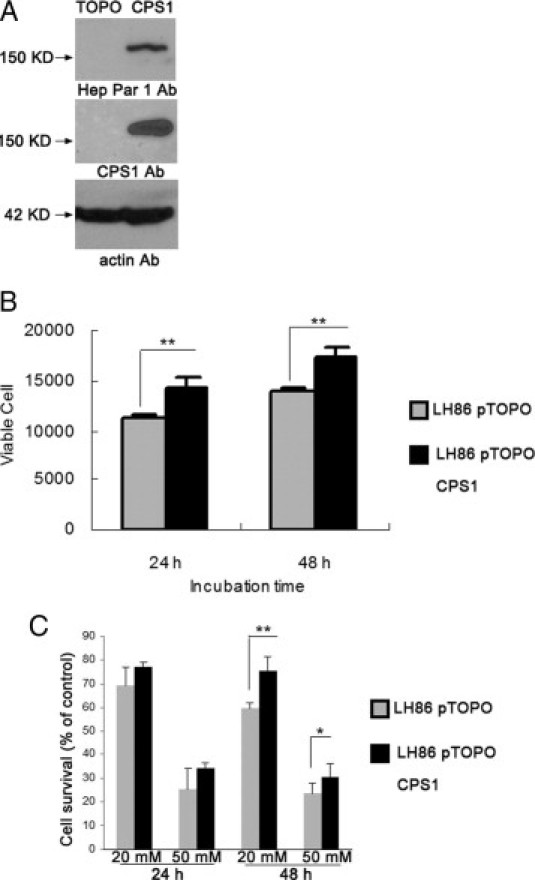
The function of CPS1 in ammonium metabolism. A: Western blot analysis of samples prepared from LH86-pTOPO control cells and from LH86-pTOPO CPS1 cells using antibodies specific against CPS1 or Hep Par 1. Actin was used as the loading control. B: The expression of CPS1 increases LH86 proliferation. C: The effects of ammonium on cell viability of LH86 cells determined by the MTS assay. LH86 was exposed to ammonium at a concentration of 20 and 50 mmol/L for 24 and 48 hours, respectively. Results are presented as the mean ± SD from three independent experiments. *P < 0.05, **P < 0.01.
Expression of Other Urea Cycle Genes in Primary Hepatocytes and HCC Cells
Although the key enzyme of the urea cycle, CPS1, is silent in HCC cell lines, it is interesting to know if other enzymes in the urea cycle are also silent in these cells (Figure 6A). Total RNA was extracted from LH86, Huh7, and primary hepatocytes, followed by a semiquantitative RT-PCR assay using gene-specific primers. As shown in Figure 6B, other urea cycle-related genes (ie, ASS1, ARG1, OTC, ASL, and the CPS1 cofactor gene NAGS) were expressed in HCC cells and in normal primary hepatocytes. However, the expression level of OTC was significantly reduced in HCC cells compared with primary hepatocytes. The mRNA levels of these genes were also detected by quantitative real-time PCR. The results of quantitative real-time PCR were consistent with those of regular RT-PCR (Figure 6C).
Figure 6.
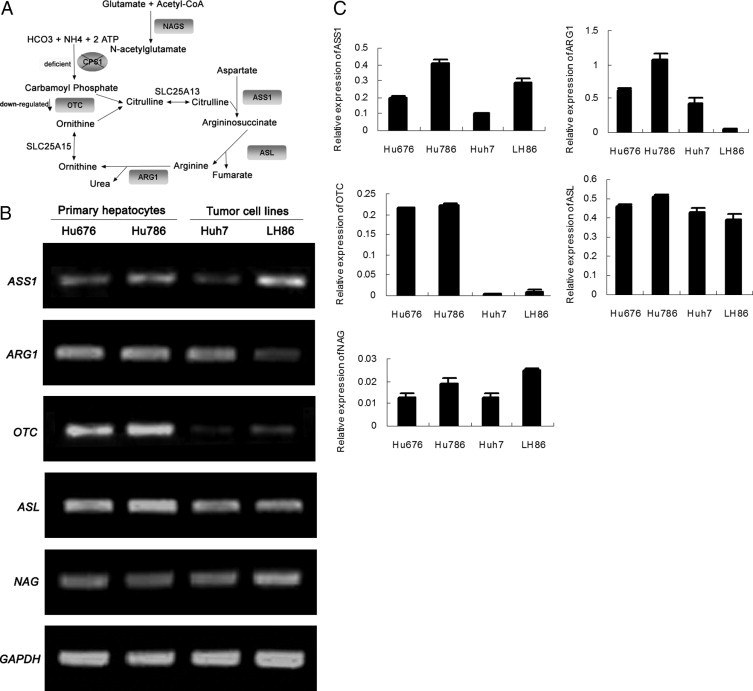
Expression of urea cycle–related genes in primary hepatocytes and HCC cell lines. A: A diagram of the urea cycle. The key enzymes in the urea cycle are shown in the shadowed box. B: Expression of urea cycle–related genes was determined by RT-PCR. RNA was prepared from Hu676, Hu786, LH86, and Huh7 cells. Glyceraldehyde-3-phosphate dehydrogenase (GAPDH) was used as an internal control. C: The mRNA of the urea cycle gene was amplified by SYBR Green quantitative RT-PCR, and all values were normalized to GAPDH. CPS1, carbamoyl-phosphate; OTC, ornithine transcarbamoylase; ASS1, argininosuccinate synthetase 1; ASL, argininosuccinate lyase; ARG1, arginase 1; NAGS, N-acetylglutamate synthetase.
Discussion
Human hepatocellular carcinoma is one of the most common cancers worldwide and accounts for approximately 90% of primary liver cancers. The development of HCC results from a multistep process beginning with the accumulation of genetic and epigenetic alterations in regulatory genes.21 In general, cancer cells have global hypomethylation, but they have hypermethylation in some specific genes. DNA hypermethylation in promoter regions is associated with silencing of tumor suppressor genes because of direct or indirect prevention to accessing transcription factors in the promoter region.22 Recent studies21,23,24 have demonstrated that CpG island hypermethylation, via silencing of key cancer-related genes, plays a major causal role in cancer, including HCC.
Our study of CPS1 gene methylation provides a novel insight into the epigenetic regulation in HCC. The urea cycle is the primary means of nitrogen metabolism in humans and other ureotelic organisms. It regulates the concentration of ammonia in the systemic circulation, maintaining blood ammonium levels in the low 50 to 100 μmol/L range. The antigen for Hep Par 1 antibody, CPS1, is the first key enzyme in the urea cycle. Loss of CPS1 expression abolishes the urea cycle. The expression of CPS1 is generally diminished in HCC.8 In our study, it is clear that CPS1 expression is suppressed in HCC cells and tumor tissues. Because CPS1 expression is liver specific, one potential reason for the down-regulation is probably because of loss of hepatocellular differentiation in HCC, thus the reduction of liver-specific transcription factors. To exclude this possibility, we examined the expression of other liver-specific genes (eg, HNF3β and AAT). These genes are adequately expressed in these cell lines. Moreover, CPS1 expression in HCC-derived cells can be restored by treatment with the demethylating agent Aza. We demonstrate further that the methylation status of the CpG-rich region in the first intron and two CpG dinucleotides in the promoter region are correlated with CPS1 gene expression in HCC cell lines and hepatocytes. Consistently, mutations of CpG dinucleotides in the promoter region, which eliminates the methylation site, enhance the CPS1 promoter activity in a reporter assay in the HCC cell lines we tested. Taken together, these observations indicate that DNA methylation regulates CPS1 expression in liver cancer cells.
Most studies investigating the mechanism that regulates gene expression by CpG methylation focus on CpG islands in the promoter. In our study, we found that the CPS1 promoter region does not have traditional CpG islands. Instead, two CpG dinucleotides near the transcription start site are critical for CPS1 promoter activity; and their methylation status is closely associated with CPS1 expression in human hepatocytes or HCC cells. A similar phenomenon was reported by several other groups, which have shown that DNA methylation is important for the regulation of non-CpG island promoters. For example, a previous study25 showed that tissue-specific expression of MASPIN is regulated by DNA methylation, which does not contain a CpG island within its promoter. Another study26 demonstrated that the methylation of CpG sites in the Oct-4 enhancer/promoter region strongly affects its expression level. Further studies are required to explore the mechanisms involved in the repression of CPS1 gene expression by DNA methylation. It should be interesting to answer the following questions: Does CpG methylation directly inhibit transcription factors from binding to cis-elements in the CPS1 promoter? If so, what is the transcription factor involved in this process? Is there a communication between DNA methylation and histone acetylation in regulation of CPS1 gene expression?
From a cancer biology point of view, our finding on CPS1 methylation raises an important question: Why is the urea cycle, an important physiological pathway for eliminating ammonia and generating essential amino acids, abolished in liver cancer cells? To attempt to answer this question, we overexpressed the CPS1 gene in HCC cell lines and examined its effect on cell phenotype. The HCC cells with CPS1 expression promote tumor cell proliferation, which may be related to clearance of toxic ammonium by a restored urea cycle, as our experiment demonstrated (Figure 5C). The restoration of CPS1 can establish the urea cycle because all of the other urea cycle-related genes are expressed in HCC cells, including NAGS. A lack of urea cycle actually places the tumor cells at a disadvantage in terms of dealing with ammonia. It may also deprive the cell's ability to generate arginine. A previous report27 did show that liver cancer cells could not grow in arginine-deficient medium. From these observations, we believe that CPS1 suppression/DNA methylation may be related to global aberrant DNA methylation status in the tumor cells. The underlying mechanisms for these changes remain to be determined. Nevertheless, methylation of the CPS1 gene can, at least, serve as a surrogate marker to reflect the DNA methylation status in HCC cells; therefore, it can serve as a biomarker for HCC diagnosis. We also observed that cirrhotic liver tissues have lower expression of CPS1 than normal liver tissues. It is potentially more important to use CPS1 methylation as an early biomarker for HCC. In addition, the lack of a urea cycle and the inability of producing arginine can be used as potential targets for HCC therapy.
In summary, we found that the urea cycle is abolished in HCC through DNA methylation of the first rate-limiting enzyme, CPS1. The important methylation sites are identified near the promoter region of the CPS1 gene. Our findings provide new means for developing better diagnostic tests and more effective therapies for HCC.
Acknowledgments
We thank Haizhen Zhu, Ph.D., Lucy Zhang, B.S., and Robin Foss, B.S., for technical support and members of Liu laboratory for helpful discussions and comments.
Footnotes
Supported in part by National Institutes of Health grants R01CA133086 and K26RR023976 (C.L.).
References
- 1.Morris S.M., Jr Regulation of enzymes of urea and arginine synthesis. Annu Rev Nutr. 1992;12:81–101. doi: 10.1146/annurev.nu.12.070192.000501. [DOI] [PubMed] [Google Scholar]
- 2.Schofield J.P. Molecular studies on an ancient gene encoding for carbamoyl-phosphate synthetase. Clin Sci (Lond) 1993;84:119–128. doi: 10.1042/cs0840119. [DOI] [PubMed] [Google Scholar]
- 3.Mian A., Lee B. Urea-cycle disorders as a paradigm for inborn errors of hepatocyte metabolism. Trends Mol Med. 2002;8:583–589. doi: 10.1016/s1471-4914(02)02437-1. [DOI] [PubMed] [Google Scholar]
- 4.Batshaw M.L. Hyperammonemia. Curr Probl Pediatr. 1984;14:1–69. doi: 10.1016/0045-9380(84)90047-1. [DOI] [PubMed] [Google Scholar]
- 5.Canter J.A., Summar M.L., Smith H.B., Rice G.D., Hall L.D., Ritchie M.D., Motsinger A.A., Christian K.G., Drinkwater D.C., Jr, Scholl F.G., Dyer K.L., Kavanaugh-McHugh A.L., Barr F.E. Genetic variation in the mitochondrial enzyme carbamyl-phosphate synthetase I predisposes children to increased pulmonary artery pressure following surgical repair of congenital heart defects: a validated genetic association study. Mitochondrion. 2007;7:204–210. doi: 10.1016/j.mito.2006.11.001. [DOI] [PMC free article] [PubMed] [Google Scholar]
- 6.Barr F.E., Tirona R.G., Taylor M.B., Rice G., Arnold J., Cunningham G., Smith H.A., Campbell A., Canter J.A., Christian K.G., Drinkwater D.C., Scholl F., Kavanaugh-McHugh A., Summar M.L. Pharmacokinetics and safety of intravenously administered citrulline in children undergoing congenital heart surgery: potential therapy for postoperative pulmonary hypertension. J Thorac Cardiovasc Surg. 2007;134:319–326. doi: 10.1016/j.jtcvs.2007.02.043. [DOI] [PubMed] [Google Scholar]
- 7.Butler S.L., Dong H., Cardona D., Jia M., Zheng R., Zhu H., Crawford J.M., Liu C. The antigen for Hep Par 1 antibody is the urea cycle enzyme carbamoyl phosphate synthetase 1. Lab Invest. 2008;88:78–88. doi: 10.1038/labinvest.3700699. [DOI] [PubMed] [Google Scholar]
- 8.Siddiqui M.T., Saboorian M.H., Gokaslan S.T., Ashfaq R. Diagnostic utility of the HepPar1 antibody to differentiate hepatocellular carcinoma from metastatic carcinoma in fine-needle aspiration samples. Cancer. 2002;96:49–52. [PubMed] [Google Scholar]
- 9.Feinberg A.P., Ohlsson R., Henikoff S. The epigenetic progenitor origin of human cancer. Nat Rev Genet. 2006;7:21–33. doi: 10.1038/nrg1748. [DOI] [PubMed] [Google Scholar]
- 10.Jones P.A., Baylin S.B. The fundamental role of epigenetic events in cancer. Nat Rev Genet. 2002;3:415–428. doi: 10.1038/nrg816. [DOI] [PubMed] [Google Scholar]
- 11.Ellis L., Atadja P.W., Johnstone R.W. Epigenetics in cancer: targeting chromatin modifications. Mol Cancer Ther. 2009;8:1409–1420. doi: 10.1158/1535-7163.MCT-08-0860. [DOI] [PubMed] [Google Scholar]
- 12.Nyunoya H., Broglie K.E., Widgren E.E., Lusty C.J. Characterization and derivation of the gene coding for mitochondrial carbamyl phosphate synthetase I of rat. J Biol Chem. 1985;260:9346–9356. [PubMed] [Google Scholar]
- 13.Adcock M.W., O'Brien W.E. Molecular cloning of cDNA for rat and human carbamyl phosphate synthetase I. J Biol Chem. 1984;259:13471–13476. [PubMed] [Google Scholar]
- 14.Tillman J.B., Dhahbi J.M., Mote P.L., Walford R.L., Spindler S.R. Dietary calorie restriction in mice induces carbamyl phosphate synthetase I gene transcription tissue specifically. J Biol Chem. 1996;271:3500–3506. doi: 10.1074/jbc.271.7.3500. [DOI] [PubMed] [Google Scholar]
- 15.Gupta S., Rogers L.K., Taylor S.K., Smith C.V. Inhibition of carbamyl phosphate synthetase-I and glutamine synthetase by hepatotoxic doses of acetaminophen in mice. Toxicol Appl Pharmacol. 1997;146:317–327. doi: 10.1006/taap.1997.8228. [DOI] [PMC free article] [PubMed] [Google Scholar]
- 16.Christoffels V.M., Grange T., Kaestner K.H., Cole T.J., Darlington G.J., Croniger C.M., Lamers W.H. Glucocorticoid receptor: C/EBP, HNF3, and protein kinase A coordinately activate the glucocorticoid response unit of the carbamoylphosphate synthetase I gene. Mol Cell Biol. 1998;18:6305–6315. doi: 10.1128/mcb.18.11.6305. [DOI] [PMC free article] [PubMed] [Google Scholar]
- 17.Hoogenkamp M., Gaemers I.C., Schoneveld O.J., Das A.T., Grange T., Lamers W.H. Hepatocyte-specific interplay of transcription factors at the far-upstream enhancer of the carbamoylphosphate synthetase gene upon glucocorticoid induction. FEBS J. 2007;274:37–45. doi: 10.1111/j.1742-4658.2006.05561.x. [DOI] [PubMed] [Google Scholar]
- 18.Chen Y.R., Sekine K., Nakamura K., Yanai H., Tanaka M., Miyajima A. Y-box binding protein-1 down-regulates expression of carbamoyl phosphate synthetase-I by suppressing CCAAT enhancer-binding protein-alpha function in mice. Gastroenterology. 2009;137:330–340. doi: 10.1053/j.gastro.2009.02.064. [DOI] [PubMed] [Google Scholar]
- 19.Nakagawa T., Lomb D.J., Haigis M.C., Guarente L. SIRT5 deacetylates carbamoyl phosphate synthetase 1 and regulates the urea cycle. Cell. 2009;137:560–570. doi: 10.1016/j.cell.2009.02.026. [DOI] [PMC free article] [PubMed] [Google Scholar]
- 20.Zhu H., Dong H., Eksioglu E., Hemming A., Cao M., Crawford J.M., Nelson D.R., Liu C. Hepatitis C virus triggers apoptosis of a newly developed hepatoma cell line through antiviral defense system. Gastroenterology. 2007;133:1649–1659. doi: 10.1053/j.gastro.2007.09.017. [DOI] [PubMed] [Google Scholar]
- 21.Tischoff I., Tannapfe A. DNA methylation in hepatocellular carcinoma. World J Gastroenterol. 2008;14:1741–1748. doi: 10.3748/wjg.14.1741. [DOI] [PMC free article] [PubMed] [Google Scholar]
- 22.Adrien L.R., Schlecht N.F., Kawachi N., Smith R.V., Brandwein-Gensler M., Massimi A., Chen S., Prystowsky M.B., Childs G., Belbin T.J. Classification of DNA methylation patterns in tumor cell genomes using a CpG island microarray. Cytogenet Genome Res. 2006;114:16–23. doi: 10.1159/000091923. [DOI] [PubMed] [Google Scholar]
- 23.Lund A.H., van Lohuizen M. Epigenetics and cancer. Genes Dev. 2004;18:2315–2335. doi: 10.1101/gad.1232504. [DOI] [PubMed] [Google Scholar]
- 24.Sparmann A., van Lohuizen M. Polycomb silencers control cell fate, development and cancer. Nat Rev Cancer. 2006;6:846–856. doi: 10.1038/nrc1991. [DOI] [PubMed] [Google Scholar]
- 25.Futscher B.W., Oshiro M.M., Wozniak R.J., Holtan N., Hanigan C.L., Duan H., Domann F.E. Role for DNA methylation in the control of cell type specific maspin expression. Nat Genet. 2002;31:175–179. doi: 10.1038/ng886. [DOI] [PubMed] [Google Scholar]
- 26.Hattori N., Nishino K., Ko Y.G., Ohgane J., Tanaka S., Shiota K. Epigenetic control of mouse Oct-4 gene expression in embryonic stem cells and trophoblast stem cells. J Biol Chem. 2004;279:17063–17069. doi: 10.1074/jbc.M309002200. [DOI] [PubMed] [Google Scholar]
- 27.Feun L., You M., Wu C.J., Kuo M.T., Wangpaichitr M., Spector S., Savaraj N. Arginine deprivation as a targeted therapy for cancer. Curr Pharm Des. 2008;14:1049–1057. doi: 10.2174/138161208784246199. [DOI] [PMC free article] [PubMed] [Google Scholar]