Abstract
Purpose: To improve the performance of a computer-aided detection (CAD) system for mass detection by using four-view information in screening mammography.
Methods: The authors developed a four-view CAD system that emulates radiologists’ reading by using the craniocaudal and mediolateral oblique views of the ipsilateral breast to reduce false positives (FPs) and the corresponding views of the contralateral breast to detect asymmetry. The CAD system consists of four major components: (1) Initial detection of breast masses on individual views, (2) information fusion of the ipsilateral views of the breast (referred to as two-view analysis), (3) information fusion of the corresponding views of the contralateral breast (referred to as bilateral analysis), and (4) fusion of the four-view information with a decision tree. The authors collected two data sets for training and testing of the CAD system: A mass set containing 389 patients with 389 biopsy-proven masses and a normal set containing 200 normal subjects. All cases had four-view mammograms. The true locations of the masses on the mammograms were identified by an experienced MQSA radiologist. The authors randomly divided the mass set into two independent sets for cross validation training and testing. The overall test performance was assessed by averaging the free response receiver operating characteristic (FROC) curves of the two test subsets. The FP rates during the FROC analysis were estimated by using the normal set only. The jackknife free-response ROC (JAFROC) method was used to estimate the statistical significance of the difference between the test FROC curves obtained with the single-view and the four-view CAD systems.
Results: Using the single-view CAD system, the breast-based test sensitivities were 58% and 77% at the FP rates of 0.5 and 1.0 per image, respectively. With the four-view CAD system, the breast-based test sensitivities were improved to 76% and 87% at the corresponding FP rates, respectively. The improvement was found to be statistically significant (p<0.0001) by JAFROC analysis.
Conclusions: The four-view information fusion approach that emulates radiologists’ reading strategy significantly improves the performance of breast mass detection of the CAD system in comparison with the single-view approach.
Keywords: computer-aided detection, breast mass, four-view mammograms, false positive reduction
INTRODUCTION
Mammography is the most effective modality for breast cancer screening. Mammographic screening has been proven to significantly reduce breast cancer mortality over the past few decades.1 However, mammography is still far from being ideal, with its sensitivity only ranging from about 70% to 90%. Double reading can improve mammographic interpretation2, 3 and therefore improve the chance of survival for patients with breast cancer. Recent studies4, 5 suggested that single reading with computer-aided detection (CAD) could be a cost-effective alternative to double reading.
In mammographic screening, a craniocaudal (CC) and a mediolateral oblique (MLO) view are taken of each breast. The two views compress the breast tissues in nearly orthogonal directions and increase the chance that a lesion may be seen in at least one of the views among the overlapping structures. It was found that single-view mammography not only led to a higher recall rate6 but also caused the radiologist to miss 11%–25% of the cancers.7, 8, 9
In clinical practice, radiologists interpret the mammograms by combining the information from different views. It has been reported that comparing two views of the same breast can reduce false positives (FPs) by dismissing overlapping tissue that mimics a lesion and reduce false negatives due to camouflaging by overlapping tissues. The comparison of bilateral mammograms of the same views can help detect asymmetric density patterns that may be caused by a developing lesion. The comparison of current and prior mammograms will help identify changes over time. Investigators have been attempting to implement automated methods for multiple-view analysis in CAD systems to improve the accuracy of detection and diagnosis of abnormalities on mammogram. In general, one could divide the multiple-view analysis methods into three categories: (1) Two-view analysis of the same breast, (2) bilateral analysis for breast comparison, and (3) comparison of current and prior mammograms.
Two-view analysis is the approach that has been most frequently investigated for numerous purposes to date. Kita et al.10 developed a method to find spatial correspondences between CC and MLO views of the same breast. Paquerault et al.11 developed the first two-view CAD system for mass detection. Wei et al.12 developed a two-view mass detection system using a single-system or a dual-system approach. Zheng et al.13 proposed a two-view CAD system for masses, which aimed to reduce the FP rate at a given sensitivity level. Sahiner et al.14 investigated the use of joint two-view information to improve computerized microcalcification detection. Engeland and Karssemeijer15 investigated a method in which a two-view classifier was trained with both single- and two-view features to classify the true lesions from normal structures instead of training a classifier to differentiate the object pairs. Qian et al.16 designed a method for fusing detection results and image features from two views. Velikova et al.17 proposed a Bayesian network framework that used the dependence between the MLO and the CC views to obtain a single measure for estimating whether the mammographic view, the breast, and the case contains a cancerous lesion. As a common conclusion, a CAD system with two-view analysis as an additional component could improve the performance compared to that of the corresponding single-view CAD system.
The dense fibroglandular tissue in the left and right breasts usually distributes in a fairly symmetric fashion and appears as relatively symmetric patterns on bilateral mammograms. Although focal asymmetry often indicates benign findings, work-up and short-term follow-up are suggested for such patients.18, 19 Developing focal asymmetry has been found to have a substantial positive predictive value,20 while stable asymmetry is due to predominantly normal anatomical variations. Researchers have been investigating methods to utilize the asymmetry property of bilateral mammograms for abnormality detection in CAD schemes. Yin et al.21 proposed a bilateral subtraction technique, which served as a prescreening step of a mass detection program to locate mass candidates. Méndez et al.22 developed a CAD system that used a bilateral subtraction approach to identify mass candidates, which were then subjected to size and eccentricity tests and texture feature analysis to eliminate FPs. Although the goals of these studies were to detect masses rather than the asymmetry sign of breast cancer, focal asymmetry might be found as mass candidates. Wu et al.23 developed a method that analyzed the asymmetry of density patterns between bilateral mammograms to reduce FPs while retaining focal asymmetries.
Although the analysis of information from the ipsilateral CC and MLO views or from two corresponding contralateral views has been investigated for improvement of CAD system performance, to our knowledge, no study to date has reported the utilization of information from all four views in a screening mammographic examination in one CAD system and evaluated its effectiveness for abnormality detection. In this study, we developed a four-view mass detection system by combining our two-view dual CAD system12 and the bilateral analysis technique.23 The mass detection accuracy of this approach was compared to a single-view CAD system.
MATERIALS AND METHODS
Image sets
The data collection protocol was approved by the Institutional Review Board (IRB) prior to the commencement of this study. We retrospectively collected mammograms from 589 patients in the Department of Radiology at the University of Michigan Health System. Each patient had two-view mammograms (CC view and MLO view or the lateral view) for both breasts, resulting in a total of 2356 (4×589) images.
Of the 589 subjects studied, 389 subjects were recommended for breast biopsy due to a suspicious finding of breast masses. Of the 389 masses, 168 were confirmed to be breast cancer and 221 were found to be benign. An experienced Mammography Quality Standards Act (MQSA) radiologist identified the locations of masses by examining all available information including the diagnostic mammograms and reports. We refer to these 389 cases as the “mass set” in the following discussion. The remaining 200 were normal subjects who had cancer-free follow-up for at least two years. We refer to these 200 cases as the “normal set.” The normal data set was only used for estimating the FP rate during testing.
All of the mammograms were acquired with MQSA-approved systems and digitized with a LUMISYS 85 laser film scanner with a pixel size of 50 μm×50 μm and 4096 gray levels. The scanner was calibrated to have a linear relationship between gray levels and optical densities (O.D.) from 0.1 to about 3 O.D. units. The nominal O.D. range of the scanner is 0–4. The full resolution mammograms were first smoothed with a 2×2 box filter and subsampled by a factor of 2, resulting in images with a pixel size of 100 μm×100 μm. These digitized images were used as the input to our CAD system.
CAD system
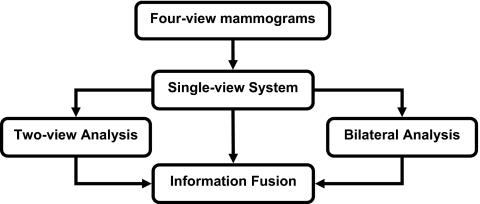
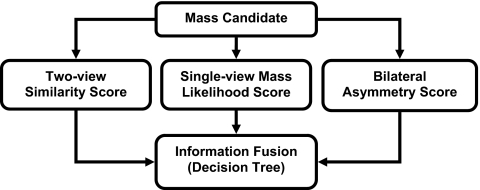
Our proposed four-view system contained three major steps. First, a single-view CAD system was used to identify mass candidates on each view independently. A mass likelihood score was estimated for each candidate. Two-view analysis and bilateral analysis were then performed to emulate radiologists’ reading using the two views of the same breast to reduce FPs and the bilateral views to detect asymmetry. For two-view analysis, a two-view score of each candidate was generated by registering candidate pairs and fusing information of the pair with a similarity classifier. For bilateral analysis, the corresponding region on the contralateral mammogram of the same view was identified for each mass candidate and the asymmetry of density patterns was analyzed by an asymmetry classifier to generate a bilateral score for each candidate. Finally, a decision tree classifier was trained to merge the single-view mass likelihood score, two-view similarity score, and bilateral asymmetry score for each candidate and to differentiate true masses from FPs. Figure 1 showed the system overview of the four-view CAD system.
Figure 1.
Schematic diagram of the four-view CAD system for mass detection on mammograms.
Dual system for mass detection on single view
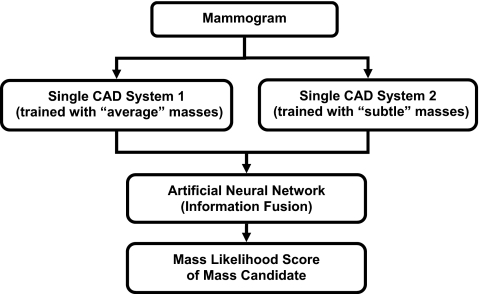
Our single-view CAD system used to identify mass candidates on each view was a dual system scheme developed previously.24 Figure 2 showed the schematic diagram of the dual system approach. Briefly, the dual system is composed of two single CAD systems in parallel. The two systems have the same architecture that includes four processing steps: (1) Prescreening of mass candidates, (2) segmentation of suspicious objects, (3) feature extraction and analysis, and (4) FP reduction by classification of normal tissue structures and masses. They were optimized separately by using two different training sets, one contained current mammograms with “average” masses and the other prior mammograms with “subtle” masses that were either overlooked or considered not actionable in that exam. The two data sets did not need to come from the same subjects. After the two single systems were trained separately, they were trained together with a single training set to design an artificial neural network for fusion of the information from the two systems. For an input unknown mammogram, the two systems are applied in parallel and each system estimates a mass likelihood score for every detected object, the trained artificial neural network merges the mass likelihood scores of the two single CAD systems for a given object to differentiate true masses from FPs. The details can be found in literature.24
Figure 2.
Schematic diagram of the dual CAD system for mass detection on single-view mammograms.
Two-view analysis
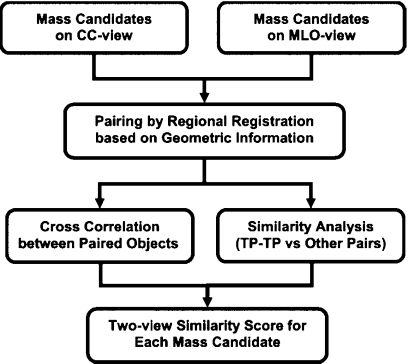
In our two-view information fusion approach, the suspicious objects in two ipsilateral mammographic views are paired and a unique fusion score is generated for each individual object. Figure 3 shows the schematic diagram of the two-view analysis process. Briefly, our approach consisted of four steps: (1) Regional registration by using geometric information; (2) estimation of image similarity measure between paired objects using cross correlation; (3) estimation of feature similarity measure by designing a classifier for differentiation of true positive (TP-TP) pairs from other pairs using morphological, texture, and Hessian features; and (4) generation of the two-view fusion score of each individual object by retaining the maximum of the feature similarity measure weighted by the image similarity measure among all pairs formed with this object as a member. The techniques used in our two-view analysis have been described in detail elsewhere.12
Figure 3.
Schematic diagram of the two-view analysis for suspicious objects on the CC and MLO views of the same breast.
Bilateral analysis
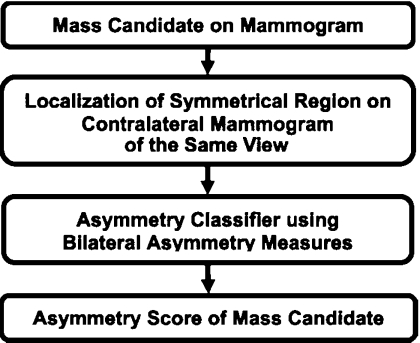
Our bilateral analysis utilizes the asymmetry information on contralateral mammograms of the same view for FP reduction in the CAD system. The bilateral approach was designed to differentiate whether a mass candidate from the single-view detection system has a corresponding symmetric density in the contralateral mammogram. Figure 4 shows the schematic diagram of the bilateral analysis. Briefly, a region of interest (ROI) is first defined based on the location of each mass candidate. A regional registration process, similar to that used for identification of a corresponding fan-shaped ROI on the prior mammogram of the same view in interval change analysis,25 is then used to locate the corresponding ROI on the contralateral mammogram. Morphological and statistical texture features are extracted within the pair of ROIs and asymmetry measures are constructed from the extracted features. A classifier is designed to estimate a bilateral asymmetry score for differentiating asymmetric objects from symmetric structures. Further details of the bilateral analysis can be found in our previous study.23
Figure 4.
Schematic diagram of the bilateral analysis for mass detection on mammograms.
Four-view information fusion
As described above, three primary processes in the four-view system (single-view detection, two-view analysis, and bilateral analysis) have been designed to focus on different characteristics of breast masses on mammograms. The single-view system was designed to distinguish masses from normal tissues by locally analyzing its morphological and texture features. The two-view analysis was designed to detect the similarities of TP-TP pairs in comparison with TP-FP and FP-FP pairs on ipsilateral views. The bilateral analysis is designed to detect asymmetric focal densities by taking advantage of the nearly symmetrical density distribution in most normal breasts. These three approaches therefore make use of different but complementary information on the mammograms to distinguish true masses from FPs. To combine the discriminatory power from these three sources, we compared three classification methods. Each of the classifiers was trained to optimally weigh the three input predictor variables, namely, the mass likelihood score from the single-view detection, the similarity score from the two-view analysis, and the asymmetry score from the bilateral analysis, to distinguish masses from normal tissues on each view. This process is illustrated in the schematic in Fig. 5.
Figure 5.
Fusion of the information from three approaches to emulate radiologists’ strategy for reading four-view mammograms A decision tree trained by the AdaBoost algorithm was selected after comparison of linear discriminant analysis, decision tree, and support vector machine for information fusion.
The first method is a linear discriminant analysis (LDA) classifier. LDA is the optimal classifier when the independent variables from both the positive class and the negative class follow the normal distribution with equal covariance matrices. LDA was also found to be a robust classifier even when the conditions are not satisfied because of its simplicity, thus reducing the chance of overfitting.26 However, the classification performance may be suboptimal in these situations.
The second method we used is a decision tree classifier, which is independent of the statistical distribution of the sample data. We used Quinlan’s C5.0 decision tree27, 28 as the base algorithm. To train the decision tree classifier, an adaptive boosting technique, called AdaBoost,29 was used to find a highly accurate hypothesis (classification rule) by combining many “weak” hypotheses (i.e., weak classifiers). Briefly, AdaBoost generates an ensemble of base classifiers in an iterative training process. The base classifiers are the same, except that the weights of the training samples are changed over the iterations. At the first iteration, all training samples have equal weights. The weights are then modified by the algorithm in each subsequent iteration such that the weight of each sample misclassified in the previous iteration is increased. The higher the weight, the more the sample influences the learning of a classifier so that the subsequent classifiers will be trained to favor the previously misclassified samples. The error at each iteration is measured as the sum of the weights of the samples that are misclassified. If the error is greater than 0.5, the boosting is terminated and the last iteration will not be used to weigh the final classifier. If the error is 0 (i.e., the classifier correctly classifies all of the training samples), the boosting is also terminated. For a given test case, the AdaBoost algorithm estimates its class membership by combining the results of the ensemble of trained weak classifiers with different voting strengths, which have been determined by the boosting algorithm based on their training accuracy. In this study, we varied the number of boosting iterations to search for the best performance with the training data sets. Further detailed description of Quinlan’s C5.0 and the Adaboost technique can be found in literature.27, 28, 29, 30
The third method is support vector machine (SVM).31 The goal of SVM is to minimize the true risk by optimizing the decision boundary in terms of a typically small subset of the training examples, referred to as the support vectors. Given a training set of instance-label pairs (xi,yi), where i=1,…,l, xi∊Rn and yi∊{1,−1}, l is the number of training samples, and n is the dimensionality of the feature vectors xi, the SVMs require solving the following optimization problem:
| (1) |
subject to the condition
| (2) |
where the training vectors xi are mapped onto a higher dimensional space by Φ. W is the weight vector that is the normal to the separating hyperplane. εi is a non-negative slack variable that introduces the soft margin to solve the nonseparable problem. C(>0) is a penalty parameter that determines the trade-off between the training error and the classifier capacity. K(xi,xj)=Φ(xi)TΦ(xj) is called the kernel function. In SVM, the kernel plays a dual role: First, it determines the class of functions that the solution is taken from; second, it determines the type of regularization that is used. In this study, we used a linear kernel illustrated in Eq. 3 because of its simplicity (only one parameter to train). The SVMlight algorithm32 is used to optimize Eqs. 1, 2,
| (3) |
In this study, we varied C to search for the best performance with each training subset. The value of εi was fixed at 0.01 for all i=1,…,l since it is a very insensitive variable.32
System evaluation
When the available sample size is limited in a pattern classification problem, one of the important questions is to determine what proportion of samples should be used for training the parameters of the classification system and what proportion should be used for testing. In general, the classification performance mainly depends on the training sample size, while the variance is mainly determined by the test sample size.26, 33 Different resampling methods, such as resubstitution, leave-one-out, k-fold cross-validation and bootstrapping, have been proposed. Fukunaga33 showed that the holdout method will provide the upper bound, while the resubstitution method will give the lower bound of the Bayes error. In this study, our main purpose is to compare the new four-view CAD system to the single-view CAD system,24 the bilateral CAD system,23 and the two-view CAD system.12 Compared to our most recent study12 in which we applied the twofold cross validation method (equivalent to the holdout method in each fold) to 535 patients with masses and 200 normal subjects, the data set of 589 cases in the current study was obtained from the previous data set after removing 146 mass cases that did not have four-view mammograms. Therefore, we again used the twofold cross validation in this study and the partitioning of the data set also followed the previous study to maintain the independence of the training and test processes. In each cross-validation cycle, we used the training subset for that cycle to train the parameters of the four-view system. For each classifier, the classification accuracy for the training subset was optimized in terms of the area under the ROC curve, Az, for differentiating TPs from FPs. For the parameters in the single-view system and the two-view similarity analysis, we used the previously trained parameters and did not perform further adjustment in this study. For the bilateral analysis, the parameters were trained with the current training subset in each cross validation cycle because the sample size used in the previous study23 was relatively small (with a total of 276 mass cases for cross-validation training and testing).
Once the training with one mass subset was completed, the parameters were fixed and applied to the independent cross-validation test subset. The entire training and testing processes were repeated for the other cross-validation cycle in which the training and test subsets were switched. The set of normal mammograms was not used during training. The trained system from each cycle was applied to the normal set to estimate its FP rate.
The detection performance of the CAD system was assessed by free response ROC (FROC) analysis. The number of FP marks produced by the CAD system was estimated by counting the detected objects on the normal cases. The mass detection sensitivity was estimated by counting the fraction of masses detected in the test mass subset. An FROC curve was obtained by plotting the mass detection sensitivity as a function of FP marks per image at the corresponding decision threshold. FROC curves were presented on a per-mammogram (view-based FROC) and a per-breast basis (breast-based FROC). For view-based FROC analysis, the mass on each mammogram was considered an independent true object. For breast-based FROC analysis, the same mass imaged on the two-view mammograms of the same breast was considered to be one true object and detection of the mass on either view or both views was considered to be a TP detection. Since we used twofold cross validation method for training and testing, we obtained two test FROC curves, one for each test subset, for each of the conditions (e.g., single-view approach, two-view approach, bilateral approach, and four-view approach). Because the training process including feature selection in each cross validation cycle was performed with the training subset alone, the selected feature set from each training subset could be different than that from the other independent training subset for each corresponding approach. For the four-view system, the final decision tree classification process further combined the classifier scores from the three approaches in a complex nonlinear relationship that was trained by, and was thus different for, each training subset. The final decision scores for the two test subsets could come from very different feature spaces. It is still unknown whether these decision scores could be normalized and pooled together to generate a single FROC curve. To summarize the results for comparison, we therefore derived an average test FROC curve of a given approach by averaging the FP rates at the same sensitivity after the individual FROC curve for each of the two test subsets was generated for that approach. To compare the performance of the different mass detection approaches, we employed the jackknife free-response ROC (JAFROC) software developed by Chakraborty et al.34, 35 to estimate the statistical significance of the difference between the pairs of test FROC curves. The JAFROC analysis was applied to the FROC curves of the subsets because the JAFROC analysis was not designed for average FROC curves.
RESULTS
ROC analysis for evaluation of information fusion
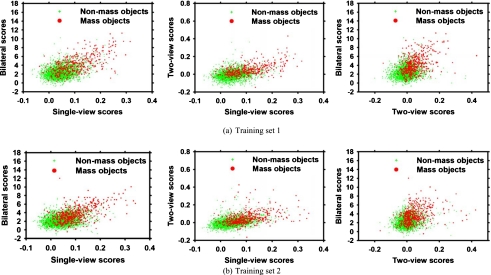
Figures 6a, 6b show the scatterplots of the three features (mass likelihood score from the single-view detection, the similarity score from the two-view analysis, and the asymmetry score from the bilateral analysis) for the mass and nonmass objects in two training subsets at the information fusion step (Fig. 5) of the four-view CAD system.
Figure 6.
The scatterplots of the feature spaces on two training subsets for four-view information fusion. Singe-view scores: Mass likelihood score from the single-view detection. Two-view scores: Similarity score from the two-view analysis. Bilateral scores: Asymmetry score from the bilateral analysis.
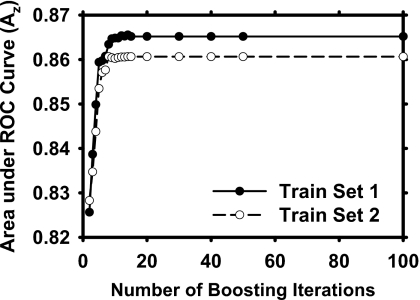
Figure 7 shows the performance of the decision trees during AdaBoost training for the two training subsets. The training Az values were plotted as a function of the number of boosting iterations. The decision tree trained with boosting became stabilized after 14 and 15 iterations with training subsets 1 and 2, respectively. For iterations beyond these numbers, boosting did not change the weights anymore because of the large error rate (>0.5) so that the training was essentially terminated. We chose the trained decision trees with the stabilized weights to compare to other two classification methods for the four-view information fusion.
Figure 7.
Training performances using C5.0 decision tree for four-view information fusion on two independent training sets as a function of boosting iterations.
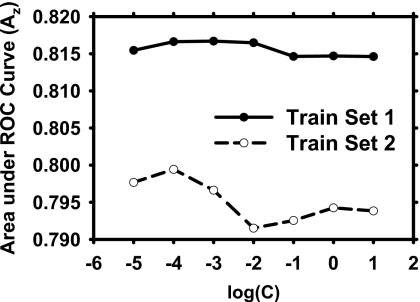
Figure 8 shows the dependence of the training performance of the SVM on the penalty parameter C. We found that the training with SVMs were fairly stable with the training Az values ranged from 0.814 to 0.817 for training set 1 and from 0.791 to 0.799 for training set 2. We chose the SVMs with the best training Az values to compare to other two classification methods during the four-view analysis.
Figure 8.
Training performances using SVM with a linear kernel for four-view information fusion on the two training subsets over a range of penalty parameter C.
The Az values of the two training subsets for the three information fusion methods were 0.82 and 0.83 for LDA, 0.86 and 0.86 for decision tree, and 0.82 and 0.80 for SVM. Since the training Az values of the decision trees obtained with both training subsets are significantly better than those of the LDAs (p=0.002 and p=0.002, respectively) and SVMs (p=0.002 and p<0.001, respectively), we chose the decision tree to merge the information from the three processes in the following experiments. With the decision tree for the four-view information fusion, we found that the test Az values were 0.83±0.01 and 0.82±0.01 for the two test subsets, respectively.
FROC analysis for evaluation of detection performance
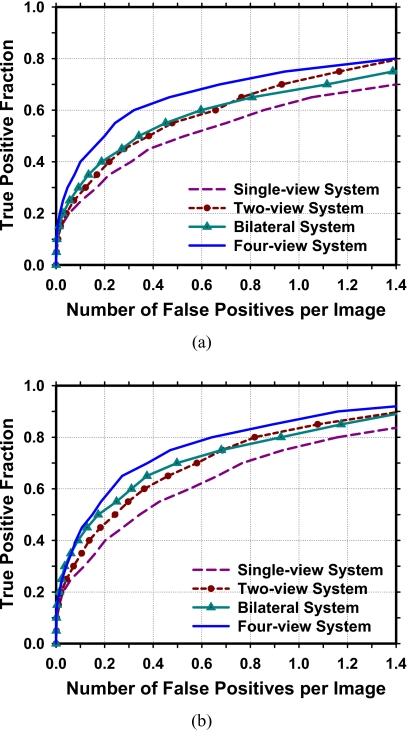
The performances of the different CAD systems are compared by FROC analysis. The average FROC curves are shown in Fig. 9. The single-view CAD system achieved breast-based sensitivities of 80%, 85%, and 90% at 1.16, 1.49, and 1.75 FPs∕image, respectively, compared to 0.64, 0.89, and 1.16 FPs∕image by the four-view CAD system.
Figure 9.
Comparison of the average test FROC curves obtained from averaging the FROC curves of the two independent test subsets for detection of breast masses by the four approaches. The FP rate was estimated from normal mammograms. (a) View-based FROC curves. (b) Breast-based FROC curves.
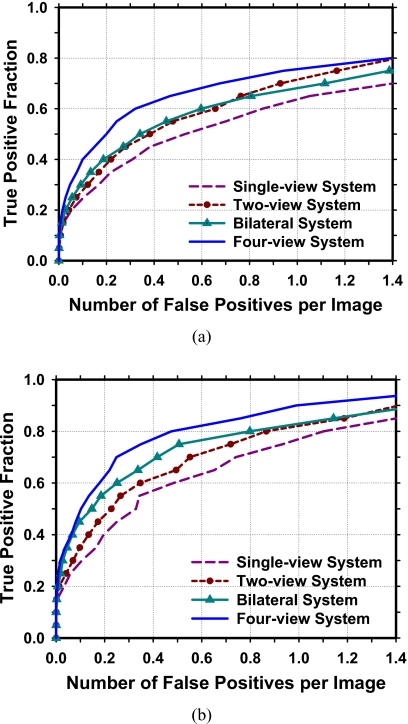
Our CAD system is designed to detect both benign and malignant masses on screening mammograms because all suspicious findings will be recalled for diagnostic work-up or short-term follow-up.36, 37, 38 However, it will be important to evaluate the performance of the CAD system for detection of malignant masses. Figure 10 shows a comparison of the four CAD systems for the subset of 168 malignant masses in the data set. In this case, the single-view CAD system achieved breast-based sensitivities of 80%, 85%, and 90% at 1.10, 1.40, and 1.60 FP marks∕image, respectively, compared to 0.47, 0.76, and 0.99 FP marks∕image by the four-view CAD system. Table 1 summaries the test performances of the four approaches at FP rates of 1.0, 0.5, and 0.25 marks per image as estimated from the detection on the normal data set. The comparison showed that the sensitivities achieved greater improvement for the malignant masses than that for the benign masses using the bilateral or four-view analysis when the single-view CAD was treated as the baseline. Both the two-view analysis and the bilateral analysis were important in terms of the improvement of mass detection, but the bilateral analysis achieved greater improvement than the two-view analysis for detection of malignant masses.
Figure 10.
Comparison of the average test FROC curves obtained from averaging the FROC curves of the two independent test subsets for detection of malignant masses by the four approaches. The FP rate was estimated from normal mammograms. (a) View-based FROC curves. (b) Breast-based FROC curves.
Table 1.
Comparison of breast-based detection performance of the four mass detection approaches. The number of FP marks∕image was estimated from the detection on the normal data set. The percentage improvement in the sensitivities relative to the single-view system was provided in parentheses.
| FP marks∕image | Sensitivity (TP %) | |||
|---|---|---|---|---|
| Single-view system | Two-view system | Bilateral system | Four-view system | |
| Malignant and benign masses | ||||
| 1.00 | 77% | 84% (9%) | 81% (5%) | 87% (13%) |
| 0.50 | 58% | 67% (16%) | 70% (21%) | 76% (31%) |
| 0.25 | 44% | 52% (18%) | 57% (30%) | 62% (41%) |
| Malignant masses only | ||||
| 1.00 | 75% | 83% (11%) | 83% (11%) | 90% (20%) |
| 0.50 | 59% | 65% (10%) | 74% (25%) | 80% (36%) |
| 0.25 | 46% | 52% (13%) | 60% (30%) | 70% (52%) |
| Benign masses only | ||||
| 1.00 | 78% | 85% (9%) | 80% (3%) | 85% (9%) |
| 0.50 | 57% | 69% (21%) | 67% (18%) | 73% (28%) |
| 0.25 | 43% | 52% (21%) | 55% (28%) | 57% (33%) |
The results of the JAFROC analysis between the test FROC curve of the four-view approach and the test FROC curve of each of the other three approaches—single-view system, two-view system, and bilateral system—are summarized in Table 2. The figure-of-merit (FOM) and the p values for detection of both benign and malignant masses and for detection of the malignant masses are compared.
Table 2.
Estimation of the statistical significance of the difference between the test FROC curve of the four-view approach and the FROC curve of each of the other three approaches: Single-view, two-view, and bilateral analyses. The pair of the view-based FROC curves for each test subset was compared using the JAFROC analysis. The p value of each pair and the FOMs of the FROC curves are shown for all masses and the malignant masses.
| JAFROC analysis | FOM | |||
|---|---|---|---|---|
| All masses | Malignant masses | |||
| Test subset 1 | Test subset 2 | Test subset 1 | Test subset 2 | |
| (1) Single-view | 0.67 | 0.67 | 0.68 | 0.69 |
| (2) Two-view | 0.72 | 0.71 | 0.73 | 0.73 |
| (3) Bilateral | 0.71 | 0.72 | 0.73 | 0.74 |
| (4) Four-view | 0.77 | 0.77 | 0.80 | 0.81 |
| P value: (1) vs (4) | <0.0001 | <0.0001 | <0.0001 | <0.0001 |
| P value: (2) vs (4) | 0.001 | 0.0004 | <0.0001 | <0.0001 |
| P value: (3) vs (4) | 0.0004 | 0.001 | <0.0001 | <0.0001 |
DISCUSSION AND CONCLUSION
A number of CAD systems have been developed for the detection of breast masses using single-view or ipsilateral two-view mammograms. To our knowledge, this study is the first one that takes advantage of information in all four mammographic views for mass detection, emulating radiologists’ strategy in the interpretation of screening examination. Our four-view approach is built on the two-view and bilateral analyses that we reported previously. The results show that the fusion of the four-view information can significantly improve the mass detection accuracy in comparison to the single-view, the two-view, or the bilateral approaches as estimated by the JAFROC analysis. This finding suggested that the four-view approach is the most effective method for CAD of masses whenever four-view mammograms were available.
In this study, we performed a twofold cross validation training and testing for the performance evaluation of our CAD systems. The image processing techniques applied to the two training subsets were exactly the same. However, because of statistical variations of the characteristics of the training cases, the specific parameter values and features chosen by training were not identical. The values of the parameters at different stages were chosen during the training process using each subset. We did not try to compare or adjust the parameters of the two trained systems to make them similar because the second training subset was the test subset of the first training subset and vice versa. Any attempt to unify the parameter values or the selected features between the two training subsets would amount to using the test subset information to adjust the training and thus invalidate the independence of the test subset. We observe that the test performances obtained from the two independent test subsets were similar, which indicates that the method and parameters were reasonably trained and consistent. Note that the normal cases, which were part of the test sets, were not involved during the training process.
Our four-view CAD system in this study is not fully automatic due to the fact that the nipple location, which is the important information for both two-view analysis and bilateral analysis, was manually identified and stored as input to the CAD systems. A nipple detection algorithm was developed in our laboratory to determine the nipple location on mammograms. Our previous study39 found that the algorithm could detect the nipple locations within 1 cm of the manually identified locations in about 85% of the 387 images in that data set. Since a large deviation of the nipple location from the true location might affect the regional registration technique used in our four-view system, we used the manually identified nipple locations in this study in order to evaluate the performance improvement without the influence of other confounding factors. Further work is underway to improve the nipple detection algorithm in order to fully automate the multiple-view CAD systems.
During the JAFROC analysis for statistical testing of performance improvement, we performed a series of tests to compare pairs of FROC curves from the four approaches. Traditionally, the test will be considered statistically significant if the p value is less than 0.05. However, the probability of finding a significant difference by chance (a type I error) increases when one carries out multiple hypothesis tests. To alleviate this problem, we used the conservative Bonferroni correction40, 41 to control the familywise error by adjusting the p value for the estimation of the statistical significance. It was found that the conclusions remained the same when we used the Bonferroni correction, (p=0.05∕12=0.004 after Bonferroni correction); all the paired tests were statistically significant with p<0.004.
In this study, we collected our database consecutively from the malignant case database and the benign case database from our Breast Imaging Division. Cases that were excluded included outside referral cases that had no original mammograms, cases that did not have four-view mammograms, cases that had suboptimal image quality, and cases that had microcalcifications only. We did not specifically include or exclude architectural distortion, asymmetric densities, and other types of soft-tissue abnormalities.
In recent years, full field digital mammography (FFDM) is becoming more common and can be expected to be the main modality for mammographic screening in the near future. Although the four-view CAD system was developed with digitized film mammograms, we expect that it can be adapted to FFDM without major changes in methodology if the FFDM is properly transformed, as demonstrated by our previous studies of adapting CAD systems for detection of masses and microcalcifications42, 43 and for mass classification44 to FFDMs.
ACKNOWLEDGMENTS
This work was supported by USPHS Grant No. RO1 CA95153 and U. S. Army Medical Research and Materiel Command Grant No. W81XWH-1-04-1-0475. The content of this paper does not necessarily reflect the position of the government and no official endorsement of any equipment and product of any companies mentioned should be inferred. The authors are grateful to Charles E. Metz, Ph.D., for the LABROC program and to Dev Chakraborty, Ph.D., for the JAFROC1 program.
References
- American Cancer Society, 2009, Cancer Facts & Figures 2009, www.cancer.org.
- Taplin S. H., Rutter C. M., Elmore J. G., Seger D., White D., and Brenner R. J., “Accuracy of screening mammography using single versus independent double interpretation,” AJR, Am. J. Roentgenol. 174, 1257–1262 (2000). [DOI] [PubMed] [Google Scholar]
- Helvie M. A., “Improving mammographic interpretation: Double reading and computer-aided diagnosis,” Radiol. Clin. North Am. 45, 801–811 (2007). 10.1016/j.rcl.2007.06.004 [DOI] [PubMed] [Google Scholar]
- Gilbert F. J., Astley S. M., Gillan M. G. C., Agbaje O. F., Wallis M. G., James J., Boggis C. R. M., and Duffy S. W., “Single reading with computer-aided detection for screening mammography,” N. Engl. J. Med. 359, 1675–1684 (2008). 10.1056/NEJMoa0803545 [DOI] [PubMed] [Google Scholar]
- Gromet M., “Comparison of computer-aided detection to double reading of screening mammograms: Review of 231,221 mammograms,” AJR, Am. J. Roentgenol. 190, 854–859 (2008). 10.2214/AJR.07.2812 [DOI] [PubMed] [Google Scholar]
- Sickles E. A. et al. , “Baseline screening mammography: One vs two views per breast,” AJR, Am. J. Roentgenol. 147, 1149–1153 (1986). [DOI] [PubMed] [Google Scholar]
- Muir B. B., Kirkpatrick A. E., Roberts M. M., and Duffy S. W., “Oblique-view mammography: Adequacy for screening,” Radiology 151, 39–41 (1984). [DOI] [PubMed] [Google Scholar]
- Wald N. J., Murphy P., Major P., Parkes C., Townsend J., and Frost C., “UKCCCR multicentre randomised controlled trial of one and two view mammography in breast cancer screening,” BMJ 311, 1189–1193 (1995). [DOI] [PMC free article] [PubMed] [Google Scholar]
- Law J. and Faulkner K., “Two-view screening and extending the age range: The balance of benefit and risk,” Br. J. Radiol. 75, 889–894 (2002). [DOI] [PubMed] [Google Scholar]
- Kita Y., Highnam R. P., and Brady J. M., “Correspondence between different view breast x rays using curved epipolar lines,” Comput. Vis. Image Underst. 83, 38–56 (2001). 10.1006/cviu.2001.0908 [DOI] [Google Scholar]
- Paquerault S., Petrick N., Chan H. P., Sahiner B., and Helvie M. A., “Improvement of computerized mass detection on mammograms: Fusion of two-view information,” Med. Phys. 29, 238–247 (2002). 10.1118/1.1446098 [DOI] [PubMed] [Google Scholar]
- Wei J., Chan H. -P., Sahiner B., Zhou C., Hadjiiski L. M., Roubidoux M. A., and Helvie M. A., “Computer-aided detection of breast masses on mammograms: Dual system approach with two-view analysis,” Med. Phys. 36, 4451–4460 (2009). 10.1118/1.3220669 [DOI] [PMC free article] [PubMed] [Google Scholar]
- Zheng B., Leader J. K., Abrams G. S., Lu A. H., Wallace L. P., Maitz G. S., and Gur D., “Multiview-based computer-aided detection scheme for breast masses,” Med. Phys. 33, 3135–3143 (2006). 10.1118/1.2237476 [DOI] [PubMed] [Google Scholar]
- Sahiner B., Chan H. -P., Hadjiiski L. M., Helvie M. A., Paramagul C., Ge J., Wei J., and Zhou C., “Joint two-view information for computerized detection of microcalcifications on mammograms,” Med. Phys. 33, 2574–2585 (2006). 10.1118/1.2208919 [DOI] [PMC free article] [PubMed] [Google Scholar]
- van Engeland S. and Karssemeijer N., “Combining two mammographic projections in a computer aided mass detection method,” Med. Phys. 34, 898–905 (2007). 10.1118/1.2436974 [DOI] [PubMed] [Google Scholar]
- Qian W., Song D. S., Lei M. S., Sankar R., and Eikman E., “Computer-aided mass detection based on ipsilateral multiview mammograms,” Acad. Radiol. 14, 530–538 (2007). 10.1016/j.acra.2007.01.012 [DOI] [PubMed] [Google Scholar]
- Velikova M., Samulski M., Lucas P. J. F., and Karssemeijer N., “Improved mammographic CAD performance using multi-view information: A Bayesian network framework,” Phys. Med. Biol. 54, 1131–1147 (2009). 10.1088/0031-9155/54/5/003 [DOI] [PubMed] [Google Scholar]
- Kopans D., Swann C., White G., McCarthy K., Hall D., Belmonte S., and Gallagher W., “Asymmetric breast tissue,” Radiology 171, 639–643 (1989). [DOI] [PubMed] [Google Scholar]
- Sickles E. A., “Periodic mammographic follow-up of probably benign lesions: Results in 3184 consecutive cases,” Radiology 179, 463–468 (1991). [DOI] [PubMed] [Google Scholar]
- Leung J. W. T. and Sickles E. A., “Developing asymmetry identified on mammography: Correlation with imaging outcome and pathologic findings,” AJR, Am. J. Roentgenol. 188, 667–675 (2007). 10.2214/AJR.06.0413 [DOI] [PubMed] [Google Scholar]
- Yin F. F., Giger M. L., Doi K., Metz C. E., Vyborny C. J., and Schmidt R. A., “Computerized detection of masses in digital mammograms: Analysis of bilateral subtraction images,” Med. Phys. 18, 955–963 (1991). 10.1118/1.596610 [DOI] [PubMed] [Google Scholar]
- Méndez A. J., Lado M. J., Souto M., Vidal J. J., and Tahoces P. G., “Computer-aided diagnosis: Automatic detection of malignant masses in digitized mammograms,” Med. Phys. 25, 957–964 (1998). 10.1118/1.598274 [DOI] [PubMed] [Google Scholar]
- Wu Y. -T., Wei J., Hadjiiski L. M., Sahiner B., Zhou C., Ge J., Shi J., Zhang Y., and Chan H. P., “Bilateral analysis based false positive reduction for computer-aided mass detection,” Med. Phys. 34, 3334–3344 (2007). 10.1118/1.2756612 [DOI] [PMC free article] [PubMed] [Google Scholar]
- Wei J., Chan H.-P., Sahiner B., Hadjiiski L. M., Helvie M. A., Roubidoux M. A., Zhou C., and Ge J., “Dual system approach to computer-aided detection of breast masses on mammograms,” Med. Phys. 33, 4157–4168 (2006). 10.1118/1.2357838 [DOI] [PMC free article] [PubMed] [Google Scholar]
- Hadjiiski L. M., Sahiner B., Chan H. P., Petrick N., Helvie M. A., and Gurcan M. N., “Analysis of temporal change of mammographic features: Computer-aided classification of malignant and benign breast masses,” Med. Phys. 28, 2309–2317 (2001). 10.1118/1.1412242 [DOI] [PubMed] [Google Scholar]
- Chan H. P., Sahiner B., Wagner R. F., and Petrick N., “Classifier design for computer-aided diagnosis: Effects of finite sample size on the mean performance of classical and neural network classifiers,” Med. Phys. 26, 2654–2668 (1999). 10.1118/1.598805 [DOI] [PubMed] [Google Scholar]
- Quinlan J. R., C4.5: Programs for Machine Learning (Morgan Kaufmann, San Mateo, CA, 1993). [Google Scholar]
- Quinlan R. J., “Bagging, boosting, and C4.5,” Menlo Park, CA.
- Freund Y. and Schapire R. E., “Game theory, on-line prediction and boosting,” Proceedings of the Ninth Annual Conference on Computational Learning Theory, pp. 325–332, 1996. (unpublished).
- Schapire R. E. and Singer Y., “Improved boosting algorithms using confidence-rated predictions,” Mach. Learn. 37, 297–336 (1999). 10.1023/A:1007614523901 [DOI] [Google Scholar]
- Cortes C. and Vapnik V., “Support-vector networks,” Mach. Learn. 20, 273–297 (1995). [Google Scholar]
- Joachims T., “Learning to classify text using support vector machines,” May 2002.
- Fukunaga K., Introduction to Statistical Pattern Recognition, 2nd ed. (Academic, New York, 1990). [Google Scholar]
- Chakraborty D. P. and Winter L. H. L., “Free-response methodology: Alternate analysis and a new observer-performance experiment,” Radiology 174, 873–881 (1990). [DOI] [PubMed] [Google Scholar]
- Chakraborty D. P. and Berbaum K. S., “Observer studies involving detection and localization: Modeling, analysis, and validation,” Med. Phys. 31, 2313–2330 (2004). 10.1118/1.1769352 [DOI] [PubMed] [Google Scholar]
- Swann C. A., Kopans D. B., Koerner F. C., McCarthy K. A., White G., and Hall D. A., “The halo sign and malignant breast lesions,” AJR, Am. J. Roentgenol. 149, 1145–1147 (1987). [DOI] [PubMed] [Google Scholar]
- Kopans D. B., Breast Imaging, 2nd ed. (Lippincott-Raven, Philadelphia, PA, 1997). [Google Scholar]
- Bowles E. J. A., Sickles E. A., Miglioretti D. L., Carney P. A., and Elmore J. G., “Recommendation for short-interval follow-up examinations after a probably benign assessment: Is clinical practice consistent with BI-RADS guidance?,” AJR, Am. J. Roentgenol. 194, 1152–1159 (2010). 10.2214/AJR.09.3064 [DOI] [PMC free article] [PubMed] [Google Scholar]
- Zhou C., Chan H. -P., Paramagul C., Roubidoux M. A., Sahiner B., Hadjiiski L. M., and Petrick N., “Computerized nipple identification for multiple image analysis in computer-aided diagnosis,” Med. Phys. 31, 2871–2882 (2004). 10.1118/1.1800713 [DOI] [PMC free article] [PubMed] [Google Scholar]
- Shaffer J. P., “Multiple hypothesis testing,” Annu. Rev. Psychol. 46, 561–584 (1995). 10.1146/annurev.ps.46.020195.003021 [DOI] [Google Scholar]
- Perneger T. V., “What’s wrong with Bonferroni adjustments,” BMJ 316, 1236–1238 (1998). [DOI] [PMC free article] [PubMed] [Google Scholar]
- Wei J., Sahiner B., Hadjiiski L. M., Chan H. P., Petrick N., Helvie M. A., Roubidoux M. A., Ge J., and Zhou C., “Computer aided detection of breast masses on full field digital mammograms,” Med. Phys. 32, 2827–2838 (2005). 10.1118/1.1997327 [DOI] [PMC free article] [PubMed] [Google Scholar]
- Ge J., Sahiner B., Hadjiiski L. M., Chan H.-P., Wei J., Helvie M. A., and Zhou C., “Computer aided detection of clusters of microcalcifications on full field digital mammograms,” Med. Phys. 33, 2975–2988 (2006). 10.1118/1.2211710 [DOI] [PubMed] [Google Scholar]
- Shi J., Sahiner B., Chan H. P., Hadjiiski L. M., Ge J., and Wei J., “Breast mass classification on full-field digital mammography and screen-film mammography,” International Workshop on Digital Mammography, Lecture Notes in Computer Science, Vol. 5116, pp. 371–377 (2008).


