Abstract
We describe a method for assessing the quality of mass spectra and improving reliability of relative ratio estimations from 18O-water labeling experiments acquired from low resolution mass spectrometers. The mass profiles of heavy and light peptide pairs are often affected by artifacts, including co-eluting contaminant species, noise signal, instrumental fluctuations in measuring ion position and abundance levels. Such artifacts distort the profiles, leading to erroneous ratio estimations thus reducing the reliability of ratio estimations in high throughput quantification experiments.
We used support vector machines (SVMs) to filter out mass spectra that deviated significantly from expected theoretical isotope distributions. We built an SVM classifier with a decision function which assigns a score to every mass profile based on such spectral features as mass accuracy, signal-to-noise ratio, and differences between experimental and theoretical isotopic distributions.
The classifier was trained using a dataset obtained from samples of mouse renal cortex. We then tested it on protein samples (bovine serum albumin), mixed in five different ratios of labeled and unlabeled species. We demonstrated that filtering the data using our SVM classifier results in as much as a nine-fold reduction in the coefficient of variance of peptide ratios, thus significantly improving the reliability of ratio estimations.
Keywords: support vector machines, stable-isotope labeling, signal-to-noise ratio, isotope distribution, mass accuracy
Introduction
18O-water labeling is a versatile quantitative proteomics technique1 wherein two heavy oxygen atoms are enzymatically incorporated into the C-termini of a peptide, changing its mass by 4 Da2–5. Labeled (heavy) and unlabeled (light) peptides co-elute in a liquid-chromatography tandem mass spectrometry (LC-MS/MS) system, and their mass profiles are compared to estimate the relative abundance ratio. A number of bioinformatics methods have been developed to estimate relative peptide ratios6–12, including some that analyze medium resolution zoom scans6–8 obtained on ion trap instruments, and others that analyze full scans9–12 obtained on high resolution mass spectrometers.
Combined mass spectra of heavy (H) and light (L) peptide pairs are complex profiles of overlapping isotopic distributions. For medium resolution mass spectra, ratio estimation procedures use a model of isotopic distributions to determine peaks in the signal. For high resolution mass spectra, mass accuracy information normally allows unambiguous peak assignment. However, for both medium and high resolution spectra, the accuracy of ratio estimations from mass profiles is often affected by several artifacts. In spectra with low signal-to-noise ratios (S/N), noise signal influences peptide signal and distorts peptide abundance levels. Heavy and light peptide pairs (target species) often co-elute with unrelated contaminant species which distort the target species profiles. It has been observed that only a portion of peptides confidently identified in database searches have mass profiles that are reliable enough for use in relative ratio estimations13.
A recent study14 simulated peptide elution in LC-MS and showed that up to 29% of all peptides may co-elute. The study introduced a statistical model based on regularized regression to de-convolve profiles of co-eluting species. However, no technique was suggested for detecting presence of co-eluting species.
The quality of mass profiles obtained on FT-ICR mass spectrometers in SILAC15 experiments was examined in a recent work by Bakalarski and colleagues16. They determined that mass accuracy, mass precision (mass difference between the light and heavy forms of a peptide) and S/N were among several important features affecting ratio estimations. A scoring method based on a Random Forest17 classifier was employed to assess the credibility of quantification results. Application of mass precision criteria reduced the standard deviation of ratios by nearly 50% for spectra with S/N less than 10. However, while the spectral features used in this study included mass measurement values (mass accuracy, mass precision), the use of other important features, such as isotope distribution patterns, was not reported.
May and coworkers18 developed an open source program Qurate which allows visual inspection and evaluation of quantification events in experiments using different isotopic labeling techniques. Quality assessment is facilitated by several informational charts provided for each quantification event. The program is not automated, and manual inspection of ratios may become very tedious or even infeasible in datasets with many hundreds of spectra.
Sturm and coworkers19 described an open source system OpenMS which provides convenient and flexible platform for data analysis in mass spectrometry. The system includes tools designed to search mass spectra for peptide peaks (called features) and group related peaks in isotope-labeled and label-free experiments. These tools provide quality scores for peptide features and feature pairs. The applicability of these and other20–22 tools is limited to high resolution mass spectral data.
In this study, we present a classification method based on support vector machines23 (SVMs) to separate distorted mass profiles from good quality profiles and improve the reliability of ratio estimations from medium resolution zoom scans in 18O-water labeling experiments. Our classifier used such spectral features as mass accuracy, S/N and differences between experimental and theoretical isotopic distributions. The training set was based on MS data acquired from mouse renal cortex. We tested the classifier on five samples of bovine serum albumin (BSA) with different concentrations of labeled and unlabeled peptides and showed that it is capable of identifying mass spectra that are significantly affected by contaminant species, noise, and instrumental fluctuations. A decision function of the classifier was used to produce a quantitative assessment of the overall quality of mass profiles. Note that the problem addressed in this work, determination of quality of a mass profile of heavy and light peptide pairs from single mass spectrum, is different from quality and reproducibility determination by comparing different chromatographic runs24,25.
Materials and Methods
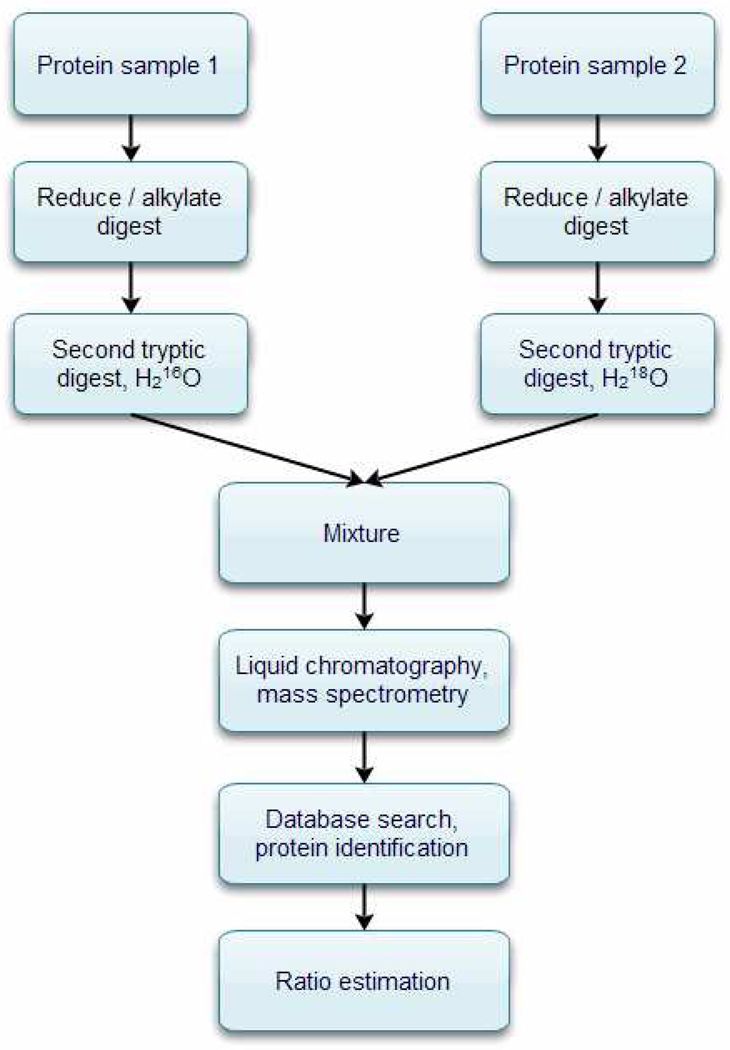
A generalized workflow for relative peptide/protein quantification using 18O-water labeling and mass spectrometry is shown in Figure 1. Two protein samples (for example, treatment and control) are separately reduced, alkylated and digested by trypsin. The resulting peptides are subjected to trypsin-mediated oxygen exchange in 16O-water (control sample) and 18O-water (treatment or test sample)26. The heavy and light peptides are then mixed in a 1(H):1(L) concentration and the mixture is analyzed via a combined liquid chromatography and mass spectrometry system. Peptides are identified from their tandem mass spectra and protein sequence databases by database search algorithms27–34. Algorithms for relative peptide ratio estimations typically use the theoretical isotope distributions generated from the peptide sequences (as identified in the database search) and experimental mass spectral profiles of heavy and light peptide pairs.
Figure 1.
A workflow of peptide/protein ratio estimation using 18O-water labeling. Two samples are separately alkylated and digested with trypsin. One of the samples (normally treatment sample) is subjected to trypsin mediated 16O/18O exchange in 18O-water. Then, the labeled and unlabeled samples are mixed and analyzed in a LC-MS/MS system. Peptides and proteins are identified using tandem mass spectra and protein sequence databases. Quantification software MassXplore was used to estimate relative ratios of heavy and light peptide pairs from their mass profiles.
Data
We used two datasets: the first was obtained from extracts of mouse renal cortex35, with heavy and light peptides mixed in a 1(H):1(L) concentration; the second included peptides of bovine serum albumin mixed in five different concentrations. Details related to sample preparation and data acquisition are described in the Supplementary Materials section, along with the procedures for database searching and ratio estimations. We used a 3% false discovery rate (FDR)36,37 as the threshold for accepting peptide identifications from combined forward and reversed protein sequence databases38,39. The data acquired from samples of mouse cortical extract was used as a training set. It contained 29241 spectra, of which 2003 passed the 3% FDR threshold and were used in training. For these 2003 spectra, we used in-house software, MassXplorer40, to calculate peptide ratios.
Spectral Features
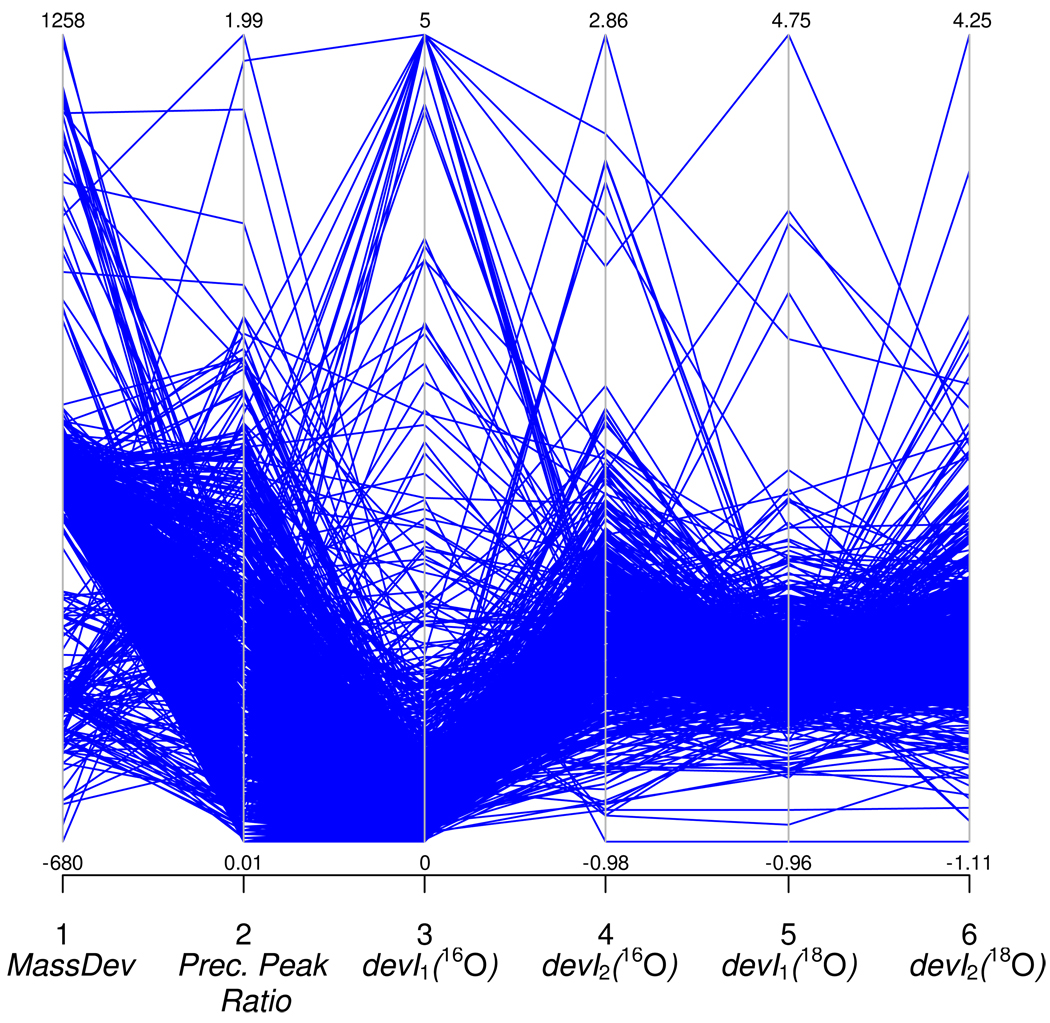
To build a classifier for MS data, each spectrum should be described by a vector of numerical features. The features must describe characteristics of mass spectra (profiles of heavy and light peptide pairs) that quantify their deviance from the expected theoretical isotope distributions. In this work, we used nine features describing mass measurement deviations, S/N, and differences between the experimental and theoretical isotopic distributions. Distributions of six of the features, computed for the training dataset, are shown in Figure 2 as parallel coordinates. Our goal was to train an SVM classifier to distinguish spectra of different quality based on feature distributions illustrated in the figure. All features used to train and test an SVM classifier were normalized to zero mean and unit variance. Below we describe our features in detail.
Figure 2.
Plot of the first 6 features (non-normalized) out of 9 used by our SVM classifier, for the mouse data set, shown as parallel coordinates. Points tend to cluster along a path, showing some structure in the data. The SVM classifier was trained to use this structure for classifying spectra whose isotopic and spectral features significantly deviate from theoretically expected values.
Mass Accuracy
Correct detection of isotopic peaks in mass spectra of heavy and light peptide pairs is crucial for accurate ratio estimations41. Methods for peak detection normally fit experimental mass profiles with theoretically computed isotope distributions. If the peptide assignment to a spectrum is a false identification (which results in a wrong theoretical isotope distribution), or ion abundance is low and mixed with noise, or a co-eluting contaminant has distorted isotopic profiles of the target species, the peak position will most likely be wrongly assigned. We used the difference between the theoretical mass (Mtheoretical, calculated from the sequence assigned to the spectrum) and the spectral mass (Mspectral, calculated from the position of the monoisotopic peak on the spectrum) expressed in parts per million (PPM) to characterize mass deviation or mass accuracy. It was computed using the following equation:
Figure 2 shows that the distribution of mass deviations (the first coordinate) is centered. This distribution, which can also be seen in Figure S1 of the Supplementary Materials section, suggests that spectra with mass deviations far from the center of the distribution are erroneous peak assignments and that the ratios computed for these spectra will not be reliable.
Signal-to-Noise Ratio
S/N is known to be an important factor affecting the accuracy of ratio estimations in high-throughput experiments16. It has also been shown that the median of abundances can serve as a good estimate of noise levels42. This approach originally used the half-width value of the intensity density as an estimate of noise level, however, a recent work uses the median itself16. We used the median of all abundances in a zoom scan to estimate the noise signal. The S/N was then calculated as the ratio of the smallest heavy and light peptides' monoisotopic peaks to the noise signal. In the Results and Discussion section we show the distribution of ratios with S/N for test dataset.
Isotope Deviations
The differences between theoretical and experimental isotopic patterns is another useful quality measure of spectra. Denoting the theoretical isotope series as Mi and the experimental isotope series as Ii, we computed three deviations (i = 1, 2, 3) for profiles of light and heavy peptides by using the following equation:
where M0 and I0 are abundance levels of the theoretical and experimental monoisotopic peaks, respectively. Note that these features also allow us to quantify spectral distortions caused by contaminant species.
Distributions of the first two isotope deviations for light and heavy peptides are shown as parallel coordinates in Figure 2 (third to sixth coordinates). Figure S2 in the Supplementary Materials shows the distribution of all isotope deviations. The larger the deviation of the experimental isotope distribution from the expected theoretical isotope distribution, the more likely it is that the profiles of the target species have been affected by contaminants or instrumental fluctuations.
Preceding Peak Ratio
Following the review of large numbers of spectra in our previous work40, we noticed that a good measure of interference of contaminating species with the isotopic peaks of target species can be calculated by dividing the intensity of the non-target peak preceding the target monoisotopic peak by the intensity of the latter. An example of a spectrum for which this feature will have an unusually high value is shown in Figure S3 in the Supplementary Materials. In case when preceding peak cannot be identified, we set this feature equal to zero. Preceding peak ratio is depicted as the second coordinate in Figure 2; its separate distribution is shown in Supplementary Figure S4.
SVM Classifier
Support vector machine is an efficient data classification technique43 successfully used in many fields44, including proteomics45. We trained SVM with a Gaussian kernel in the R environment46, by using e1071 package implementing the LIBSVM library47. SVM parameters C and γ were selected based on a 10-fold cross validation, in which the following values were tested: 1, 10, 50, 100, 200, and 500 for C; 0.0005, 0.001, 0.002, 0.004, 0.008, 0.01, 0.05, 0.1, 0.2, and 0.5 for γ. The final parameters used in training were: C = 100, γ = 0.05. We also used unbalanced class weights (see below).
To train a classifier, we need to have a training set of spectra in which every spectrum has a class label: positive (good quality) or negative (distorted). Generally, there is no optimal approach to classifying the spectra into positive and negative classes. Manual validation is subjective, while classification based on ratios is potentially inaccurate, as a correct ratio may be produced for a distorted spectrum by chance. Following Bakalarski and colleagues16, we labeled our training spectra based on the corresponding calculated peptide ratios and mass accuracy. We considered this approach to be appropriate enough for the purpose of the present work.
A spectrum was labeled as positive if the peptide ratio calculated from it fell in the interval [Rmode – 0.23 Rmode, Rmode + 0.23 Rmode], where Rmode = 1.12 was the mode of all ratios calculated for the mouse dataset. Otherwise, it was labeled as negative (distorted). A spectrum was also labeled as negative if, regardless of its ratio, its mass deviation fell outside the interval [MassDevmedian – 100 PPM, MassDevmedian + 100 PPM], where MassDevmedian = 211 PPM was the median of mass deviations for the mouse dataset. The threshold 0.23 was chosen to balance class sizes, relative error of ratios in the positive class, and the accuracy of the classifier on the training set. The threshold of the mass deviation was chosen from the distribution of the corresponding density function, Figure S1.
The mean (1.19), median (1.14) and mode (1.12) of peptide ratios calculated for mouse dataset did not differ much from each other. However, we preferred to use the mode of ratios in labeling of the training set as a less biased estimate of the true ratio.
Following the rules described above, 1,388 mouse spectra were assigned to the positive class, and 615 - to the negative class. Because of the unbalanced sizes of the classes, we provided the following class weights for the SVM training procedure: 2.2 for negative class and 1 for positive class. These parameters were manually adjusted to obtain the desirable sensitivity and specificity of the classifier.
SVM with a Gaussian kernel classifies a new data point (vector) x by using a decision function of the form
where xi are training vectors; L is the total number of training vectors; αi and b are coefficients adjusted in the training process; yi denotes class membership for vector xi and is equal to 1 for the positive class, and to −1 for the negative class; and γ is a parameter of the Gaussian kernel. If g(x) > 0, then data point x is assigned to the positive class. Otherwise, it is assigned to the negative class. Training vectors xi that have nonzero coefficients αi are called support vectors, and these are the only vectors that contribute to the value of the decision function, g(x).
The value of the decision function can be used as a score quantifying quality of a given profile. Ideally, a positive score would correspond to a mass profile without contaminants and with a high S/N, while a negative score would indicate the presence of artifacts affecting the profile, distorting the theoretical isotope distribution, and likely leading to unreliable ratio estimations.
Results and Discussion
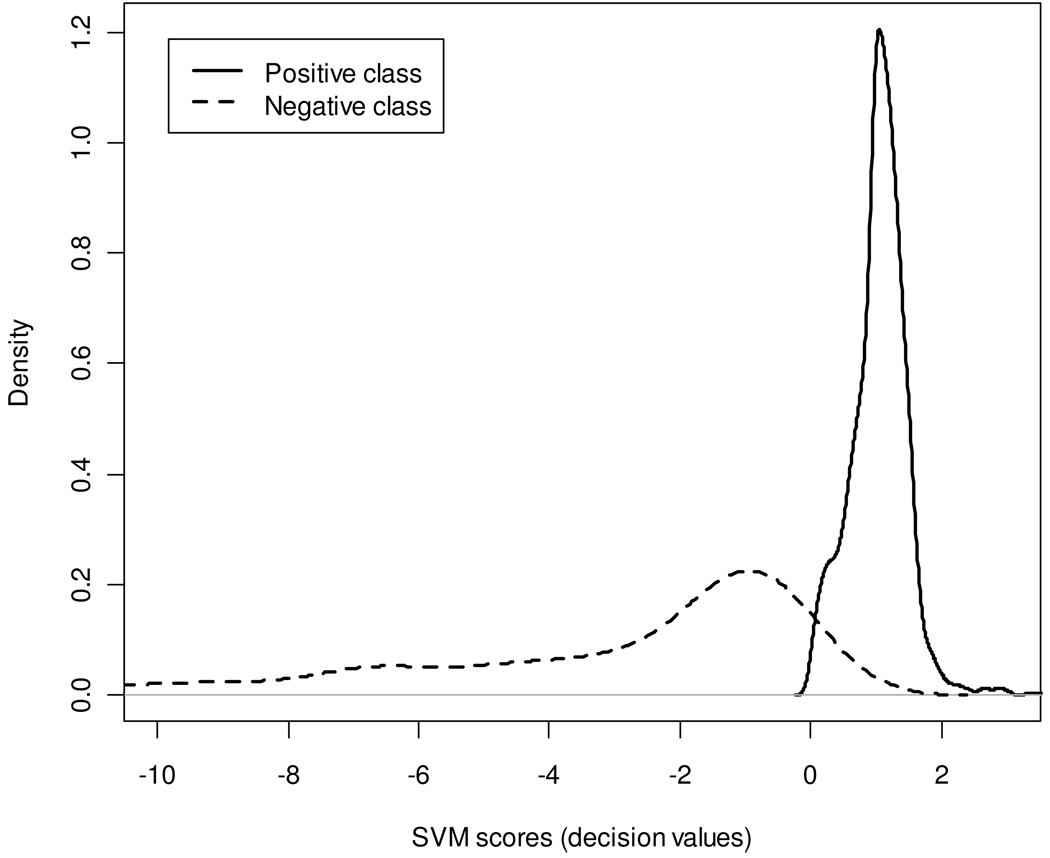
The accuracy of the SVM classifier in a 10-fold cross validation on the mouse dataset varied from 79.5% to 87.5%. The average accuracy was 82.7%. The final classifier, trained on all mouse data, had training accuracy of 86.7%, with a 93.7% sensitivity and 70.9% specificity (with respect to the positive class). Figure 3 shows SVM score density functions for the two classes obtained from the training set. The densities are well separated and their modes are clearly pronounced. A graph of peptide ratios for the mouse data before and after filtering by the classifier is shown in Figure S5 of the Supplementary Materials section.
Figure 3.
Score density functions of the SVM classifier for the positive (solid line) and negative (broken line) classes.
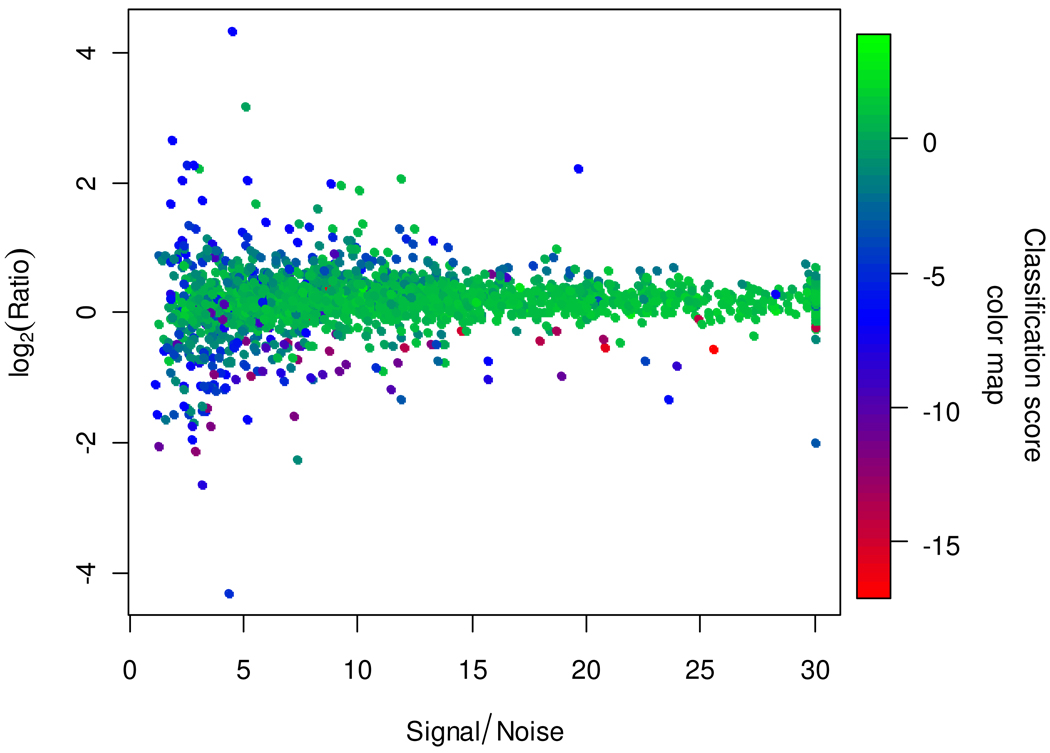
Figure 4 shows a scatter plot of the logarithm of peptide ratios versus S/N for the mouse data. The color of each point is determined by its SVM classification score (decision value). The proportion of spectra classified into the positive class is higher among spectra with higher S/N, though some of the latter are correctly classified into the negative class based on other spectral features. Most of the spectra having strongly deviant ratios are correctly classified into the negative class. The variance of ratios for spectra classified into the positive class is 6 times smaller than that of ratios of all spectra (0.06 versus 0.37).
Figure 4.
Scatter plot of the logarithm of peptide ratios versus S/N for the mouse data. The color of each point is determined by its SVM classification score. The proportion of good spectra (positive scores, green colors) is higher among spectra with higher S/N, though some of the latter are correctly classified as bad (negative scores, blue and red colors) based on other spectral features.
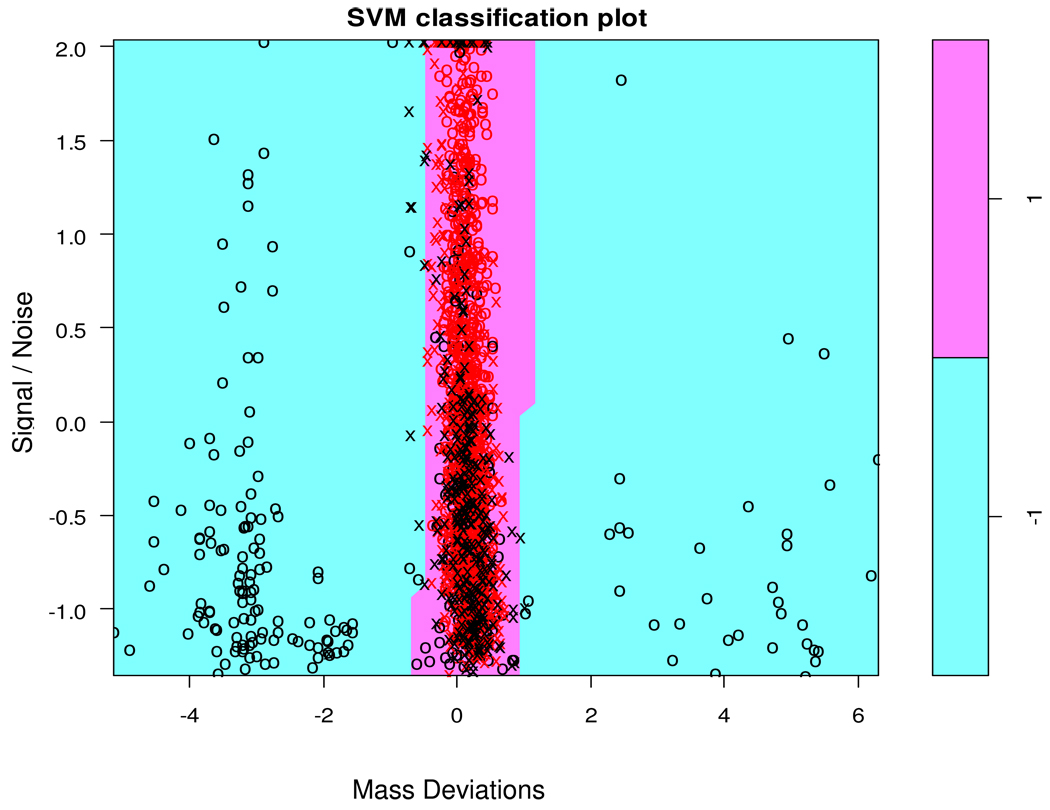
Figure 5 shows data points corresponding to mass spectra of the mouse data and the separating surface of the SVM classifier, projected onto the plane that is parallel to the MassDev and S/N axes and intercepts other seven axes at the median values of the corresponding features. The white region corresponds to the positive class, while the cyan region – to the negative class. We can see that spectra with large absolute values of the mass deviation are classified as negative, but the boundaries between the two classes are not rigid and vary with S/N. Support vectors of the SVM, denoted by black crosses, are located in the area of small mass shifts.
Figure 5.
Separating surface generated by the SVM classifier, projected onto the plane that is parallel to the MassDev and S/N axes and intercepts other seven axes at the median values of the corresponding features. The classifier assigned points from the white region to the positive class, and those from the cyan region – to the negative class. The crosses designated support vectors, i.e., the data points that were used to define the decision boundary. The cyan region contains spectra classified as negative, i.e., those that significantly deviate from the theoretical distributions.
We tested our classifier on five BSA samples. After classifying spectra, we calculated the means, modes, and coefficients of variance for peptide ratios derived from spectra in the positive class, and found that filtering by the SVM classifier decreased the coefficient of variation (CV) for four samples, and did not change it for sample 5(H):1(L), Table 1. The decrease in the ratio’s CV was larger for samples with the peptide ratios equal to or less than 1. For two samples with ratios larger than 1, CV's had been relatively small in the original data, and there was little or no improvement obtained by applying the SVM classifier. The best result was obtained for the sample 1(H):3(L), where the CV decreased nine-fold. We can also see from the table that the reduction in CV's was achieved by filtering out between 26% and 37% of the spectra in each dataset, and that the filtering either improved or did not change the means of ratios. The final CV's were comparable for all samples, ranging from 0.1 to 0.4.
Table 1.
The number of spectra, means, modes, and coefficients of variance for peptide ratios derived from five BSA samples (before filtering, after filtering by SVM, and after filtering by S/N).
| Peptide ratio (heavy to light) |
Number of spectra |
Mean | Mode | Coefficient of variation |
|---|---|---|---|---|
| before filtering / after filtering by SVM / after filtering by S/Na | ||||
| 1:5 | 424 / 302 | 0.6 / 0.3 / 0.5 | 0.2 / 0.2 / 0.3 | 2.2 / 0.4 / 0.9 |
| 1:3 | 475 / 352 | 0.6 / 0.4 / 0.5 | 0.3 / 0.3 / 0.4 | 1.8 / 0.2 / 0.7 |
| 1:1 | 545 / 344 | 1.0 / 1.0 / 1.0 | 0.9 / 0.9 / 0.9 | 0.4 / 0.1 / 0.2 |
| 3:1 | 509 / 343 | 2.3 / 2.3 / 2.3 | 2.6 / 2.5 / 2.5 | 0.3 / 0.2 / 0.2 |
| 5:1 | 432 / 278 | 3.3 / 3.3 / 3.4 | 3.8 / 3.5 / 3.6 | 0.3 / 0.3 / 0.3 |
The number of spectra filtered by S/N was set equal to the number of spectra filtered by the SVM classifier.
To evaluate results obtained using SVM filtering, we also did filtering based on single S/N feature (Table 1), where a certain number of spectra with the highest S/N was removed. For each dataset, this number was set equal to the number of spectra filtered out by the SVM classifier. It is seen from the table that for three samples this filtering resulted in CV's that were higher than those obtained after SVM filtering, while for two samples CV's were the same. This shows that SVM filtering based on a set of features describing spectral quality is more efficient than filtering based solely on S/N, yet the latter certainly is a very informative descriptor of spectral quality.
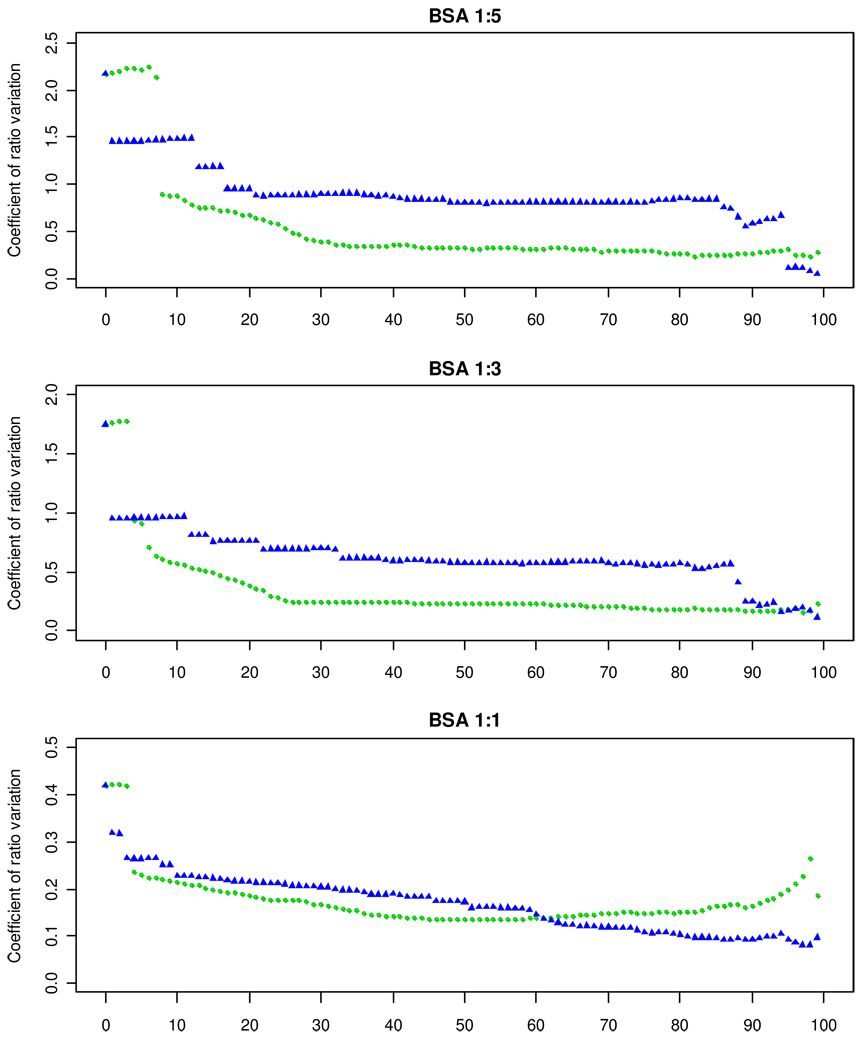
Figure 6 shows in more detail how the coefficient of ratio variation changes when SVM or S/N are used to filter out spectra. It shows results for three BSA samples (1(H):5(L), 1(H):3(L) and 1(H):1(L)) for which unfiltered CV's were large. For the SVM-based method, improvement of the CV becomes fairly stable when about 30% of spectra is filtered out. For all but very high levels of filtering, SVM-based method usually yields better CV than S/N-based method. Figure S6 in the Supplementary Materials section shows similar graphs for BSA samples with peptide ratios larger than 1.0. For these datasets the original CV's were relatively small and their improvement by both filtering methods was not very prominent.
Figure 6.
Coefficient of ratio variation as a function of the percentage of spectra filtered by S/N (blue triangles) and SVM-based (green circles) methods for three BSA samples: 1(H):5(L), 1(H):3(L) and 1(H):1(L). The improvement of the CV's obtained by using SVM becomes fairly stable when about 30% of spectra is filtered out.
Bakalarski and coworkers16, concerned with similar analysis of high resolution mass data, reported that filtering of spectra by using their mass precision algorithm, applied to a 1(H):1(L) test sample, reduced the variance of ratios by 1.2 times for spectra with S/N > 10 and by 3.1 times for spectra with S/N < 10. Our SVM classifier, applied to the 1(H):1(L) BSA sample, reduced the variance of ratios 16-fold.
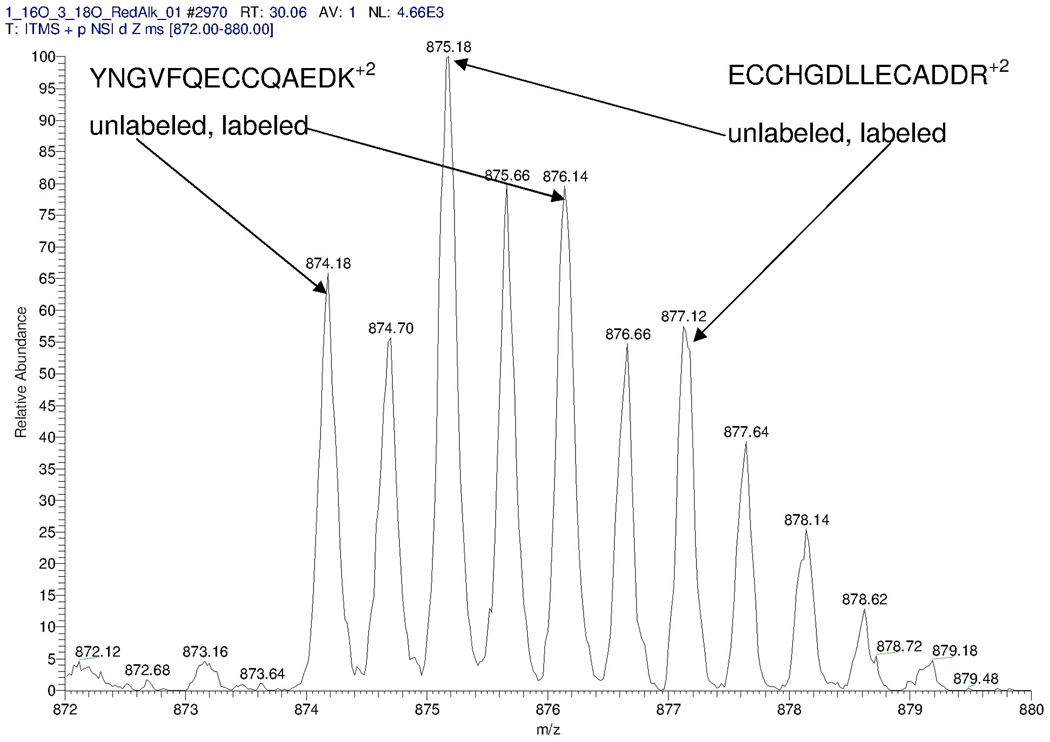
Our classifier was capable of identifying spectra with co-eluting peptides. Consider Figure 7, showing a mass profile from 3(H):1(L) BSA sample, with calculated peptide ratio of 1.6. This spectrum is an example of overlapping profiles of two co-eluting species: the target peptide YNGVFQECCQAEDK (monoisotopic mass 1746.7 Da) and another BSA peptide, ECCHGDLLECADDR (monoisotopic mass 1748.66 Da). The identities of these peptides were determined from the database search. The positions of the monoisotopic peaks were assigned correctly. The co-elution led to a large difference between the theoretical and experimental isotope distributions of the target peptide and erroneous ratio estimation. The SVM classifier correctly identified this spectrum as distorted with a score of −4.2.
Figure 7.
Co-elution of target peptide pairs and a contaminant that leads to an error in ratio estimations. The target pair is the heavy and light forms of BSA peptide YNGVFQECCQAEDK, identified from the database search of the corresponding MS/MS spectrum. The peptide’s charge is +2, and its monoisotopic peak is located at 874.18 Th. The contaminating peptide’s charge is +2, and its monoisotopic peak is at 875.18 Th. This is another BSA peptide, ECCHGDLLECADDR, which was identified from the database search of the MS/MS spectrum acquired only a few seconds later. This spectrum was assigned an SVM score of −4.2 and was correctly classified into the negative class.
SVMs with nonlinear kernels allow the accurate and robust classification of complex data. One of their drawbacks, however, is the limited explanatory power. That is, they do not provide explicit information about the importance of the features in decision making. Contributions from all of the features are aggregated in the form of a decision function value. However, we believe that co-elution is perhaps the most serious problem hindering accurate peptide quantification. The complexity and amount of co-elution depends on specific techniques used to separate peptide mixtures before they enter a mass spectrometer, so some experiments may result in more co-eluting profiles than others. The negative effect of co-elution on ratio estimation depends on the abundance of the co-eluting species with respect to the abundance of the target species. If the abundance of the co-eluting species is much higher than that of the target species, then accurate ratio estimation will require deconvolution of the overlapping signals, which is very difficult without knowing the amino acid composition of the contaminant. On the other hand, low-abundant contaminants may still allow reasonably accurate ratio estimations.
In machine learning, classifiers are trained to identify classes from distributions of features observed in a training dataset. In general, these distributions may change from dataset to dataset. Normalization of the features helps to reduce this effect. However, it may happen that, in order to deal with a different experimental setup, our SVM classifier would need to be retrained to account for experiment-dependent distributions of the spectral features. On the other hand, we believe that results presented in this paper show that such spectral features can be used to develop automated procedures for the assessment of quality of MS data.
Conclusion
In quantitative proteomics experiments, four types of variation have been associated with ratio measurements13,48. Biological variance is caused by fluctuations between individual biological subjects; instrumental variance is caused by measurement fluctuations in mass, abundance, and co-elutions; processing variance is caused by processing steps in quantitative proteomics, including digestion, labeling, and mixing; and finally, treatment variance is caused by differences in protein expression levels due to the treatment. In this work, we focused on reducing artificial fluctuations in ratio estimation resulting from instrumental measurements and associated phenomenon of distorted isotopic profiles. We have developed an SVM classifier to help automate ratio estimations in 18O-water labeling experiments. The classifier uses 9 spectral features including mass accuracy, S/N and difference between experimental and theoretical isotopic distributions. We trained and tested the classifier on six samples with known peptide abundance ratios. We showed that it is capable of identifying such artifacts as contaminant species, noise interference, and fluctuations in instrumental measurements, which usually result in a wrong peak assignment and/or distorted isotopic profiles. In 10-fold cross validation, the accuracy of the classifier was 83% on the training data. When applied to testing data, performance of the classifier was evaluated by measuring a decrease in ratio variance for mass spectra classified as being of good quality. The coefficients of variance for the ratios calculated using the 5 testing sets decreased up to 9-fold.
Supplementary Material
Acknowledgements
This work was supported in part by “Clinical Proteomics Centers in Biodefense and Emerging Infectious Diseases” (NIAID contract HHSN272200800048C).
Abbreviations
- BSA
bovine serum albumin
- Da
Dalton
- FDR
false discovery rate
- SVM
support vector machine
- H
heavy
- L
light
- LC-MS
liquid chromatography – mass spectrometry
- LTQ
Thermo Fisher Scientific linear quadrupole ion trap
- MS/MS
tandem mass spectrometry
- m/z
mass-to-charge ratio
- S/N
signal-to-noise ratio
- Th
the Thomson, unit of m/z
Footnotes
Supporting Information Available.
In Supplement 1 we present Figures S1–S6 that show distributions of spectral features in the training dataset and the ratio distributions before and after filtering by the SVM and S/N models.
References
- 1.Fenselau C, Yao X. 18O2-labeling in quantitative proteomic strategies: a status report. J.Proteome.Res. 2009;8:2140–2143. doi: 10.1021/pr8009879. [DOI] [PubMed] [Google Scholar]
- 2.Yao X, Freas A, Ramirez J, Demirev PA, Fenselau C. Proteolytic 18O labeling for comparative proteomics: model studies with two serotypes of adenovirus. Anal.Chem. 2001;73:2836–2842. doi: 10.1021/ac001404c. [DOI] [PubMed] [Google Scholar]
- 3.Schnolzer M, Jedrzejewski P, Lehmann WD. Protease-catalyzed incorporation of 18O into peptide fragments and its application for protein sequencing by electrospray and matrix-assisted laser desorption/ionization mass spectrometry. Electrophoresis. 1996;17:945–953. doi: 10.1002/elps.1150170517. [DOI] [PubMed] [Google Scholar]
- 4.Dasari S, Wilmarth PA, Reddy AP, Robertson LJ, Nagalla SR, David LL. Quantification of Isotopically Overlapping Deamidated and (18)O-Labeled Peptides Using Isotopic Envelope Mixture Modeling. J.Proteome.Res. 2009 doi: 10.1021/pr801054w. [DOI] [PMC free article] [PubMed] [Google Scholar]
- 5.Miyagi M, Rao KC. Proteolytic 18O-labeling strategies for quantitative proteomics. Mass Spectrom.Rev. 2007;26:121–136. doi: 10.1002/mas.20116. [DOI] [PubMed] [Google Scholar]
- 6.Lopez-Ferrer D, Ramos-Fernandez A, Martinez-Bartolome S, Garcia-Ruiz P, Vazquez J. Quantitative proteomics using 16O/18O labeling and linear ion trap mass spectrometry. Proteomics. 2006;6 Suppl 1:S4–S11. doi: 10.1002/pmic.200500375. [DOI] [PubMed] [Google Scholar]
- 7.Fernandez-de-Cossio J, Gonzalez LJ, Satomi Y, Betancourt L, Ramos Y, Huerta V, Besada V, Padron G, Minamino N, Takao T. Automated interpretation of mass spectra of complex mixtures by matching of isotope peak distributions. Rapid Commun.Mass Spectrom. 2004;18:2465–2472. doi: 10.1002/rcm.1647. [DOI] [PubMed] [Google Scholar]
- 8.Halligan BD, Slyper RY, Twigger SN, Hicks W, Olivier M, Greene AS. ZoomQuant: an application for the quantitation of stable isotope labeled peptides. J.Am.Soc.Mass Spectrom. 2005;16:302–306. doi: 10.1016/j.jasms.2004.11.014. [DOI] [PMC free article] [PubMed] [Google Scholar]
- 9.Johnson KL, Muddiman DC. A method for calculating 16O/18O peptide ion ratios for the relative quantification of proteomes. J.Am.Soc.Mass Spectrom. 2004;15:437–445. doi: 10.1016/j.jasms.2003.11.016. [DOI] [PubMed] [Google Scholar]
- 10.Mason CJ, Therneau TM, Eckel-Passow JE, Johnson KL, Oberg AL, Olson JE, Nair KS, Muddiman DC, Bergen HR., III A method for automatically interpreting mass spectra of 18O-labeled isotopic clusters. Mol.Cell Proteomics. 2007;6:305–318. doi: 10.1074/mcp.M600148-MCP200. [DOI] [PubMed] [Google Scholar]
- 11.Mirgorodskaya OA, Kozmin YP, Titov MI, Korner R, Sonksen CP, Roepstorff P. Quantitation of peptides and proteins by matrix-assisted laser desorption/ionization mass spectrometry using (18)O-labeled internal standards. Rapid Commun.Mass Spectrom. 2000;14:1226–1232. doi: 10.1002/1097-0231(20000730)14:14<1226::AID-RCM14>3.0.CO;2-V. [DOI] [PubMed] [Google Scholar]
- 12.Bellew M, Coram M, Fitzgibbon M, Igra M, Randolph T, Wang P, May D, Eng J, Fang R, Lin C, Chen J, Goodlett D, Whiteaker J, Paulovich A, McIntosh M. A suite of algorithms for the comprehensive analysis of complex protein mixtures using high-resolution LC-MS. Bioinformatics. 2006;22:1902–1909. doi: 10.1093/bioinformatics/btl276. [DOI] [PubMed] [Google Scholar]
- 13.Bantscheff M, Schirle M, Sweetman G, Rick J, Kuster B. Quantitative mass spectrometry in proteomics: a critical review. Anal.Bioanal.Chem. 2007;389:1017–1031. doi: 10.1007/s00216-007-1486-6. [DOI] [PubMed] [Google Scholar]
- 14.Yang C, Yang C, Yu W. A regularized method for peptide quantification. J.Proteome Res. 2010;9:2705–2712. doi: 10.1021/pr100181g. [DOI] [PubMed] [Google Scholar]
- 15.Ong SE, Blagoev B, Kratchmarova I, Kristensen DB, Steen H, Pandey A, Mann M. Stable isotope labeling by amino acids in cell culture, SILAC, as a simple and accurate approach to expression proteomics. Mol.Cell Proteomics. 2002;1:376–386. doi: 10.1074/mcp.m200025-mcp200. [DOI] [PubMed] [Google Scholar]
- 16.Bakalarski CE, Elias JE, Villen J, Haas W, Gerber SA, Everley PA, Gygi SP. The impact of peptide abundance and dynamic range on stable-isotope-based quantitative proteomic analyses. J.Proteome Res. 2008;7:4756–4765. doi: 10.1021/pr800333e. [DOI] [PMC free article] [PubMed] [Google Scholar]
- 17.Breiman L. Random forests. Machine Learning. 2001;45:5–32. [Google Scholar]
- 18.May D, Law W, Fitzgibbon M, Fang Q, McIntosh M. Software platform for rapidly creating computational tools for mass spectrometry-based proteomics. J.Proteome Res. 2009;8:3212–3217. doi: 10.1021/pr900169w. [DOI] [PMC free article] [PubMed] [Google Scholar]
- 19.Sturm M, Bertsch A, Gropl C, Hildebrandt A, Hussong R, Lange E, Pfeifer N, Schulz-Trieglaff O, Zerck A, Reinert K, Kohlbacher O. OpenMS - an open-source software framework for mass spectrometry. BMC.Bioinformatics. 2008;9:163. doi: 10.1186/1471-2105-9-163. [DOI] [PMC free article] [PubMed] [Google Scholar]
- 20.Hoopmann MR, Finney GL, MacCoss MJ. High-speed data reduction, feature detection, and MS/MS spectrum quality assessment of shotgun proteomics data sets using high-resolution mass spectrometry. Anal.Chem. 2007;79:5620–5632. doi: 10.1021/ac0700833. [DOI] [PMC free article] [PubMed] [Google Scholar]
- 21.Kaur P, O'Connor PB. Algorithms for automatic interpretation of high resolution mass spectra. J.Am.Soc.Mass Spectrom. 2006;17:459–468. doi: 10.1016/j.jasms.2005.11.024. [DOI] [PubMed] [Google Scholar]
- 22.Du P, Angeletti RH. Automatic deconvolution of isotope-resolved mass spectra using variable selection and quantized peptide mass distribution. Anal.Chem. 2006;78:3385–3392. doi: 10.1021/ac052212q. [DOI] [PubMed] [Google Scholar]
- 23.Vapnik VN. An overview of statistical learning theory. IEEE Trans.Neural Netw. 1999;10:988–999. doi: 10.1109/72.788640. [DOI] [PubMed] [Google Scholar]
- 24.Schulz-Trieglaff O, Machtejevas E, Reinert K, Schluter H, Thiemann J, Unger K. Statistical quality assessment and outlier detection for liquid chromatography-mass spectrometry experiments. BioData.Min. 2009;2:4. doi: 10.1186/1756-0381-2-4. [DOI] [PMC free article] [PubMed] [Google Scholar]
- 25.Prakash A, Piening B, Whiteaker J, Zhang H, Shaffer SA, Martin D, Hohmann L, Cooke K, Olson JM, Hansen S, Flory MR, Lee H, Watts J, Goodlett DR, Aebersold R, Paulovich A, Schwikowski B. Assessing bias in experiment design for large scale mass spectrometry-based quantitative proteomics. Mol.Cell Proteomics. 2007;6:1741–1748. doi: 10.1074/mcp.M600470-MCP200. [DOI] [PubMed] [Google Scholar]
- 26.Mirza SP, Greene AS, Olivier M. 18O labeling over a coffee break: a rapid strategy for quantitative proteomics. J.Proteome.Res. 2008;7:3042–3048. doi: 10.1021/pr800018g. [DOI] [PMC free article] [PubMed] [Google Scholar]
- 27.Perkins DN, Pappin DJ, Creasy DM, Cottrell JS. Probability-based protein identification by searching sequence databases using mass spectrometry data. Electrophoresis. 1999;20:3551–3567. doi: 10.1002/(SICI)1522-2683(19991201)20:18<3551::AID-ELPS3551>3.0.CO;2-2. [DOI] [PubMed] [Google Scholar]
- 28.Mann M, Wilm M. Error-tolerant identification of peptides in sequence databases by peptide sequence tags. Anal.Chem. 1994;66:4390–4399. doi: 10.1021/ac00096a002. [DOI] [PubMed] [Google Scholar]
- 29.Eng JK, McCormack AL, Yates JR., III An Approach to Correlate Tandem Mass Spectral Data of Peptides with Amino Acid Sequences in a Protein Database. J.Am.Soc.Mass Spectrom. 1994;5:976–989. doi: 10.1016/1044-0305(94)80016-2. [DOI] [PubMed] [Google Scholar]
- 30.Sadygov R, Wohlschlegel J, Park SK, Xu T, Yates JR., III Central limit theorem as an approximation for intensity-based scoring function. Anal.Chem. 2006;78:89–95. doi: 10.1021/ac051206r. [DOI] [PubMed] [Google Scholar]
- 31.Craig R, Beavis RC. TANDEM: matching proteins with tandem mass spectra. Bioinformatics. 2004;20:1466–1467. doi: 10.1093/bioinformatics/bth092. [DOI] [PubMed] [Google Scholar]
- 32.Geer LY, Markey SP, Kowalak JA, Wagner L, Xu M, Maynard DM, Yang X, Shi W, Bryant SH. Open mass spectrometry search algorithm. J.Proteome.Res. 2004;3:958–964. doi: 10.1021/pr0499491. [DOI] [PubMed] [Google Scholar]
- 33.Tanner S, Shu H, Frank A, Wang LC, Zandi E, Mumby M, Pevzner PA, Bafna V. InsPecT: identification of posttranslationally modified peptides from tandem mass spectra. Anal.Chem. 2005;77:4626–4639. doi: 10.1021/ac050102d. [DOI] [PubMed] [Google Scholar]
- 34.Meng F, Cargile BJ, Miller LM, Forbes AJ, Johnson JR, Kelleher NL. Informatics and multiplexing of intact protein identification in bacteria and the archaea. Nat.Biotechnol. 2001;19:952–957. doi: 10.1038/nbt1001-952. [DOI] [PubMed] [Google Scholar]
- 35.Zhao Y, Denner L, Haidacher SJ, LeJeune WS, Tilton RG. Comprehensive analysis of the mouse renal cortex using two-dimensional HPLC – tandem mass spectrometry. Proteome Science. 2008;6:15. doi: 10.1186/1477-5956-6-15. [DOI] [PMC free article] [PubMed] [Google Scholar]
- 36.Benjamini Y, Hochberg Y. Controlling the False Discovery Rate: a Practical and Powerful Approach to Multiple Testing. Journal of Royal Statistical Society. 1995;57:289–300. [Google Scholar]
- 37.Storey JD, Tibshirani R. Statistical significance for genomewide studies. Proc.Natl.Acad.Sci.U.S.A. 2003;100:9440–9445. doi: 10.1073/pnas.1530509100. [DOI] [PMC free article] [PubMed] [Google Scholar]
- 38.Moore RE, Young MK, Lee TD. Qscore: an algorithm for evaluating SEQUEST database search results. J.Am.Soc.Mass Spectrom. 2002;13:378–386. doi: 10.1016/S1044-0305(02)00352-5. [DOI] [PubMed] [Google Scholar]
- 39.Elias JE, Gygi SP. Target-decoy search strategy for increased confidence in large-scale protein identifications by mass spectrometry. Nat.Methods. 2007;4:207–214. doi: 10.1038/nmeth1019. [DOI] [PubMed] [Google Scholar]
- 40.Sadygov RG, Zhao Y, Haidacher SJ, Starkey JM, Tilton RG, Denner L. Using power spectrum analysis to evaluate (18)O-water labeling data acquired from low resolution mass spectrometers. J.Proteome Res. 2010;9:4306–4312. doi: 10.1021/pr100642q. [DOI] [PMC free article] [PubMed] [Google Scholar]
- 41.Piening BD, Wang P, Bangur CS, Whiteaker J, Zhang H, Feng LC, Keane JF, Eng JK, Tang H, Prakash A, McIntosh MW, Paulovich A. Quality control metrics for LC-MS feature detection tools demonstrated on Saccharomyces cerevisiae proteomic profiles. J.Proteome Res. 2006;5:1527–1534. doi: 10.1021/pr050436j. [DOI] [PubMed] [Google Scholar]
- 42.Horn DM, Zubarev RA, McLafferty FW. Automated reduction and interpretation of high resolution electrospray mass spectra of large molecules. J.Am.Soc.Mass Spectrom. 2000;11:320–332. doi: 10.1016/s1044-0305(99)00157-9. [DOI] [PubMed] [Google Scholar]
- 43.Vapnik VN. The nature of statistical learning theory. 2nd ed. New York: Springer; 2000. ed. [Google Scholar]
- 44.Hastie T, Tibshirani R, Friedman JH. The elements of statistical learning data mining, inference, and prediction. 2nd ed. New York: Springer; 2009. ed. [Google Scholar]
- 45.Anderson DC, Li W, Payan DG, Noble WS. A new algorithm for the evaluation of shotgun peptide sequencing in proteomics: support vector machine classification of peptide MS/MS spectra and SEQUEST scores. J.Proteome Res. 2003;2:137–146. doi: 10.1021/pr0255654. [DOI] [PubMed] [Google Scholar]
- 46.R Development Core Team. R: A Language and Environment for Statistical Computing. R Foundation for Statistical Computing. 2010 Ref Type: Computer Program. [Google Scholar]
- 47.Chang C-C, Lin C-J. LIBSVM: a library for support vector machines. 2001 Ref Type: Computer Program. [Google Scholar]
- 48.Oberg AL, Vitek O. Statistical design of quantitative mass spectrometry-based proteomic experiments. J.Proteome Res. 2009;8:2144–2156. doi: 10.1021/pr8010099. [DOI] [PubMed] [Google Scholar]
Associated Data
This section collects any data citations, data availability statements, or supplementary materials included in this article.


