

Abstract
Prevailing psychometric theories of intelligence posit that individual differences in cognitive performance are attributable to three main sources of variance: the general factor of intelligence (g), cognitive ability domains, and specific test requirements and idiosyncrasies. Cortical thickness has been previously associated with g. In the present study, we systematically analyzed associations between cortical thickness and cognitive performance with and without adjusting for the effects of g in a representative sample of children and adolescents (N = 207, Mean age = 11.8; SD = 3.5; Range = 6 to 18.3 years). Seven cognitive tests were included in a measurement model that identified three first-order factors (representing cognitive ability domains) and one second-order factor representing g. Residuals of the cognitive ability domain scores were computed to represent g-independent variance for the three domains and seven tests. Cognitive domain and individual test scores as well as residualized scores were regressed against cortical thickness, adjusting for age, gender and a proxy measure of brain volume. g and cognitive domain scores were positively correlated with cortical thickness in very similar areas across the brain. Adjusting for the effects of g eliminated associations of domain and test scores with cortical thickness. Within a psychometric framework, cortical thickness correlates of cognitive performance on complex tasks are well captured by g in this demographically representative sample.
Keywords: General intelligence, cognitive abilities, cognitive performance, cognitive domains, factor analysis, cortical thickness
INTRODUCTION
Human intelligence has been defined as “a very general mental capability that, among other things, involves the ability to reason, plan, solve problems, think abstractly, comprehend complex ideas, learn quickly and learn from experience. It is not merely book learning, a narrow academic skill, or test-taking smarts. Rather, it reflects a broader and deeper capability for comprehending our surroundings - ‘catching on’, ‘making sense’ of things, or ‘figuring out’ what to do ” (Gottfredson, 1997). This definition, which stresses the general nature of the intelligence construct, is consistent with the phenomenon called ‘positive manifold’: scores on cognitive ability tasks of all kinds are positively correlated. In other words, people who achieve high scores on a test of any one aspect of intelligence are likely to score above average on others (Neisser et al., 1996). This empirical fact is nuanced by the finding that scores on tests that are more similar in content are more closely correlated with each other than with tests that have different content (Deary et al., 2010).
A widely accepted framework for representing these correlational patterns is a hierarchical arrangement with a general intelligence factor (g) at the apex that contributes to several more specialized cognitive ability domains arrayed below it, which in turn contribute to individual test scores (Carroll, 1993; Deary et al., 2010; Johnson et al., 2004; Johnson et al., 2008; Neisser et al., 1996). According to this view, individual differences in test performance can be accounted for by the combined influence of general intelligence (g), specific cognitive ability domains (sometimes called group factors of intelligence), and skills specific to each test. Of course, apart from this hierarchy of sources of cognitive variance, observed scores will reflect error variance and non-cognitive individual influences at the time of performing the test. That said, the general factor, g, is typically the major source of variance in test scores, accounting for 40% or more of total variance in performance on mental test batteries in representative samples (Carroll, 1993; Deary et al., 2010; Jensen, 1998).
Recently, efforts have been made to link components of this psychometric model of intellectual function to measures of brain structure and function revealed by brain imaging (Deary et al., 2010; Haier et al., 2009a). Indeed, it is reasonable to hypothesize that neural correlates of performance can be found for each of the components of the model. It has therefore been suggested that these sources of variance be partitioned in order to assess the respective contributions of brain structure and/or function to cognitive performance for the different levels of the model (Colom et al., 2009; Colom et al., 2007; Haier et al., 2009a; Jung and Haier, 2007).
An accumulating body of work has linked specific features of brain structure to general intelligence with a fair amount of consistency. A recent review concluded that a distributed network of multimodal association areas consisting of the dorsolateral prefrontal cortex (DLPF), the inferior and superior parietal lobule, the anterior cingulate cortex (ACC) and parts of the temporal and occipital lobes is highly correlated structurally, functionally and/or biochemically to general intellectual ability (Jung and Haier, 2007). These findings led to the proposal of a Parieto-Frontal Integration Theory (P-FIT) of intelligence, according to which, sensory information is first processed by temporal and occipital areas for subsequent integration and abstraction in parietal areas. Problem evaluation is then implemented by the prefrontal cortex and response selection mediated via the anterior cingulate. Consistent with this proposal, Colom et al. (2009) used voxel-based morphometry to demonstrate positive associations between scores representing g and gray matter concentration in several clusters including the dorsolateral prefrontal cortex, Broca's and Wernicke's areas, the somato-sensory association cortex, and the visual association cortex. Converging findings came from a study of 241 patients with focal brain damage, using voxel-based lesion-symptom mapping (Glascher et al., 2010), in which a measure of g was associated with damage within a distributed network in frontal and parietal brain regions as well as with lesions in white matter association tracts in frontopolar areas. These findings suggested that the general factor of intelligence reflects the efficacy of regions integrating verbal, visuospatial, working memory, and executive processes and their connections.
In a prior study, we demonstrated associations between a measure of g and measures of cortical thickness in a representative sample of 216 healthy children and adolescents between the ages of 6 and 18 from the NIH MRI Study of Normal Brain Development (Karama et al., 2009). Cortical thickness has significant advantages in terms of precision and interpretability over voxel-based morphometry, as detailed elsewhere (Karama et al., 2009). Significant associations were documented in most multimodal association areas of the cerebral cortex, somewhat more pronounced on the left side. Although the associations appeared somewhat stronger in adolescents than children, these differences did not achieve statistical significance. These results were generally consistent with the P-FIT model, although more associations were found with medial structures than that model would have predicted.
To date, neuroimaging studies have addressed structural brain correlates of crystallized and fluid intelligence (Gray and Thompson, 2004) as well as of verbal and performance IQ, in addition to full scale IQ (Andreasen et al., 1993; Luders et al., 2007; Luders et al., 2010; Witelson et al., 2006). However, brain imaging studies have yet to characterize the structural correlates of the different levels of the psychometric model including more specific cognitive ability domains and test performance. The objective of the current study was to extend this line of research further by examining associations between local measures of cortical thickness and (a) the general factor of intelligence; (b) cognitive domains/group factors; and (c) specific test scores in the same sample of children and adolescents from the NIH MRI Study of Normal Brain Development reported previously (Karama et al., 2009). In light of previous work (Colom et al., 2009; Deary et al., 2010; Flashman et al., 1997; Glascher et al., 2010; Jung and Haier, 2007; Luders et al., 2009), associations between cortical thickness and the various measures of cognitive performance were expected to be widely distributed and to cluster around association areas, but to differ depending upon task demands. Given the large proportion of test score variance explained by g, however, we hypothesized that adjusting statistically for the effects of g would significantly attenuate the degree and extent of the associations between cognitive domain and test scores, and local cortical thickness, thereby revealing more constrained and localized areas of association for the more specific abilities at lower levels of the hierarchy.
METHODS
Sampling and Recruitment
Data were obtained from the Pediatric MRI Data Repository (Release 2.0) created for the NIH MRI Study of Normal Brain Development (Evans and Brain Development Cooperative Group, 2006), a multi-site longitudinal project aimed at providing a normative database to characterize healthy brain maturation in relation to behavior. A listing of the participating sites and of the study investigators can be found at: http://www.bic.mni.mcgill.ca/nihpd/info/participating_centers.html.
This data base includes 433 children from 4:6 to 18:3 years of age at enrollment who underwent extensive cognitive, neuropsychological and behavioral testing along with three MRI brain imaging sessions (two years apart). Data from the first cross-sectional visit were used here. As this study aimed to study healthy subjects, exclusion criteria included (but were not limited to) prior history of medical illnesses with CNS implications, IQ < 70, intra-uterine exposure to substances known or highly suspected to alter brain structure or functions. For further details regarding sampling procedures and exclusion criteria, see Evans et al. (2006) as well as Waber et al. (2007).
Psychometric Measures
A comprehensive neuropsychological test battery was administered on the day of or within a few days of brain scanning. For a thorough description, see Waber et al. (2007). The cognitive ability measures included for the present study were the Wechsler Abbreviated Scale of Intelligence (WASI) (Wechsler, 1999) and three subtests from the Woodcock-Johnson Psycho-Educational Battery-III (Woodcock et al., 2001). The WASI consists of the Vocabulary, Similarities, Matrix Reasoning, and Block Design subtests; the WJ-III subtests included Letter-Word Identification, Passage Comprehension, and Calculation. These measures are intended for the age range of the individuals included in the current study. Standardized scores were used for all analyses.
Magnetic Resonance Imaging Acquisition Protocol
A three-dimensional T1-weighted (T1W) Spoiled Gradient Recalled (SPGR) echo sequence from 1.5 Tesla scanners was obtained on each participant, with 1mm isotropic data acquired sagittally from the entire head. Slice thickness of ~1.5mm was allowed for GE scanners due to their limit of 124 slices. In addition, T2-weighted (T2W) and proton density-weighted (PDW) images were acquired using a two-dimensional (2D) multi-slice (2mm) dual echo fast spin echo (FSE) sequence. Total acquisition time was ~25 minutes and was often repeated when indicated by the scanner-side quality control process. Some subjects were unable to tolerate this procedure and received a fallback protocol that consisted of shorter 2D acquisitions with slice thickness of 3mm (Evans and Brain Development Cooperative Group, 2006).
Magnetic Resonance Image Processing
In order to obtain local cortical thickness measurements for each subject, all MRI images were processed by the CIVET pipeline (version 1.1.9) developed at the MNI for fully automated structural image analysis (Ad-Dab'bagh et al., 2006; Kim et al., 2005; MacDonald et al., 2000). Steps, detailed elsewhere (Karama et al., 2009), include 1) Registering images to a standardized space; 2) producing high-resolution hemispheric surfaces with 40962 vertices each; 3) registering surfaces to a high-resolution template to establish inter-subject correspondence of vertices; 4) applying a reverse of step 1 to allow cortical thickness estimations in the native space of each subject; 5) calculating cortical thickness at each vertex using the t-link metric (Lerch and Evans, 2005); and 6) smoothing using a 20-milimeter kernel.
Data Set
The data set for the present study was compiled based on availability of the requisite psychometric data and quality control of the imaging data. Of the 433 participants at Visit 1, 392 had MRI acquisitions that passed raw imaging data quality control (QC). Of these 392, 33 subjects were eliminated because they were less than 6 years of age and did not have WASI scores (WASI norms start at 6). A further 9 were eliminated because WJ-III scores were not available. Due to the sensitivity of post-acquisition processing methods that produce corticometric measures on the native MR images, individuals with “fallback” acquisition protocols, whether for T1W or T2W/PDW spectra, were excluded from the present study because of insufficient resolution for precise cortical thickness estimation. Of the 350 participants with the full complement of MRI and behavioral data, 107 had T1W and/or T2W/PD fallback protocols, leaving 243 with adequate data. Finally, visual QC (blinded to cognitive ability scores) of the native cortical thickness images was conducted to eliminate scans with aberrations in cortical thickness estimations. Thirty-six scans demonstrated obvious problems with the cortical thickness maps (e.g., in a few cases, parts of the frontal lobe were truncated due to failed automatic brain masking while in other cases, ringing artifacts led to fused gyri or clearly aberrant cortical thickness values) and were eliminated from further analysis, leaving a final sample size of 207.
Table 1 shows demographic and IQ characteristics of the full Objective 1 Visit 1 sample and the analyzed sample. With the exception of age, no statistically significant demographic differences were documented. The higher mean age for the analyzed sample was mostly due to excluding children below age 6.
Table 1.
Demographic and WASI Full Scale IQ characteristics of original sample and of accepted sample
| Objective 1 visit 1 Sample | Accepted Sample | Statistics | |
|---|---|---|---|
| n=431 | n=207 | ||
| Age (yrs) | 10.4±3.8 (range: 4.6 to 18.3 years) | 11.8±3.5 (range: 6.0 to 18.3 years) | t = 4.47, p < 0.001 |
| Proportion of males | 48.0% | 44.4% | χ2 = 0.72, p =.396 |
| Proportion with low/medium/high adjusted SES* | 24.4%/40.8%/34.8% | 22.2%/38.6%/39.1% | χ2 = 1.16, p =.56 |
| WASI-FSIQ** | 110.7±12.5** | 111.0±12.0 | t = 0.29, p =0.29 |
| Proportion of Whites/African Americans/Other | 73.5%/8.4%/18.1% | 74.4%/8.2%/17.4% | χ2 = 0.06, p =.97 |
When appropriate, means ± standard deviations are provided
Based on the US Departement of Housing and Urban Development method for comparing family income levels as a function of regional costs of living
WASI IQ data available for only 380 subjects out of the 431 of the original sample
The 'Other' category includes American Indian, Alaskan Native, Asian, Native Hawaiian or Other Pacific Islander, and those for which ethnicity or race was not provided or for which parents came from different racial or ethnic backgrounds
Measurement Model and Variable Development
To define the measurement model, we used factor analysis to explore the patterns of correlation among the 7 cognitive tests (Figure 1). Parallel analysis indicated that three factors representing distinct cognitive domains could be distinguished. The calculation, letter-word identification, and comprehension WJ-III tests defined the first domain (which we labeled Academic Skills), the WASI Similarities and Vocabulary subtests, defined a second domain (which we labeled Verbal Reasoning), and the Block Design and Matrix Reasoning tests defined the third domain (which we labeled Spatial Reasoning). g was defined as a higher-order factor accounting for correlations among the domains (Table 2). Fit indices for the measurement model were good: RMSEA = .040, χ2(11) = 14.65, χ2/df = 1.3, CFI = .99.
Figure 1.
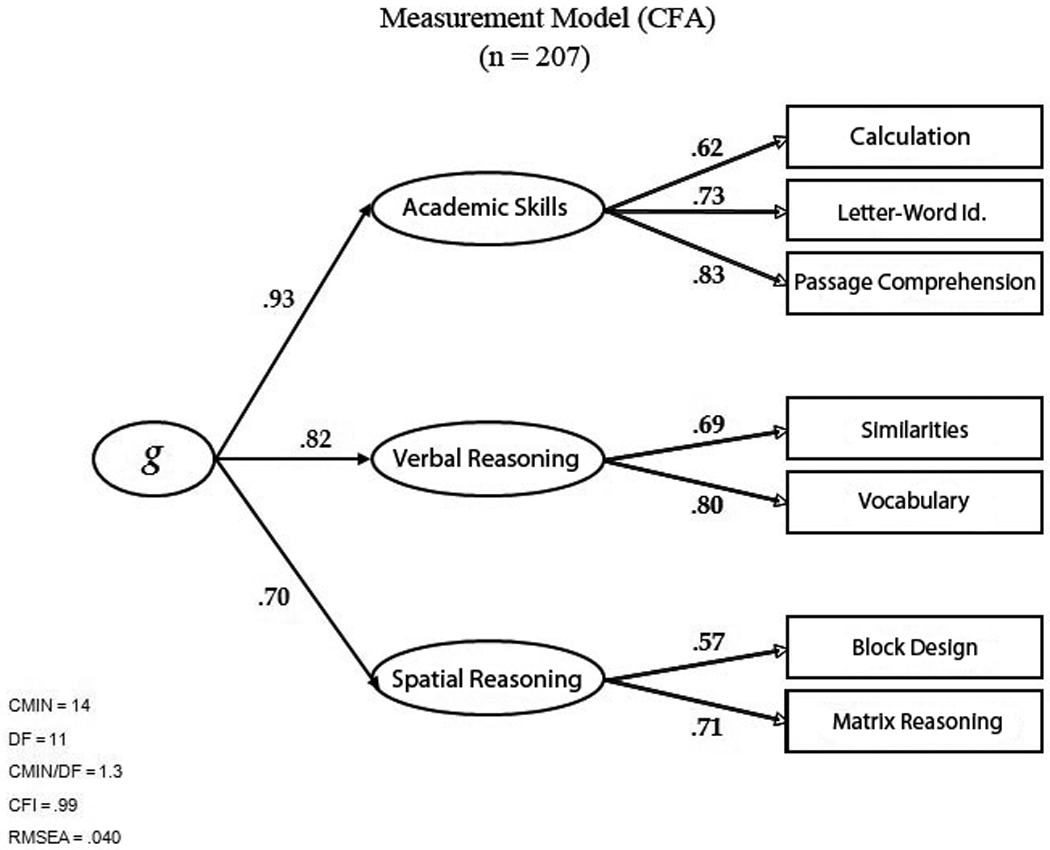
Measurement model for the cognitive ability measures.
Table 2.
Pearson correlations between the Academic Skills, Verbal Reasoning, and Spatial Reasoning domains.
| Domain | Academic Skills | Verbal Reasoning | Spatial Reasoning |
|---|---|---|---|
| Academic Skills | .76 | .65 | |
| Verbal Reasoning | .58 |
Second, we calculated a g score for each participant using the first unrotated principal factor computed from principal axis factoring. This factor accounted for about 39% of the variance in test performance, consistent with prior estimates. A second principal axis factor analysis, followed by a Promax rotation, was computed to obtain factor scores for the three cognitive ability domains. Both g scores and first-order factor scores were approximately normally distributed (skewness and kurtosis values were all above −1 and below 1).
Third, the cognitive ability domain scores were regressed against g scores. Variance unpredicted by g -- the residuals from these regression analyses -- was considered to represent ‘g-independent’ Academic Skills, Verbal Reasoning, and Spatial Reasoning scores. These ‘g-independent’ cognitive ability domain residual scores were of course uncorrelated with the g score, and all three correlated positively only with their contributing tests. Importantly, these ‘g-independent’ cognitive ability domain scores displayed a wide range of values and were approximately normally distributed (see Figure 2) with skewness and kurtosis values all above −1 and below 1.
Figure 2.
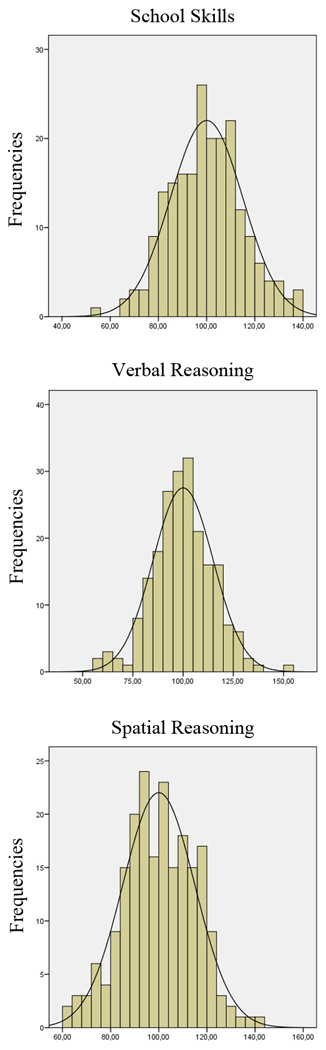
Distribution of g-independent cognitive ability domain scores. Note the approximately normal distribution.
Finally, we computed seven different g scores in order to estimate ‘g-independent’ scores for each test. Each of these scores was based on only six tests instead of the available seven to avoid inadvertently controlling for the contribution of the test of interest when controlling for g. For instance, ‘Block Design’-free g scores were computed after removing the ‘Block Design’ test. We carried out one regression analysis for each test, using the appropriate g score as the independent variable and the respective specific test score as the dependent variable. Residuals from these regression analyses were considered to represent ‘g-independent’ specific test scores. The test residuals displayed a wide range of values and were approximately normally distributed with skewness and kurtosis values all between 1 and −1.
Handedness
A measure of hand preference was adapted from the Edinburgh Handedness Inventory (Oldfield, 1971). It included handwriting and seven gestural commands. The criterion for hand preference was defined as at least seven of eight responses with the same hand (Waber et al., 2007).
Cortical Thickness Statistical Analyses
Statistical analyses were conducted using SurfStat, a statistical toolbox created for MATLAB 7 (The MathWorks, Inc.) at the MNI (Worsley et al., 2004) (http://www.math.mcgill.ca/keith/surfstat). Each individual’s absolute native-space cortical thickness was linearly regressed against the measure of interest (e.g., g scores) using a first-order linear model at each cortical thickness sampling point while accounting for the effects of gender, age, a proxy measure of brain volume (pBV)1, and MRI scanners from the six sites. Although handedness was initially included as a regressor, it did not contribute significantly to the model and so was discarded.
In order to explore the associations between cortical thickness and the cognitive variables of interest, the following model was fitted to each one of the 81924 cortical thickness sampling points:
-
Y ~ b0 + b1CV + b2Age + b3Gender + b4Scanner + b5pBV + ε
Where:
Y = Cortical Thickness
CV = Cognitive variable of interest
pBV = proxy measure of Brain Volume
b0 = Y intercept
b1 to b5 = regression coefficients for effects of the different regressors
ε = error term
For each cortical thickness sampling point, the coefficient of the CV regressor, b1, was estimated and a resultant t-test value calculated, thereby producing a three-dimensional t-statistic map. A t-statistic threshold of statistical significance was established, taking into account multiple comparisons via the False Discovery Rate (FDR) method (Benjamini and Hochberg, 1995; Genovese et al., 2002). The FDR value is the expected proportion of false positives among all cortical points where the t-value is above the selected threshold. Thus, setting the threshold to an FDR of 0.05 implies that it is expected that 5% of all cortical points having a t-value above threshold are false positives. Here, two thresholds were used: a FDR of 0.05 was used as the statistically significant threshold while a FDR of 0.25 was used to look for trends. While a FDR value of 0.25 is somewhat arbitrary, it is a threshold that has frequently been used to look for trends (Isganaitis et al., 2009; Wang et al., 2010; Zhang et al., 2010). For the purpose of visualization, resultant thresholded q values were projected on an average surface template generated from the ICBM152 data set (Lyttelton et al., 2007).
In order to assess whether or not findings differed with age, an 'age by cognitive variable of interest' interaction term was added to the model. This was done for each cognitive variable.
RESULTS
Cortical thickness was positively associated with the full g score (i.e., the g score extracted from the complete set of 7 tests) in a wide network of bilateral areas (Figure 3). The magnitudes of these correlations for statistically significant foci were in the modest to moderate range (0.15 to 0.34). Analogous analyses for the three cognitive ability domain scores revealed a similar bilateral and distributed pattern of association (see left side of Figure 4). Although not surprising given their high correlations with g, the highest peaks of statistical significance for the three domains were within a few mm of those observed for the full g scores.
Figure 3.
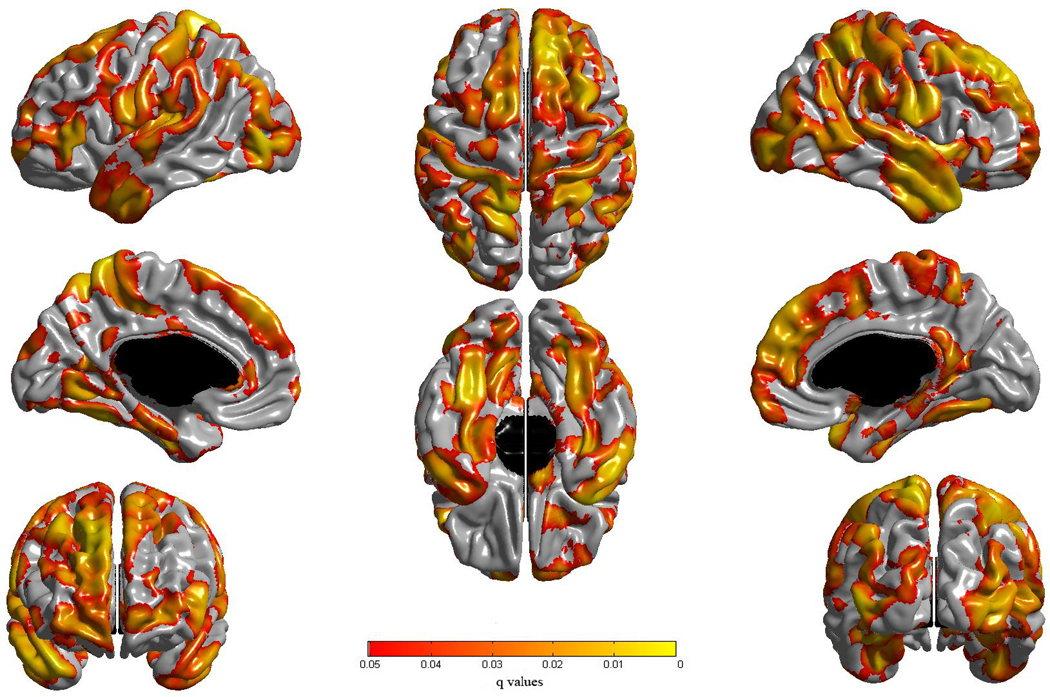
Results of cortical thickness regressed against g. An FDR threshold of 0.05 is used to control for multiple comparisons across the brain. Colors, representing q values (which are metrics used for FDR that can be viewed as analogues to p values), are superimposed on left and right lateral average surface templates generated from the ICBM152 dataset. Results are corrected for gender, age, total brain volume and scanner.
Figure 4.
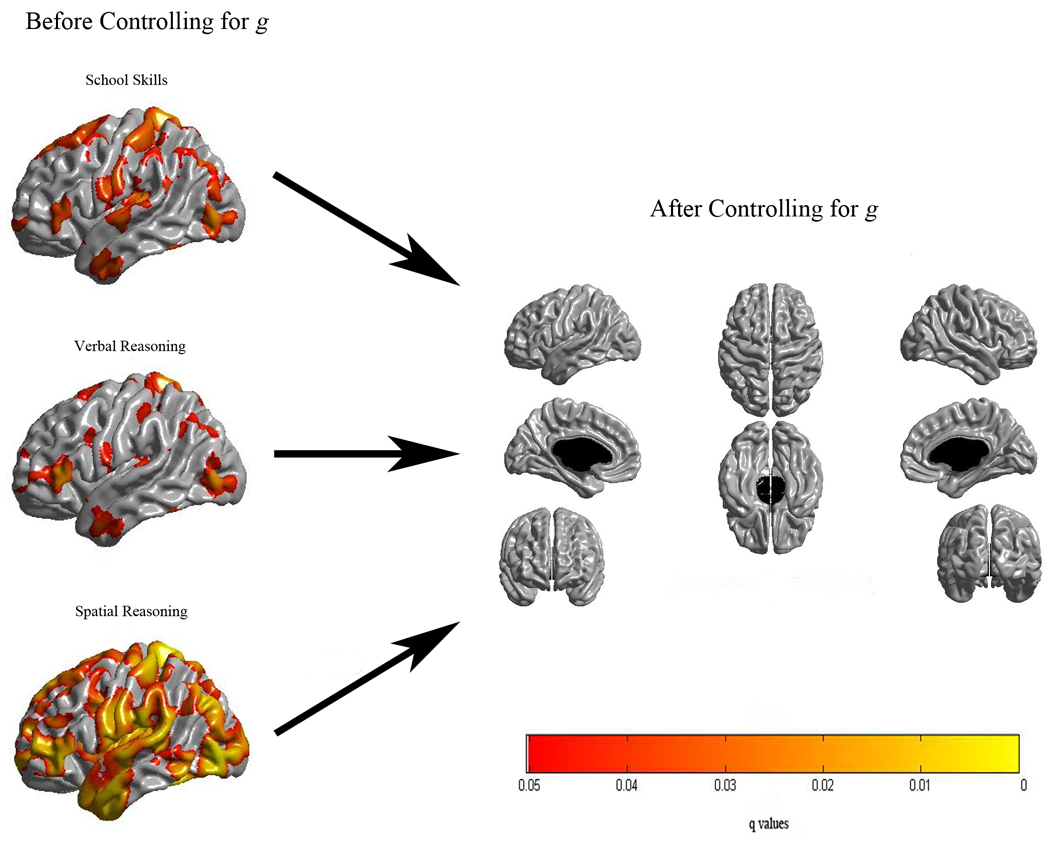
Results of cortical thickness regressed against each of the three domains before (left) and after (right) controlling for g. Here also, an FDR threshold of 0.05 is used to control for multiple comparisons across the brain and colors, representing q values, are superimposed on left and right lateral average surface templates generated from the ICBM152 dataset. Results are corrected for gender, age, total brain volume and scanner.
Individual test scores for Block Design, Matrix Reasoning, Vocabulary, and Passage Comprehension showed areas of significant association with cortical thickness. Matrix Reasoning and Passage Comprehension exhibited distributed patterns of peak associations very similar to those observed for g and the three cognitive domains; Vocabulary and Block Design exhibited relatively limited areas of association with cortical thickness. Nonetheless, the few observed areas of associations for these tests were within a few mm of peak areas observed for the g score (see Figure 5).
Figure 5.
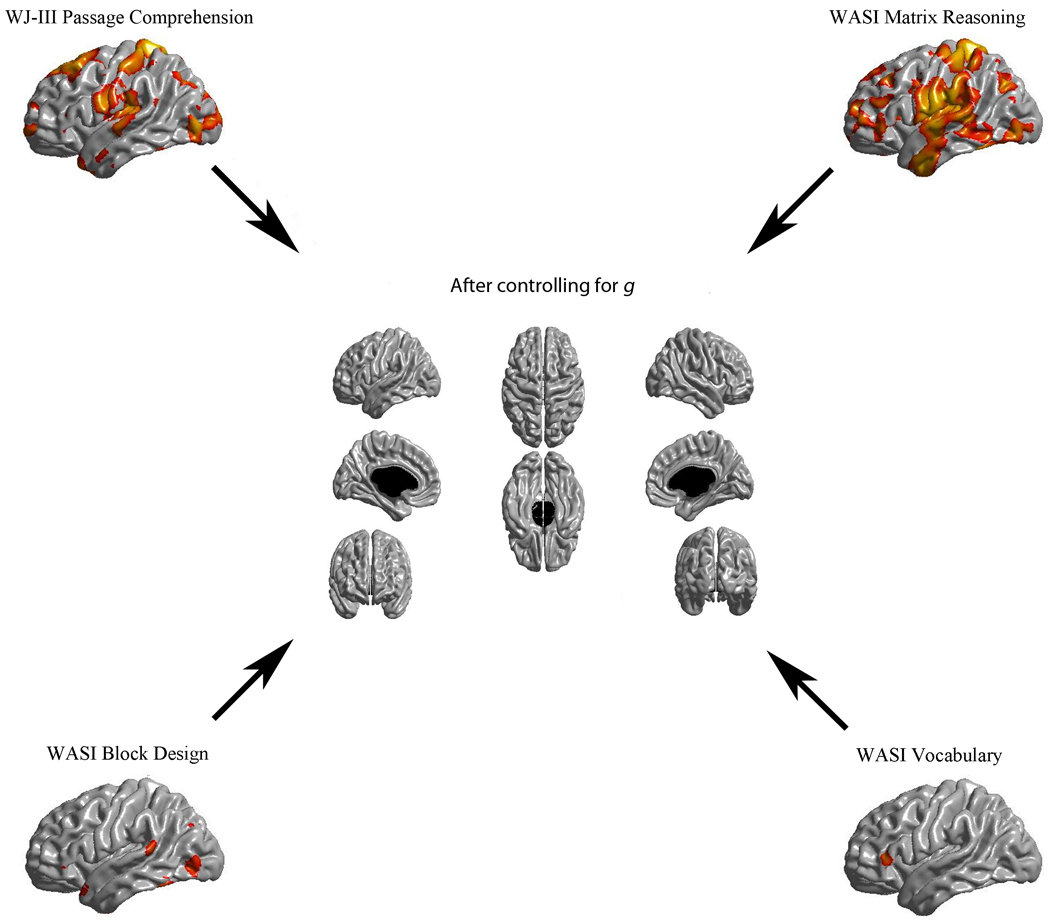
Results of cortical thickness regressed against the Passage Comprehension, Matrix Reasoning, Block Design, and Vocabulary tests before (periphery) and after (center) controlling for g. Here also, an FDR threshold of 0.05 is used to control for multiple comparisons and colors, representing q values, are superimposed on left and right lateral average surface templates generated from the ICBM152 dataset. Results are corrected for gender, age, scanner, and a proxy measure of brain volume.
For tables of significant peak coordinates for g, cognitive domains, and subtests, see supplemental Tables S1 to S8.
Trend level associations were investigated for tests for which cortical thickness associations were not demonstrated with the .05 FDR (i.e., Similarities, Letter-Word identification, and Calculation) by applying the more lenient FDR = 0.25 threshold. This exercise revealed a pattern of peak locations very similar to the one detected for g and the cognitive domains. Extending the search for trends to Vocabulary and Block Design, which demonstrated limited areas of associations at the original threshold, also led to a pattern of peak locations similar to the one observed for g and the cognitive domains.
Finally, cortical thickness maps for the variance specific to the three cognitive domains (g-adjusted residuals) revealed no areas of statistical association (Figure 4), nor were there associations for any of the g-adjusted individual test scores (Figure 5), even with the more lenient FDR = 0.25 threshold.
No 'age by cognitive variable of interest' interactions were observed.
DISCUSSION
The most important finding of the present work was that, after adjusting statistically for the effects of g, no significant associations between cortical thickness and performance remained for any of the cognitive domains or specific ability tests used here. This finding persisted, moreover, when a more lenient threshold of significance was applied to look for trends. Most of the association between the psychometrically distinct domains of cognitive performance measured here and local cortical thickness is thus well captured by g. A corollary implication is that there is no evidence, in this population-based sample, for the existence of areas in the brain where cortical thickness is specifically (i.e. ‘uncontaminated’ by the influence of g) related to levels of performance for particular abilities and skills.
It is possible, of course, that such areas do in fact exist but that the associated effect size for cortical thickness in these regions is too small to be detected by the current means despite the relatively large sample used here. An alternative is also that there are so many differences in the specific brain areas various individuals use to do different tasks that no one specific area stands out for g-independent performance on any given task at the group level. Whatever the case, our findings suggest that patterns of associations between cortical thickness and performance on complex tasks are likely not specific to these tasks.
Although specification of the nature of the processes that are common across tasks goes well beyond the scope of the current study, the identification of multimodal association areas suggests that the general intelligence factor reflects in part efficient higher-order integration across modalities. The widespread nature of the identified areas of gray matter, moreover, suggests that efficient functioning of these integrative regions could provide cognitive “power” to the more specific functional domains, thereby accounting for the consistency of identified regions despite the distinctions between ability domains established on a psychometric basis. Moreover, variations in cortical thickness may bear functional relationships to structural features not measured here, such as white matter tracts (He et al., 2007).
Findings presented here should not be viewed as contradicting accepted and well documented neuroscientific evidence for functional specialization of cortical regions. Indeed, the focus here pertains to only one anatomical metric, cortical thickness, thought to reflect the density and arrangement of neurons, neuroglia and nerve fibers (Narr et al., 2007). This study did not include other structural brain measurements, nor did it consider neurophysiological indicators of brain function. Along similar lines, results do not preclude the possibility that ability test scores independent of g may be related to brain correlates in older individuals (Haier et al., 2010). Nonetheless, within the framework of the sample and theoretical model employed here, it is fair to conclude that cortical thickness is most clearly related to general cognitive ability and not to specific ability domains, over and above their own relations with general cognitive ability.
g, all three cognitive domain scores, as well as Matrix Reasoning and Passage Comprehension test scores exhibited very similar patterns of association with cortical thickness. This finding is consistent with the assumption that matrix reasoning-type tasks are good indicators of fluid intelligence (Carpenter et al., 1990; Weschler, 1997), as well as that reading comprehension is better correlated with general intelligence than are single word reading or rote computation skills (Vellutino et al., 2000). A similar pattern of associations at the trend level was observed for Block Design, Vocabulary, Similarities, Calculation, and Letter-Word Identification. This consistency is reassuring and suggests that we may have been underpowered to detect associations for these tests at the a priori determined significance threshold. The existence of such a pattern common to all levels of the hierarchy model further explains why controlling for g -- which represents shared variance across tasks and domains -- eliminates cortical thickness associations for the more specific cognitive domain and test scores.
Comparison with our previous work
The present study extended prior work in which we demonstrated, using the 4 subtests from the WASI, that general cognitive ability was associated with measures of cortical thickness across widespread areas of cerebral cortex, most prominently in multimodal association areas (Karama et al., 2009). In the present study, we expanded the array of cognitive tests to include 3 subtests of the WJIII, a widely used measure of academic skills, in addition to the 4 subtests from the WASI, a brief measure of IQ. Based on these 7 tests, we demonstrated a measurement model consistent with prevailing psychometric models of intellectual function. It included 3 distinct cognitive domains, representing verbal abilities, perceptual abilities and academic skills, with shared variance accounting for approximately 40% of variance in test performance and consistent with g. We then generated brain maps demonstrating patterns of correlation with cortical thickness for g and the 3 cognitive domains, as well as each of the 7 individual measures. Although there were some differences among these maps, they generally involved patterns of peak association similar to those demonstrated for g.
It is noteworthy that the g against cortical thickness map presented in Figure 3 slightly differs from the general cognitive ability against cortical thickness map shown in Figure 1 of our previous work (Karama et al., 2009). The reasons for this are (a) the use here of a larger battery of cognitive tests to estimate g; (b) the estimation of g by principal axis factoring instead of principal component analysis which, in contrast to principal axis factoring, does not exclude error variance from the estimate of g (Jensen and Weng, 1994); (c) a decrease in sample size from 216 in our previous work to 207 here due to 9 subjects not having WJ-III data; and (d) controlling here for a proxy measure of brain volume.
Issues and Caveats
It is noteworthy that the mean WASI IQ of the population studied here is slightly above normal (mean ≈ 111). This is likely due to the use of strict exclusion criteria aimed at recruiting only healthy subjects. Indeed, the exclusion of subjects having a medical illness with CNS implications is likely to have eliminated subjects which, on average, have a lower IQ. The corollary of this would be a higher average IQ for the selected sample when compared with the usual samples used in the elaboration of cognitive test norms as the latter do not usually use such stringent exclusion criteria.
Another issue along similar lines pertains to the exclusion of 36 subjects due to poor cortical thickness maps. It is possible that such exclusion may have somewhat biased results. For instance, subjects with a very thick cortex may have failed automated masking because of relatively little CSF surrounding the cortex. The removal of such subjects may have led to a decrease in cortex thickness variance with the consequences of decreasing our ability to detect present but subtle cortical thickness associations with cognitive abilities.
Our findings may be highly dependent on the tests included here, which all have relatively high known correlations with g and tend to be complex tasks that involve many different mental processes. Had we included a task that relies on more specific mental procedures, such as picture identification, our findings could have been different. Nonetheless, the present findings suggest that neuroimaging studies focusing on cognitive performance may benefit from including an assessment of g in order to help interpret what is general versus what is specific.
Importantly, the existence of cortical thickness correlates for g as well as for the broad ability domains says little about the etiology of g. Indeed, being correlational in nature, results presented here are bound by the usual limitations associated with such data. Documentation of a correlation between g and cortical thickness in specific regions of the cerebral cortex does not mean, for example, that g is determined by characteristics of gray matter and especially that g is predetermined by genetically fixed characteristics of gray matter. Experimental studies have demonstrated that targeted experience can influence local cortical thickness or volume (Draganski et al., 2004; Driemeyer et al., 2008; Haier et al., 2009b), even in older adults (Boyke et al., 2008; Engvig et al., 2010). Potential impacts on children in particular, in whom plasticity may be greater, have yet to be explored. In any event, it is entirely plausible that experiential influences could have an important impact on gray matter structure in these key multimodal regions, especially in infants and young children, with potential implications for subsequent intellectual functioning as an epiphenomenon.
While cortical thickness may be one of many factors contributing to g (or vice versa), an alternative could be that a third factor (e.g., nerve growth factor) or set of factors is/are responsible for variation in both g and cortical thickness. While there is, to date, no compelling evidence to support an alternative of this type, such a situation could imply that increased cortical thickness is not in itself necessarily causative of increased g. That said, the existence of correlations between cortical thickness and g in known association areas suggests that the link between mental ability and cortical thickness in these areas is not an inconsequential finding. Further, since local cortical thickness ‘explains’ at best only about 15% of the variance in g, multiple neurobiological factors, perhaps in combination with cortical thickness, could contribute to the existence of differences in g (Jensen, 1998). Such a view is in keeping with accumulating evidence for associations between general intelligence and white matter integrity (Schmithorst et al., 2005), network efficiency (Li et al., 2009; Song et al., 2008; van den Heuvel et al., 2009), developmental trajectories of cortical thickness (Shaw et al., 2006), glucose metabolic rate (Haier et al., 2003; Haier et al., 1988; Haier et al., 1992), N-acetyl-aspartate levels (Jung et al., 2005) as well as corpus callosum thickness (Luders et al., 2007; Luders et al., 2010), as reviewed by Deary and colleagues (Deary et al., 2010).
Strengths
An important strength of the current study is the relatively large representative sample of the US population. Since the costs of recruiting a representative sample and of scanning large numbers of individuals are generally prohibitive, most imaging studies have been based on relatively small samples of convenience. Another strength includes the use, through a measurement model, of latent rather than observed variables as this is known to reduce the error in measurement of the abilities (Bollen, 1989; Schumacker and Lomax, 1996). Finally, when using different sets of tests for different age groups, variance in performance between subjects in different groups could be due to genuine cognitive differences between subjects in different groups as well as to the specific characteristics of the sets of tests administered to each age group. The use of the same set of tests across the entire age range studied here allowed to avoid potential phenotypic heterogeneity caused by the use of different sets of tests for different age groups.
Conclusion
In conclusion, after adjusting for the effects of g, we did not find significant associations between cortical thickness and performance on more specific cognitive domains or ability tests for a large representative sample of healthy children and adolescents. It follows that cortical thickness correlates of cognitive performance on complex tasks are well captured by g. An important implication is that patterns of associations between cortical thickness (and perhaps other neural features) and performance on complex tasks are unlikely to be specific to these tasks. Interpretation of results from cognitive neuroimaging studies may benefit from including an estimation of g in analytic models to more accurately evaluate specificity.
Supplementary Material
Acknowledgements
This project was conducted by the Brain Development Cooperative Group and supported by the National Institute of Child Health and Human Development, the National Institute on Drug Abuse, the National Institute of Mental Health, and the National Institute of Neurological Disorders and Stroke (Contract #s N01-HD02-3343, N01-MH9-0002, and N01-NS-9-2314, -2315, -2316, -2317, -2319 and -2320). Special thanks to the NIH contracting officers for their support. S.K. was supported by a Fellowship from the Fonds de Recherche En Santé du Québec. We also acknowledge the important contribution and remarkable spirit of John Haselgrove, Ph.D. (deceased).
Appendix A. Rationale for controlling for pBV instead of TBV2
There is a very strong correlation (>.75) between Cortical Gray Matter Volume and Mean Cortical Thickness (see Figure A1)3.
Cortical Gray Matter Volume constitutes more than 40% of TBV.
Given the high proportion of TBV that is constituted by Cortical Gray Matter and the very strong association between Cortical Gray Matter Volume and Cortical Thickness, controlling for TBV leads to partially controlling for cortical thickness.
In other words, using TBV in the present context ends up being somewhat akin to looking at the association between a behavioral measure and cortical thickness after partially controlling for cortical thickness.
As can be seen in the unthresholded brain maps of Figure A2, peak areas of association between cortical thickness and g after controlling for TBV or pBV are in the same regions. However, controlling for TBV lowers the statistical significance given that we are partially controlling for thickness -- note that the essential difference between controlling for TBV and pBV is a shift in t value levels (see color bar). Thresholding leads to a noticeable decrease in suprathreshold extent.
Briefly, controlling for pBV avoids removing the effect of interest while still allowing for a certain degree of control over the confounding effects of brain volume.
Figure A1 (Appendix).
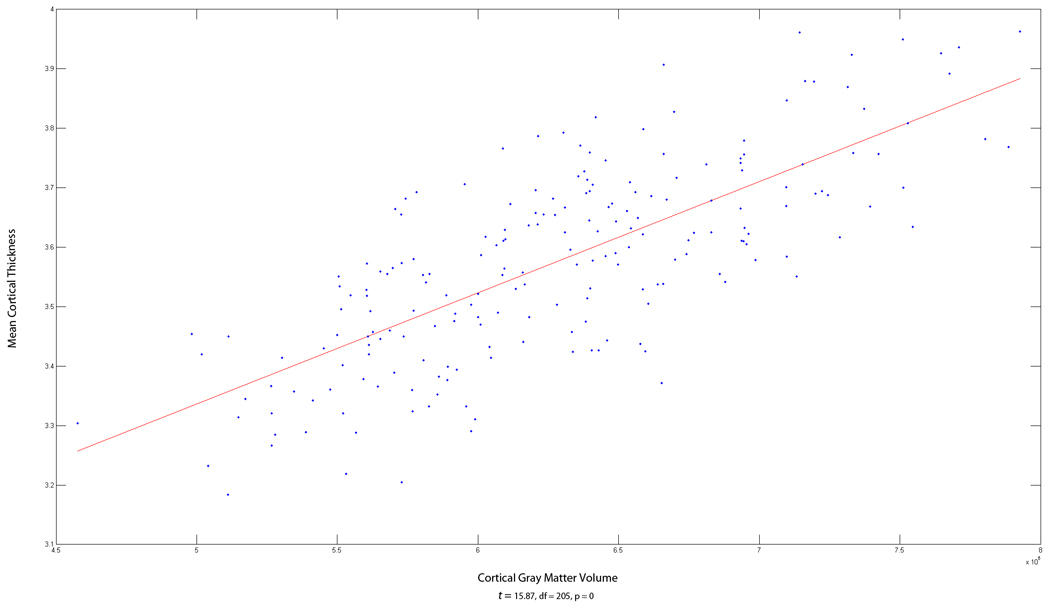
Plot of the association between Mean Cortical Thickness and Cortical Gray Matter Volume
Figure A2 (Appendix).
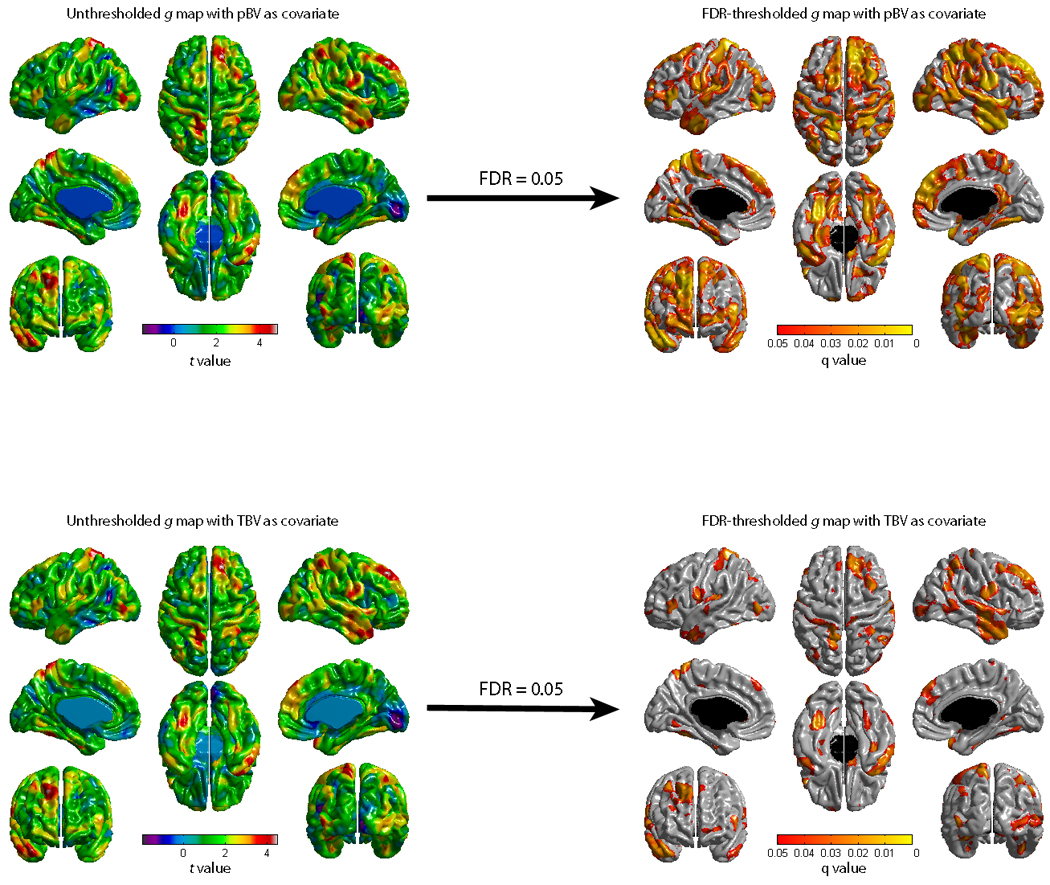
Figures showing the association between g and cortical thickness after controlling for pBV (White Matter + Intracerebral CSF + Subcortical Gray Matter) or TBV (White Matter + Intracerebral CSF + Cortical and Subcortical Gray Matter). The top right g map is identical to Figure 3 and is reproduced here for convenience to facilitate comparisons between figures.
Appendix B. Brain Development Cooperative Group
Key personnel from the six pediatric study centers are as follows: Children’s Hospital Medical Center of Cincinnati, Principal Investigator William S. Ball, M.D., Investigators Anna Weber Byars, Ph.D., Mark Schapiro, M.D., Wendy Bommer, R.N., April Carr, B.S., April German, B.A., Scott Dunn, R.T.; Children’s Hospital Boston, Principal Investigator Michael J. Rivkin, M.D., Investigators Deborah Waber, Ph.D., Robert Mulkern, Ph.D., Sridhar Vajapeyam, Ph.D., Abigail Chiverton, B.A., Peter Davis, B.S., Julie Koo, B.S., Jacki Marmor, M.A., Christine Mrakotsky, Ph.D., M.A., Richard Robertson, M.D., Gloria McAnulty, Ph.D; University of Texas Health Science Center at Houston, Principal Investigators Michael E. Brandt, Ph.D., Jack M. Fletcher, Ph.D., Larry A. Kramer, M.D., Investigators Grace Yang, M.Ed., Cara McCormack, B.S., Kathleen M. Hebert, M.A., Hilda Volero, M.D.; Washington University in St. Louis, Principal Investigators Kelly Botteron, M.D., Robert C. McKinstry, M.D., Ph.D., Investigators William Warren, Tomoyuki Nishino, M.S., C. Robert Almli, Ph.D., Richard Todd, Ph.D., M.D., John Constantino, M.D.; University of California Los Angeles, Principal Investigator James T. McCracken, M.D., Investigators Jennifer Levitt, M.D., Jeffrey Alger, Ph.D., Joseph O’Neil, Ph.D., Arthur Toga, Ph.D., Robert Asarnow, Ph.D., David Fadale, B.A., Laura Heinichen, B.A., Cedric Ireland B.A.; Children’s Hospital of Philadelphia, Principal Investigators Dah-Jyuu Wang, Ph.D. and Edward Moss, Ph.D., Investigators Robert A. Zimmerman, M.D., and Research Staff Brooke Bintliff, B.S., Ruth Bradford, Janice Newman, M.B.A. The Principal Investigator of the data coordinating center at McGill University is Alan C. Evans, Ph.D., Investigators Rozalia Arnaoutelis, B.S., G. Bruce Pike, Ph.D., D. Louis Collins, Ph.D., Gabriel Leonard, Ph.D., Tomas Paus, M.D., Alex Zijdenbos, Ph.D., and Research Staff Samir Das, B.S., Vladimir Fonov, Ph.D., Luke Fu, B.S., Jonathan Harlap, Ilana Leppert, B.E., Denise Milovan, M.A., Dario Vins, B.C.,, and at Georgetown University, Thomas Zeffiro, M.D., Ph.D. and John Van Meter, Ph.D. Ph.D. Investigators at the Neurostatistics Laboratory, Harvard University/McLean Hospital, Nicholas Lange, Sc.D., and Michael P. Froimowitz, M.S., work with data coordinating center staff and all other team members on biostatistical study design and data analyses. The Principal Investigator of the Clinical Coordinating Center at Washington University is Kelly Botteron, M.D., Investigators C. Robert Almli Ph.D., Cheryl Rainey, B.S., Stan Henderson M.S., Tomoyuki Nishino, M.S., William Warren, Jennifer L. Edwards M.SW., Diane Dubois R.N., Karla Smith, Tish Singer and Aaron A. Wilber, M.S. The Principal Investigator of the Diffusion Tensor Processing Center at the National Institutes of Health is Carlo Pierpaoli, MD, Ph.D., Investigators Peter J. Basser, Ph.D., Lin-Ching Chang, Sc.D., Chen Guan Koay, Ph.D. and Lindsay Walker, M.S. The Principal Collaborators at the National Institutes of Health are Lisa Freund, Ph.D. (NICHD), Judith Rumsey, Ph.D. (NIMH), Lauren Baskir, Ph.D. (NIMH), Laurence Stanford, PhD. (NIDA), Karen Sirocco, Ph.D. (NIDA) and from NINDS, Katrina Gwinn-Hardy, M.D., and Giovanna Spinella, M.D. The Principal Investigator of the Spectroscopy Processing Center at the University of California Los Angeles is James T. McCracken, M.D., Investigators Jeffry R. Alger, Ph.D., Jennifer Levitt, M.D., Joseph O'Neill, Ph.D.
Footnotes
Publisher's Disclaimer: This is a PDF file of an unedited manuscript that has been accepted for publication. As a service to our customers we are providing this early version of the manuscript. The manuscript will undergo copyediting, typesetting, and review of the resulting proof before it is published in its final citable form. Please note that during the production process errors may be discovered which could affect the content, and all legal disclaimers that apply to the journal pertain.
pBV is the sum of White Matter, Intracerebral Cerebrospinal Fluid (CSF) and Subcortical Gray Matter (i.e. it excludes cortical gray matter from the calculation of brain volume). See Appendix A for rationale.
pBV stands for 'proxy measure of Brain Volume' and is calculated as White Matter + Intracerebral Cerebrospinal Fluid + Subcortical Gray matter. TBV stands for Total Brain Volume and is calculated as White Matter + Intracerebral Cerebrospinal Fluid + Subcortical Gray Matter + Cortical Gray Matter.
Whether this is due to a single global effect (e.g. a global effect responsible for cortical thickness across the brain) and/or to the sum of multiple local effects is unknown.
Disclaimer
The views herein do not necessarily represent the official views of the National Institute of Child Health and Human Development, the National Institute on Drug Abuse, the National Institute of Mental Health, the National Institute of Neurological Disorders and Stroke, the National Institutes of Health, the U.S. Department of Health and Human Services, or any other agency of the United States Government.
REFERENCES
- Ad-Dab'bagh Y, Lyttelton O, Muehlboeck J-S, Lepage C, Einarson D, Mok K, Ivanov O, Vincent RD, Lerch J, Fombonne E, Evans AC. The CIVET Image-Processing Environment: A Fully Automated Comprehensive Pipeline for Anatomical Neuroimaging Research. In: Corbetta M, editor. Proceedings of the 12th Annual Meeting of the Organization for Human Brain Mapping; Florence, Italy. 2006. p. S45. [Google Scholar]
- Andreasen NC, Flaum M, Swayze V, 2nd, O'Leary DS, Alliger R, Cohen G, Ehrhardt J, Yuh WT. Intelligence and brain structure in normal individuals. Am J Psychiatry. 1993;150:130–134. doi: 10.1176/ajp.150.1.130. [DOI] [PubMed] [Google Scholar]
- Benjamini Y, Hochberg Y. Controlling the False Discovery Rate: A Practical and Powerful Approach to Multiple Testing. Journal of the Royal Statistical Society, Series B (Methodological) 1995;57:289–300. [Google Scholar]
- Bollen KA. Structure Equations with Latent Variables. New York: John Wiley & Sons; 1989. [Google Scholar]
- Boyke J, Driemeyer J, Gaser C, Buchel C, May A. Training-induced brain structure changes in the elderly. J Neurosci. 2008;28:7031–7035. doi: 10.1523/JNEUROSCI.0742-08.2008. [DOI] [PMC free article] [PubMed] [Google Scholar]
- Carpenter PA, Just MA, Shell P. What one intelligence test measures: a theoretical account of the processing in the Raven Progressive Matrices Test. Psychological Review. 1990;97:404–431. [PubMed] [Google Scholar]
- Carroll JB. Human Cognitive Abilities: A survey of factor-analytic studies. Cambridge University Press; 1993. [Google Scholar]
- Colom R, Haier RJ, Head K, Alvarez-Linera J, Quiroga MA, Shih PC, Jung RE. Gray matter correlates of fluid, crystallized, and spatial intelligence: Testing the P-FIT model. Intelligence. 2009;37:124–135. [Google Scholar]
- Colom R, Jung RE, Haier RJ. General intelligence and memory span: evidence for a common neuroanatomic framework. Cogn Neuropsychol. 2007;24:867–878. doi: 10.1080/02643290701781557. [DOI] [PubMed] [Google Scholar]
- Deary IJ, Penke L, Johnson W. The neuroscience of human intelligence differences. Nat Rev Neurosci. 2010;11:201–211. doi: 10.1038/nrn2793. [DOI] [PubMed] [Google Scholar]
- Draganski B, Gaser C, Busch V, Schuierer G, Bogdahn U, May A. Neuroplasticity: changes in grey matter induced by training. Nature. 2004;427:311–312. doi: 10.1038/427311a. [DOI] [PubMed] [Google Scholar]
- Driemeyer J, Boyke J, Gaser C, Buchel C, May A. Changes in gray matter induced by learning--revisited. PLoS One. 2008;3:e2669. doi: 10.1371/journal.pone.0002669. [DOI] [PMC free article] [PubMed] [Google Scholar]
- Engvig A, Fjell AM, Westlye LT, Moberget T, Sundseth Ø, Larsen VA, Walhovd KB. Effects of memory training on cortical thickness in the elderly. Neuroimage. 2010;52:1667–1676. doi: 10.1016/j.neuroimage.2010.05.041. [DOI] [PubMed] [Google Scholar]
- Evans AC Brain Development Cooperative Group. The NIH MRI study of normal brain development. Neuroimage. 2006;30:184–202. doi: 10.1016/j.neuroimage.2005.09.068. [DOI] [PubMed] [Google Scholar]
- Flashman LA, Andreasen NC, Flaum M, Swayze VW., 2nd Intelligence and Regional Brain Volumes in Normal Controls. Intelligence. 1997;25:149–160. [Google Scholar]
- Genovese CR, Lazar NA, Nichols T. Thresholding of statistical maps in functional neuroimaging using the false discovery rate. Neuroimage. 2002;15:870–878. doi: 10.1006/nimg.2001.1037. [DOI] [PubMed] [Google Scholar]
- Glascher J, Rudrauf D, Colom R, Paul LK, Tranel D, Damasio H, Adolphs R. Distributed neural system for general intelligence revealed by lesion mapping. Proc Natl Acad Sci U S A. 2010;107:4705–4709. doi: 10.1073/pnas.0910397107. [DOI] [PMC free article] [PubMed] [Google Scholar]
- Gottfredson LS. Mainstream science on intelligence: an editorial with 52 signatories, history, and bibliography. Intelligence. 1997;24:13–23. [Google Scholar]
- Gray JR, Thompson PM. Neurobiology of Intelligence: Science and Ethics. Nat Rev Neurosc. 2004;5:471–482. doi: 10.1038/nrn1405. [DOI] [PubMed] [Google Scholar]
- Haier RJ, Alkire MT, White NS, Uncapher MR, Head E, Lott IT, Cotman CW. Temporal cortex hypermetabolism in Down syndrome prior to the onset of dementia. Neurology. 2003;61:1673–1679. doi: 10.1212/01.wnl.0000098935.36984.25. [DOI] [PubMed] [Google Scholar]
- Haier RJ, Colom R, Schroeder DH, Condon CA, Tang C, Eaves E, Head K. Gray matter and intelligence factors: Is there a neuro-g? Intelligence. 2009a;37:136–144. [Google Scholar]
- Haier RJ, Karama S, Leyba L, Jung RE. MRI assessment of cortical thickness and functional activity changes in adolescent girls following three months of practice on a visual-spatial task. BMC Res Notes. 2009b;2:174. doi: 10.1186/1756-0500-2-174. [DOI] [PMC free article] [PubMed] [Google Scholar]
- Haier RJ, Schroeder DH, Tang C, Head K, Colom R. Gray matter correlates of cognitive ability tests used for vocational guidance. BMC Res Notes. 2010;3:206. doi: 10.1186/1756-0500-3-206. [DOI] [PMC free article] [PubMed] [Google Scholar]
- Haier RJ, Siegel BV, Nuechterlein KH, Hazlett E, et al. Cortical glucose metabolic rate correlates of abstract reasoning and attention studied with positron emission tomography. Intelligence. 1988;12:199–217. [Google Scholar]
- Haier RJ, Siegel BV, Tang C, Abel L, et al. Intelligence and changes in regional cerebral glucose metabolic rate following learning. Intelligence. 1992;16:415–426. [Google Scholar]
- He Y, Chen ZJ, Evans AC. Small-world anatomical networks in the human brain revealed by cortical thickness from MRI. Cereb Cortex. 2007;17:2407–2419. doi: 10.1093/cercor/bhl149. [DOI] [PubMed] [Google Scholar]
- Isganaitis E, Jimenez-Chillaron J, Woo M, Chow A, DeCoste J, Vokes M, Liu M, Kasif S, Zavacki AM, Leshan RL, Myers MG, Patti ME. Accelerated postnatal growth increases lipogenic gene expression and adipocyte size in low-birth weight mice. Diabetes. 2009;58:1192–1200. doi: 10.2337/db08-1266. [DOI] [PMC free article] [PubMed] [Google Scholar]
- Jensen AR. The g Factor: The Science of Mental Ability. Praeger, Westport, Connecticut: 1998. [Google Scholar]
- Jensen AR, Weng L-J. What Is a Good g? Intelligence. 1994;18:231–258. [Google Scholar]
- Johnson W, Bouchard TJ, Jr, Krueger RF, McGue M, Gottesman II. Just one g: Consistent results from three test batteries. Intelligence. 2004;32:95–107. [Google Scholar]
- Johnson W, Nijenhuis JT, Bouchard TJ., Jr Still just 1 g: Consistent results from five test batteries. Intelligence. 2008;36:81–95. [Google Scholar]
- Jung RE, Haier RJ. The Parieto-Frontal Integration Theory (P-FIT) of intelligence: Converging neuroimaging evidence. Behav Brain Sci. 2007;30:135–154. doi: 10.1017/S0140525X07001185. [DOI] [PubMed] [Google Scholar]
- Jung RE, Haier RJ, Yeo RA, Rowland LM, Petropoulos H, Levine AS, Sibbitt WL, Brooks WM. Sex differences in N-acetylaspartate correlates of general intelligence: an 1H-MRS study of normal human brain. Neuroimage. 2005;26:965–972. doi: 10.1016/j.neuroimage.2005.02.039. [DOI] [PubMed] [Google Scholar]
- Karama S, Ad-Dab'bagh Y, Haier RJ, Deary IJ, Lyttelton OC, Lepage C, Evans AC. Positive association between cognitive ability and cortical thickness in a representative US sample of healthy 6 to 18 year-olds. Intelligence. 2009;37:145–155. doi: 10.1016/j.intell.2008.09.006. [DOI] [PMC free article] [PubMed] [Google Scholar]
- Kim JS, Singh V, Lee JK, Lerch J, Ad-Dab'bagh Y, MacDonald D, Lee JM, Kim SI, Evans AC. Automated 3-D extraction and evaluation of the inner and outer cortical surfaces using a Laplacian map and partial volume effect classification. Neuroimage. 2005;27:210–221. doi: 10.1016/j.neuroimage.2005.03.036. [DOI] [PubMed] [Google Scholar]
- Lerch JP, Evans AC. Cortical thickness analysis examined through power analysis and a population simulation. Neuroimage. 2005;24:163–173. doi: 10.1016/j.neuroimage.2004.07.045. [DOI] [PubMed] [Google Scholar]
- Li Y, Liu Y, Li J, Qin W, Li K, Yu C, Jiang T. Brain anatomical network and intelligence. PLoS Comput Biol. 2009;5:e1000395. doi: 10.1371/journal.pcbi.1000395. [DOI] [PMC free article] [PubMed] [Google Scholar]
- Luders E, Narr KL, Bilder RM, Thompson PM, Szeszko PR, Hamilton L, Toga AW. Positive correlations between corpus callosum thickness and intelligence. Neuroimage. 2007;37:1457–1464. doi: 10.1016/j.neuroimage.2007.06.028. [DOI] [PMC free article] [PubMed] [Google Scholar]
- Luders E, Narr KL, Thompson PM, Toga AW. Neuroanatomical correlates of intelligence. Intelligence. 2009;37:156–163. doi: 10.1016/j.intell.2008.07.002. [DOI] [PMC free article] [PubMed] [Google Scholar]
- Luders E, Thompson PM, Narr KL, Zamanyan A, Chou YY, Gutman B, Dinov ID, Toga AW. The link between callosal thickness and intelligence in healthy children and adolescents. Neuroimage. 2010 doi: 10.1016/j.neuroimage.2010.09.083. doi:10.1016/j.neuroimage.2010.09.083. [DOI] [PMC free article] [PubMed] [Google Scholar]
- Lyttelton O, Boucher M, Robbins S, Evans A. An unbiased iterative group registration template for cortical surface analysis. Neuroimage. 2007;34:1535–1544. doi: 10.1016/j.neuroimage.2006.10.041. [DOI] [PubMed] [Google Scholar]
- MacDonald D, Kabani N, Avis D, Evans AC. Automated 3-D extraction of inner and outer surfaces of cerebral cortex from MRI. Neuroimage. 2000;12:340–356. doi: 10.1006/nimg.1999.0534. [DOI] [PubMed] [Google Scholar]
- Narr KL, Bilder RM, Luders E, Thompson PM, Woods RP, Robinson D, Szeszko PR, Dimtcheva T, Gurbani M, Toga AW. Asymmetries of cortical shape: Effects of handedness, sex and schizophrenia. Neuroimage. 2007;34:939–948. doi: 10.1016/j.neuroimage.2006.08.052. [DOI] [PMC free article] [PubMed] [Google Scholar]
- Neisser U, Boodoo G, Bouchard TJ, Jr, Boykin W, Brody N, Ceci SJ, Halpern DF, Loehlin JC, Perloff R, Sternberg RJ. Intelligence: Knowns and Unknowns. American Psychologist. 1996;51:77–101. [Google Scholar]
- Oldfield RC. The assessment and analysis of handedness: the Edinburgh inventory. Neuropsychologia. 1971;9:97–113. doi: 10.1016/0028-3932(71)90067-4. [DOI] [PubMed] [Google Scholar]
- Schmithorst VJ, Wilke M, Dardzinski BJ, Holland SK. Cognitive functions correlate with white matter architecture in a normal pediatric population: a diffusion tensor MRI study. Hum Brain Mapp. 2005;26:139–147. doi: 10.1002/hbm.20149. [DOI] [PMC free article] [PubMed] [Google Scholar]
- Schumacker RE, Lomax RG. A beginner's Guide to Structural Equation Modelling. Mahwah, NJ: Lawrence Erlbaum Associates; 1996. [Google Scholar]
- Shaw P, Greenstein D, Lerch J, Clasen L, Lenroot RK, Gogtay N, Evans A, Rapoport J, Giedd J. Intellectual ability and cortical development in children and adolescents. Nature. 2006;440:676–679. doi: 10.1038/nature04513. [DOI] [PubMed] [Google Scholar]
- Song M, Zhou Y, Li J, Liu Y, Tian L, Yu C, Jiang T. Brain spontaneous functional connectivity and intelligence. Neuroimage. 2008;41:1168–1176. doi: 10.1016/j.neuroimage.2008.02.036. [DOI] [PubMed] [Google Scholar]
- van den Heuvel MP, Stam CJ, Kahn RS, Hulshoff Pol HE. Efficiency of functional brain networks and intellectual performance. J Neurosci. 2009;29:7619–7624. doi: 10.1523/JNEUROSCI.1443-09.2009. [DOI] [PMC free article] [PubMed] [Google Scholar]
- Vellutino FR, Scanlon DM, Lyon GR. Differentiating Between Difficult-to-Remediate and Readily Remediated Poor Readers. Journal of Learning Disabilities. 2000;33:223–238. doi: 10.1177/002221940003300302. [DOI] [PubMed] [Google Scholar]
- Waber D, De Moor C, Forbes P, Almli C, Botteron K, Leonard G, Milovan D, Paus T, Rumsey J, Group BDC. The NIH MRI study of normal brain development: Performance of a population based sample of healthy children aged 6 to 18 years on a neuropsychological battery. Journal of the International Neuropsychological Society. 2007;13:729–746. doi: 10.1017/S1355617707070841. [DOI] [PubMed] [Google Scholar]
- Wang X, Chorley BN, Pittman GS, Kleeberger SR, Brothers J, 2nd, Liu G, Spira A, Bell DA. Genetic variation and antioxidant response gene expression in the bronchial airway epithelium of smokers at risk for lung cancer. PLoS One. 2010;5:e11934. doi: 10.1371/journal.pone.0011934. [DOI] [PMC free article] [PubMed] [Google Scholar]
- Wechsler D. Wechsler Abbreviated Scale of Intelligence. San Antonio: Harcourt Brace and Compagny; 1999. [Google Scholar]
- Weschler D. Weschler Adult Intelligence Scale-III: Manual. San Antonio: 1997. [Google Scholar]
- Witelson SF, Beresh H, Kigar DL. Intelligence and brain size in 100 postmortem brains: sex, lateralization and age factors. Brain. 2006;129:386–398. doi: 10.1093/brain/awh696. [DOI] [PubMed] [Google Scholar]
- Woodcock RW, McGrew KS, Mather N. Woodcock-Johnson III Tests of Achievement. Itasca, Illinois: Riverside Publishing; 2001. [Google Scholar]
- Worsley KJ, Taylor JE, Tomaiuolo F, Lerch J. Unified univariate and multivariate random field theory. Neuroimage. 2004;23 Suppl 1:S189–S195. doi: 10.1016/j.neuroimage.2004.07.026. [DOI] [PubMed] [Google Scholar]
- Zhang K, Cui S, Chang S, Zhang L, Wang J. i-GSEA4GWAS: a web server for identification of pathways/gene sets associated with traits by applying an improved gene set enrichment analysis to genome-wide association study. Nucleic Acids Res. 2010;38 Suppl:W90–W95. doi: 10.1093/nar/gkq324. [DOI] [PMC free article] [PubMed] [Google Scholar]
Associated Data
This section collects any data citations, data availability statements, or supplementary materials included in this article.