Abstract
Multi-echo chemical shift based water-fat separation methods are seeing increasing clinical use due to their ability to estimate and correct for field inhomogeneities. Previous chemical-shift based water-fat separation methods have used a relatively simple signal model that assumes both water and fat have a single resonant frequency. However, it is well known that fat has several spectral peaks. This inaccuracy in the signal model results in two undesired effects. First, water and fat are incompletely separated. Second, methods designed to estimate T2* in the presence of fat incorrectly estimate the T2* decay in tissues containing fat. In this work, a more accurate multi-frequency model of fat is included in the IDEAL water-fat separation and simultaneous T2* estimation techniques. The fat spectrum can be assumed to be constant in all subjects and measured a priori using MR spectroscopy. Alternatively, the fat spectrum can be estimated directly from the data using novel spectrum self-calibration algorithms. The improvement in water-fat separation and T2* estimation is demonstrated in a variety of in-vivo applications, including knee, ankle, spine, breast and abdominal scans.
Keywords: water fat separation, R2* measurement, T2* measurement, fat spectrum, fat quantification, fat spectral peak
Introduction
Multi-echo chemical shift based water-fat separation methods have seen a recent increase in clinical use (1–6), particularly in challenging applications where inhomogeneous magnetic fields cause failure of conventional fat saturation methods. Dixon first used in-phase (IP) and out-of-phase (OP) images to analytically calculate the water and fat images, so called the 2-pt Dixon method (1). Glover et al then extended the idea to collect 3 echoes such that the water-fat separation can be performed with the correction for Bo field inhomogeneity (2,3). In the last decade, numerous variations have been proposed based on the 2-pt and 3-pt Dixon methods. These previous methods have assumed a relatively simple signal representation that models both water and fat as a single resonant frequency. For most applications this is a satisfactory model and excellent qualitative water-fat separation can be achieved.
Although water is well modeled by a single frequency, this is not true for fat. In general it is assumed that fat resonates at a single frequency ~3.5ppm downfield from water (approximately 210Hz at 1.5T, 420Hz at 3T). However it is well known that fat has a number of spectral peaks (7–17). In particular, the spectral peak from olefinic proton (5.3ppm) is close to the water resonant frequency, which will manifest as a baseline level of signal within adipose tissue on the separated water images (2,14,16). This effect is also commonly seen on images acquired with either conventional fat saturation (18) or spatial-spectral excitation (19). In general, this small signal within the fatty tissues is clinically acceptable for most qualitative applications. However, the incomplete suppression of fat in the water image may reduce the desired contrast between the water tissue and the surrounding fatty tissues. In addition, there has been growing interest in the use of chemical shift based methods for quantification of fatty infiltration of organs such as the liver (hepatic steatosis) (20) and vertebral bodies (16,21). In these situations the multiple spectral peaks of fat must be considered. While the impact of the fat spectral peaks on 2-pt or 3-pt water-fat separation has been recognized and discussed in the past (2,14), the modification of the algorithm to include the fat spectral peaks has not been demonstrated. In this work, we describe an improved method for 3-pt water-fat separation by modeling a more accurate fat spectrum that consists of multiple spectral peaks. We have combined this model with the Iterative Decomposition of water and fat with Echo Asymmetry and Least-squares estimation (IDEAL) (6,22) algorithm. The modified IDEAL processing that includes multipeak fat modeling is referred to as Multipeak IDEAL (MP-IDEAL) in this work. With MP-IDEAL we demonstrate that greatly improved fat suppression can be achieved with improved contrast between non-fatty tissues and the adjacent adipose tissue.
The T2* decay has been typically neglected in conventional 2-pt or 3-pt water-fat separation methods as T2* is much longer than the echo times in most applications. However, for quantitative applications or imaging with substantially shortened T2*, it is important to consider the effects from both fat and T2*, as they may interfere with the estimation of each other. Therefore a method to simultaneously estimate fat and T2* can be useful. Glover (2) and Ma et al (23) showed that T2* can be estimated from the signals with echo shifts of 0 and 2π in multipoint FSE acquisitions. However, these techniques require a specific sampling pattern and use only part of the collected signals for T2* estimation, therefore they are not SNR optimal. More recent approaches use multi-echo gradient echo sequences and perform nonlinear curve fitting to an assumed signal model (17,24–26). We have shown that the IDEAL method can be modified to estimate a common T2* of water and fat in addition to water and fat separation, using an algorithm called T2*-IDEAL (24,26). Bydder et al proposed a comprehensive signal model with different T2* for water and fat, which is solved by a sophisticated nonlinear curve fitting algorithm and carefully chosen fitting parameters (17,25). These gradient-echo based techniques permit flexible and rapid acquisitions, and have great potential as biomarkers of chronic liver diseases where fatty infiltration and iron overload may coexist (27–30). However, as pointed out by multiple studies (2,10–12,15,17,31), the presence of fat spectral peaks can effectively increase the line-width of the main fat peak, causing an apparent shortened T2* decay. To correct for this error, Wehrli et al acquired reference fat signals in subcutaneous fat tissues (15). Bydder et al employed a spectroscopy-measured fat spectrum in the signal model (10). In another study from the same group, it is tentatively estimated that the fat spectral peaks cause an apparent R2* increase of 1/12ms, which is then included in the model as the R2* difference of water and fat (17). In this work, we will study the impact of the fat spectral peaks on the T2*-IDEAL technique. We will show that the presence of the fat spectral peaks will result in an overestimated T2* decay within tissues containing fat for a 6-pt T2*-IDEAL acquisition. Like the MP-IDEAL method, the T2*-IDEAL algorithm is modified to model a more accurate fat spectrum. In addition to utilize a pre-determined fat spectrum model, we also propose a novel method to estimate the relative amplitudes of fat spectral peaks from the 6-pt data directly. We show that this enhancement results in substantially improved T2* estimation with no additional echoes needed.
Theory
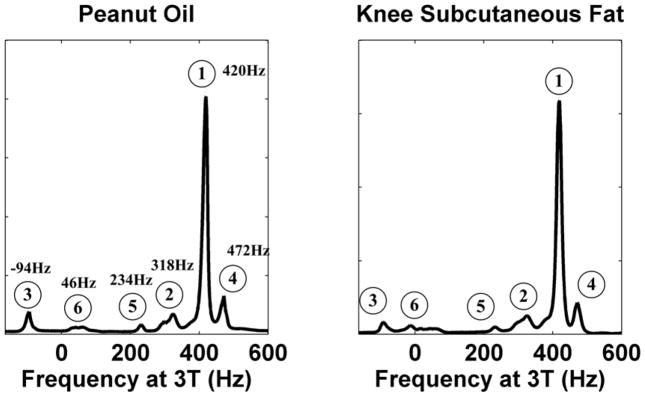
Figure 1 shows two representative fat spectra acquired in a phantom containing peanut oil and subcutaneous fat of a knee, both at 3 Tesla, showing very similar appearances. At least six discrete peaks are identified, whose chemical shift frequencies (at 3T) relative to the water resonant frequency are labeled. Although the majority of the signal lies in the main peak (peak 1, CH2) at 420Hz, there is a substantial amount of signal contained within the other peaks. Therefore, a signal model that assumes fat resonates at a single frequency is inaccurate.
Figure 1.
Two representative spectra collected in peanut oil and knee subcutaneous fat at 3T. The spectra were shifted and displayed such that the main fat peak is at 420Hz relative to water. Both fat spectra show a very similar multipeak pattern. Six peaks can be identified, whose chemical shift frequencies relative to the water resonant frequency at 3T are labeled. Peak 6 is at slightly different locations in the two spectra.
MP-IDEAL Signal Model and Reconstruction
From spectra such as those seen in Figure 1, we can measure the relative chemical shift of the different peaks. In addition, if the relative signal contributions from each peak (relative amplitudes) are measured, we can also use this information to improve the accuracy of the signal model, without increasing the number of unknowns in our reconstruction. We can write the signal from a voxel containing a mixture of water and fat as:
| [1] |
where fp is the resonant frequency of the pth fat peak (p=1, …, P) relative to water, and αp is the relative amplitude of the pth peak, such that . For a group of N echoes measured at specific echo times, tn (n=1, …, N), we can write Eq.1 in a matrix format,
| [2] |
where
and diagonal matrix
Compared to the signal model used in conventional IDEAL (22), the second column of the A matrix is changed from a single exponential term (ej2πf1tn) to a weighted sum of exponentials ( ). Therefore, ρ can be estimated by following the IDEAL algorithm (22). First, the field map (ψ) is estimated using a modified version of the iterative field map estimation method (22), where ej2πf1tn is replaced by . The phase shifts introduced from the field map (D(ψ) matrix) are then demodulated, and final estimates of water and fat are obtained by performing the Penrose-Moore pseudo-inverse (22), ie:
| [3] |
where the superscript “H” is the complex Hermitian transpose operator, and we have used the property of diagonal matrices and complex exponentials, ie: D−1(ψ) = D(−ψ).
T2*-IDEAL and R2* Over-Estimation in Fatty Tissue
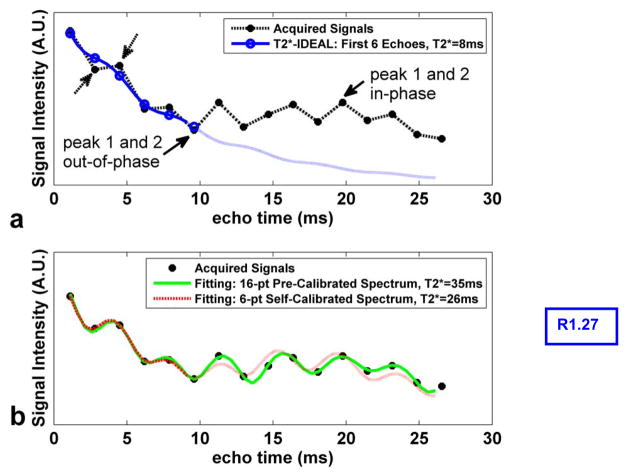
Various methods have been proposed to achieve T2* estimation in the presence of fat (2,17,23,25,26,32), where nonlinear curve-fitting algorithms are often involved (17,25,26,32). In the T2*-IDEAL algorithm, both the B0 field inhomogeneity and the T2* decay are modeled in a “complex fieldmap” term, ψ̂ = ψ + j R2 */2π, enabling modification of the IDEAL algorithm (22) to estimate R2* in addition to water and fat (26). We have used a six-echo acquisition strategy to achieve a clinically acceptable scan time (20~30 second breath-hold) (26), with an echo train typically extending to approximately 10ms at 1.5T. However, as reported by other studies (2,10,11,15,17,31) and also illustrated in Figure 2a, the fat spectral peaks can have confounding effects on the estimation of R2* within fatty tissues. The signal curve of 16 echoes acquired in an oil phantom (dotted black line) does not follow a simple exponential decay. The high frequency oscillatory pattern of the curve (dashed arrows) comes from the presence of peak 3 in Figure 1. More importantly, the signal curve is modulated by a low frequency oscillation, featured by a low point at the sixth echo near 10ms. This effect arises from the signal at the peak 2, which completes a π phase shift from in-phase to out-of-phase with respect to the main peak near 10ms. As a result, if only the first six echoes are used for R2* estimation, the effect from the peak 2 can simulate a fast T2* decay, resulting in an over-estimated R2* (T2*=8ms, the solid blue curve). This shortened T2* in fat can be approximated as a consequence of effective spectral broadening caused by the fat spectral peaks (17). The effect will be clinically relevant when assessing liver iron level in fatty liver patients.
Figure 2.
Illustration of the confounding effect from the fat spectra peaks when estimating R2* in fatty tissues (a) and the excellent fitting from the multipeak corrected T2*-IDEAL (b). Sixteen echoes were acquired in a peanut oil phantom and the magnitude signals of a representative pixel are shown (dotted black line). When using the conventional T2*-IDEAL on the first six echoes (solid blue curve in a), an over-estimated R2* resulted (T2* = 8ms) primarily due to the signal modulation from fat peak 2 (solid arrows). The high frequency oscillation indicated by the dashed arrows comes from the presence of the fat peak 3. As part of the spectrum pre-calibration procedure, when treating fat peaks as six independent species using 16-echo T2*-IDEAL, the re-synthesized signals fit the acquired signals extremely well (solid green curve in b). The self-calibrated spectrum using the first six echoes (dashed red curve in b) also leads to an excellent fit to the acquired signals, particularly at the first six echoes.
Methods and Materials
Spectrum Pre-Calibration
The MP-IDEAL reconstruction described above assumes that the fat spectrum is known a priori. One option to provide the required information is to assume that the frequencies and amplitudes of the fat peaks can be measured once and considered to be constant for a defined set of conditions (range of body parts, pulse sequence type and parameters). The fat spectrum can be measured by MR spectroscopy. The frequencies of the fat peaks (fp) can be accurately determined from this spectrum. The normalized areas of the peaks represent the relative amplitudes in Eq. 1 (αp), normally measured with spectroscopy analysis softwares (e.g. jMRUI (17)). However, in our studies, it was found that some spectral peaks are close to each other and possess broad line widths, making it difficult to differentiate them.
Given the knowledge of the frequencies of the fat side peaks as determined by spectroscopy, another method to determine the relative amplitudes a priori is to use an over-sampled multi-echo acquisition and the multi-species IDEAL reconstruction. In practice, 16 echoes can be acquired using a multi-echo sequence to collect the echoes as rapidly as possible in a single repetition. It has been demonstrated previously that the IDEAL algorithm can be extended to fit for multiple chemical species (22). By treating each of the fat peaks as an independent chemical species with known frequency locations (fp), a 16-pt IDEAL reconstruction can fit for the 6 fat peaks plus the water peak independently, providing separate images for each fat peak as well as an image of the water peak. An ROI is then drawn in the fat area and the pixel intensities in the ROI are averaged to form the final, calibrated relative amplitude αp at each peak frequency. Figure 2b shows an example of using sixteen echoes to fit for six fat frequencies independently. The re-synthesized signals using the calibrated αp are plotted in solid green, which demonstrates an excellent fit to the acquired data. This spectrum pre-calibration needs to be performed only once and the calibrated spectrum can be used in all MP-IDEAL reconstructions that fit the predefined criteria for that pre-calibration.
Spectrum Self-Calibration for 6-pt T2*-IDEAL acquisitions
As described above, the spectrum pre-calibration approach uses a pre-determined fat spectrum for all scans. The frequency locations of the fat peaks (fp) are well documented in various studies (7,9,10,12,13,33). We found that the frequency locations of peaks 1–4 vary in a 10Hz (at 3T) range measured by spectral data collected in peanut oil, subcutaneous fat and bone marrow. Therefore, they are considered relatively constant between scans in this work. However, the relative amplitudes αp may, in principle, change between different subjects, as suggested by a previous study (17). In addition, the fat peaks may not possess identical relaxation parameters (11,13,15) so αp may appear to vary for sequences with different T1 and T2 weighting. To reduce the reconstruction’s sensitivity to possible fat spectrum variation, we introduce algorithms below to calibrate the relative amplitudes of three primary fat peaks directly from the acquired dataset. This “spectrum self-calibration” is based on the assumption that all fat containing pixels in a dataset can be characterized by the same fat spectrum, i.e. αp and fp are spatially invariant.
We first describe the spectrum self-calibration algorithm for the 6-pt T2*-IDEAL acquisition. Unlike the 16-pt acquisition used in the spectrum pre-calibration approach described above, where there are sufficient measurements to fit for 6 fat frequencies, it is challenging to accurately estimate the relative amplitudes of all frequencies with only 6 samples (6-pt) of data, and further simplification is needed. As can be seen from the spectra shown in Figure 1 and the pre-calibrated spectrum in Table 1, peaks 1–4 have substantially more energy than peaks 5 and 6. Therefore, peaks 5 and 6 are neglected. Additionally, although peak 4 has appreciable signal, it is close to the main peak, therefore its effect is small for the echo train duration (typically 10ms) used in T2*-IDEAL. With these considerations, only peaks 1–3 are included in our 6-pt spectrum self-calibration procedure. If more echoes are collected, more peaks can be included in the self-calibration algorithm. With this simplified 3-frequency spectrum model, the following self-calibration procedure, similar to the spectrum pre-calibration algorithm, is performed, as illustrated in Figure 3.
Table 1.
The values of the pre-calibrated and self-calibrated relative amplitudes for the data shown in Figure 4–9. Chemical shift frequencies of the peaks relative to water are labeled for 3T.
| Data | α1 | α2 | α3 | α4 | α5 | α6 |
|---|---|---|---|---|---|---|
| 420Hz | 318Hz | −94Hz | 472Hz | 234Hz | 46Hz | |
| pre-calibration, 16-echo IDEAL, peanut oil | 0.62 | 0.15 | 0.10 | 0.06 | 0.03 | 0.04 |
| Fig. 4, 3-pt 1.5T FSE peanut oil, self calibration | 0.71 | 0.21e(−j0.4π) | 0.09 | 0 | 0 | 0 |
| Fig. 5, 3-pt, 3T FSE Knee, self calibration | 0.78 | 0.15e(−j0.4π) | 0.08 | 0 | 0 | 0 |
| Fig. 6, 3-pt, 3T FSE Ankle, self calibration | 0.74 | 0.16e(−j0.5π) | 0.10e(j0.1π) | 0 | 0 | 0 |
| Fig. 6, 3-pt 1.5T FSE Spine, self calibration | 0.74 | 0.18e(−j0.4π) | 0.08 | 0 | 0 | 0 |
| Fig. 7, 3-pt, 1.5T SPGR Ankle, center echo: 5π/2, self calibration | 0.68 | 0.23e(−j0.1π) | 0.08e(j0.3π) | 0 | 0 | 0 |
| Fig. 7, 3-pt, 1.5T SPGR Breast, center echo: 3π/2, self calibration | 0.85 | 0.08e(j0.9π) | 0.08e(j0.2π) | 0 | 0 | 0 |
| Fig. 8, 6-pt, 1.5T liver, self calibration | 0.75 | 0.17 | 0.08 | 0 | 0 | 0 |
| Fig. 9, 6-pt, 1.5T liver, patient 1, self calibration | 0.72 | 0.20 | 0.08 | 0 | 0 | 0 |
| Fig. 9, 6-pt, 1.5T liver, patient 2, self calibration | 0.76 | 0.16 | 0.08 | 0 | 0 | 0 |
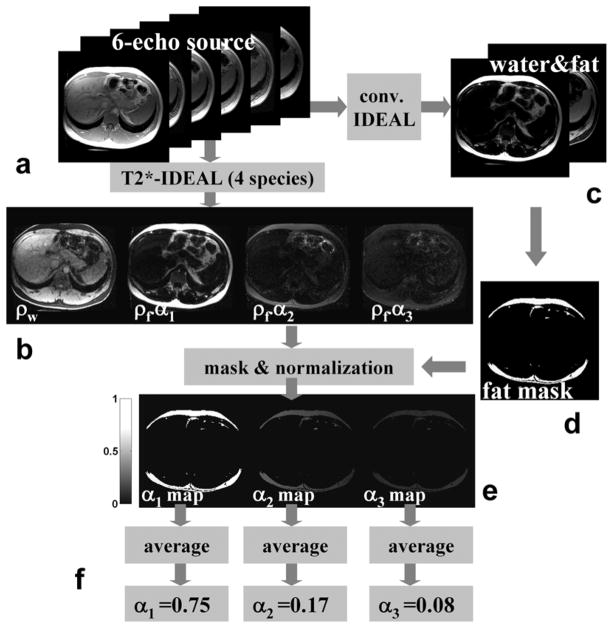
Figure 3.
Illustration of the 6-pt spectrum self-calibration algorithm. By considering three primary fat peaks and the water content as four independent species, a 6-echo T2*-IDEAL reconstruction leads to a water image (ρw) as well as images of the 3 fat peaks (ρf·α1, ρf·α2, ρf·α3,) corrected from the T2* and B0 field inhomogeneity effects (b). The water and fat images (c) from a conventional IDEAL reconstruction can be used to create a fat mask (d) to select only fat-rich pixels for spectrum calibration. Normalization utilizing Σαp=1 at each pixel leads to three αp maps (e). αp values in each map are averaged over all pixels in the fat mask to form the final estimates of αp.
By treating the water (ρw) and 3 fat peaks (ρf·α1, ρf·α2, ρf·α3,) as 4 independent species at each pixel, a 6-pt T2*-IDEAL reconstruction is performed, leading to images of the 4 “species” (Fig. 3b).
Meanwhile, a conventional IDEAL reconstruction is performed. By comparing the signal intensity on the resulting water and fat images (Fig. 3c), a fat mask is automatically created to select only fat-rich pixels for spectrum calibration (Fig. 3d). A threshold-based algorithm to create such a mask is described in the next section for 3-pt self-calibration. However, for 6-pt spectrum self-calibration, the choice of the threshold is flexible as the algorithm does not require the pixels in the mask to be fat-only.
The signal intensities at the 3 fat peaks are normalized at each pixel such that , leading to three αp maps (Fig. 3e).
αp values in each map are averaged over all pixels in the fat mask to form the final estimates of αp (Fig. 3f).
Spectrum Self-Calibration for 3-pt IDEAL
The spectrum self-calibration algorithm for 6-pt acquisitions cannot be directly applied in a 3-pt IDEAL reconstruction as there are fewer measurements. The 3-pt self-calibration algorithm is performed as follows:
Like Fig. 3c, we first perform a conventional IDEAL reconstruction (6,22,34) on the same data. A water image, a fat image and a field map ψ̂ are obtained.
-
By comparing the fat and water images, a number of pure fat pixels can be found. The water content is neglected in these pixels. The identification of fat pixels can be achieved in several ways. For example, the maximum intensity in the fat image is determined. The fat intensity of all pixels is then compared with this maximum fat intensity. Those pixels whose intensity is larger than a fraction of (for example, 70%) the maximum fat intensity are included in the spectrum self-calibration. For fat pixels whose signal exceeds the intensity threshold, Eq.1 can be simplified to exclude the water signal, i.e.:
[4] A matrix representation of Eq.4 is:[5] where F is a matrix described by the fat peak frequencies and echo times:Note that with the matrix F, the matrix A in Eq.2 can be described as: A = [1| F · α] where 1 is a Nx1 vector with 1 as the value of all elements, denoting the contribution from water, and F · α describes the fat signal formation at the echo times given a multipeak fat spectrum.
At these fat pixels, we demodulate the signals with the field map ψ̂ obtained from conventional IDEAL in the first step. ψ̂ is estimated from a fat model with a single resonant frequency. However, as we show in Appendix A, because the same fat spectrum model is used in both the fat spectrum self-calibration step and the water-fat decomposition step, the impact of the fieldmap error on water-fat decomposition is minimal.
-
Like the 6-pt self-calibration algorithm, the relative amplitudes can be estimated at these fat pixels using linear least squares inverse:
[6] Again, utilizing the fact that , the relative amplitudes are estimated at each pixel, which are averaged to form the final estimated αp for this dataset.
Phantom and In-vivo Experiments
Phantom, volunteer, and patient scans were performed on GE 1.5T TwinSpeed and 3.0T VH/i (HDx, GE Healthcare, Waukesha, WI) MRI systems. Informed consent and permission from our Institutional Review Board (IRB) were obtained for all human scanning. Images were collected using a 2D fast spin-echo (FSE) sequence and a 3D spoiled gradient echo (SPGR) sequence modified for use with the IDEAL method (6,35). The echo times that maximize the SNR performance for conventional 3-pt water-fat separation were used for 3-pt IDEAL scans. (6,35,36). In addition, a multi-echo 3D-SPGR pulse sequence was used to collect 6-pt images for simultaneous separation of water, fat and T2* using the T2*-IDEAL reconstruction (26).
Imaging was performed with a variety of applications to demonstrate the improved water-fat decomposition using MP-IDEAL, including knee, ankle, breast, spine, brachial plexus, pelvis and abdominal scans. For each dataset, three online reconstructions were performed using the same source data: conventional IDEAL reconstruction with no multipeak correction, MP-IDEAL using a pre-calibrated spectrum (pre-calibrated MP-IDEAL) and MP-IDEAL using the self-calibrated spectrum (self-calibrated MP-IDEAL). T2*-IDEAL and its multipeak reconstruction was used in the case of 6-pt acquisitions. Images from the three reconstructions were compared and the residual fat signal in the water images was examined as a measure of fat suppression. Contrast-to-Noise ratios (CNRs) were obtained in one knee scan to quantify the contrast improvement. Residue maps were also created to visualize and compare the goodness of fit for different methods. In addition, a region growing algorithm was applied in all reconstructions to avoid water-fat swapping (34).
Results
Representative results from phantom and human scans are shown from Figure 4 to Figure 9. The calibrated relative amplitudes are listed in Table 1. Figure 4 is a 1.5T FSE scan of a water-oil phantom with echo shifts from the spin echo of [−0.4ms, 1.2ms, 2.8ms] (6). The conventional 3-pt IDEAL reconstruction results in “gray fat” in the water image due to the multipeak fat effect, a common appearance shared by many fat suppression methods. The fat-signal fraction image, calculated as fat/(water+fat), suggests an averaged 83.0% fat-signal fraction in the fat area by the conventional IDEAL. A complex sum of water and fat has been used in fat-signal fraction calculations to reduce noise bias (37). In contrast, the MP-IDEAL reconstructions with both the pre-calibrated and self-calibrated spectra resulted in dark fat in the water images. Fat-signal fractions measured by the pre-calibrated and self-calibrated MP-IDEAL methods are 98.6% and 99.97% in fat area respectively. The residue images also demonstrate considerably improved agreement between the acquired signals and the self-calibrated MP-IDEAL signal model.
Figure 4.
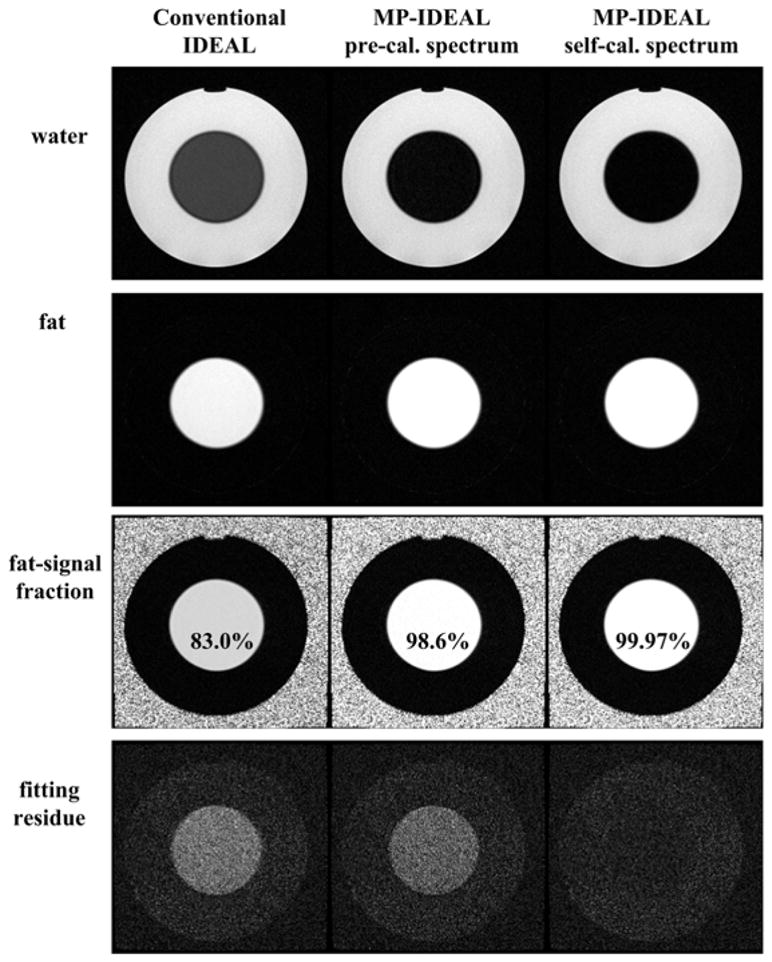
Results from a 1.5T FSE acquisition with a water-oil phantom. The 3-pt data were reconstructed with conventional IDEAL (first column), pre-calibrated MP-IDEAL (second column) and self-calibrated MP-IDEAL (third column). There is a significant amount of residual fat signal in the conventional IDEAL water image. In contrast, fat appears dark in the MP-IDEAL decomposed water images. The averaged fat-signal fraction measured in the fat area are 83.0%, 98.6% and 99.97% from conventional IDEAL, pre-calibrated MP-IDEAL and self-calibrated MP-IDEAL, respectively. The self-calibrated MP-IDEAL are also associated with a considerably better fit between the model and the acquired signals (4th row).
Figure 9.
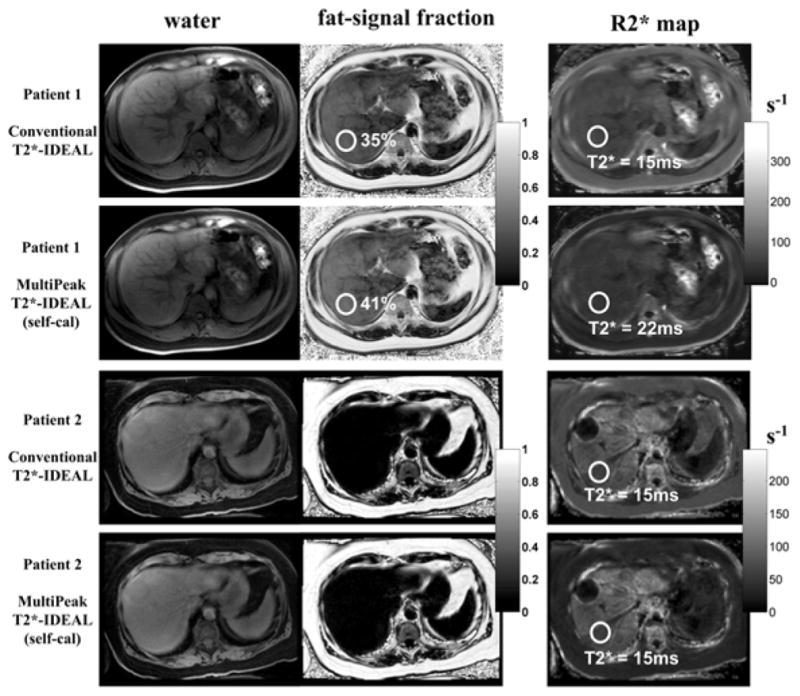
Results from two liver patients acquired with 3D-SPGR 6-pt scans. T2*-IDEAL reconstructions were performed with and without the multipeak correction (spectrum self-calibration). With the conventional T2*-IDEAL reconstruction, the R2* maps of both patients show moderately reduced T2* values (~15ms), suggesting the presence of the mild iron concentrations. However, an increased fat content is evident (30+%) for patient 1, which is not seen for patient 2. With the multipeak T2*-IDEAL, the corrected liver T2* value for patient 1 is normal (~22ms), suggesting that the low T2* value estimated by conventional T2*-IDEAL may be an artifact caused by the presence of fat. The T2* value remains the same for patient 2, whose mild iron overload was confirmed by biopsy. Imaging parameters for patient 1 include: fractional echo, first TE = 0.8ms, echo spacing = 1.7ms, last echo = 9.3ms, TR = 12.1ms, 24 locations, BW = ±100kHz, FOV = 35cm×26cm, slice thickness = 10mm, matrix = 256×160, flip angle = 30 degrees, 8-channel body coil and total imaging time of 25 seconds. Imaging parameters for patient 2 include: first TE = 1.3ms, echo spacing = 2.2ms, last echo = 12.2ms, TR = 14.8ms, 14 locations, BW = ±125kHz, FOV = 35cm×25cm, slice thickness = 10mm, matrix = 256×160, flip angle =5 degrees, 8-channel body coil and total imaging time of 23 seconds.
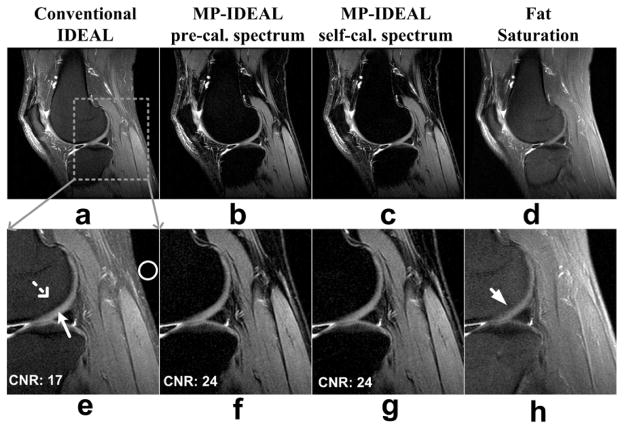
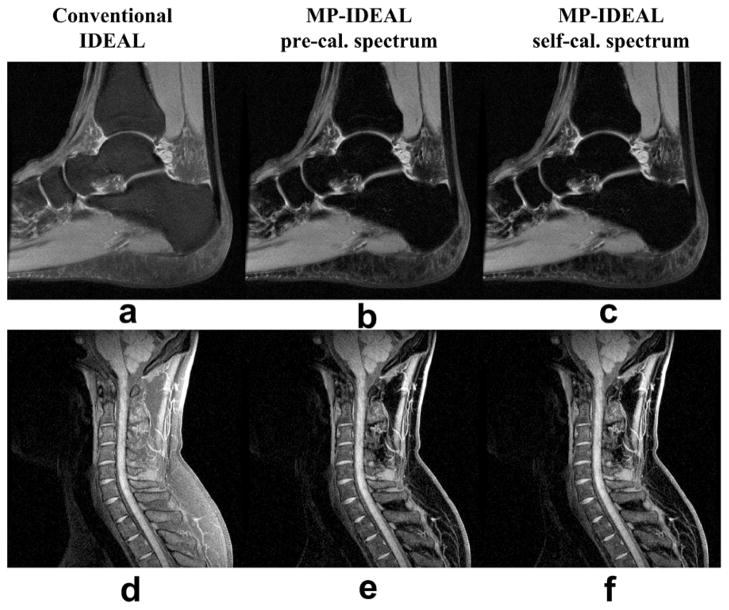
Figures 5 and 6 present results from three FSE scans in knee, ankle and spine with IDEAL optimized echo shifts (6). Superior fat suppression was achieved in the MP-IDEAL water images, typical for all FSE scans. The fat suppression quality from pre-calibrated MP-IDEAL and self-calibrated MP-IDEAL are very similar. The fat saturation image in the knee scan (Fig. 5d and h) also suffered from the same “gray fat” effect due to the presence of the olefinic proton (peak 3), in addition to the fat suppression failure from the B0 field inhomogeneity, resulting in poor contrast of the cartilage (arrow in Fig. 5h). The CNR between the knee cartilage and the nearby bone is measured to be 17, 24 and 24 for the conventional IDEAL, pre-calibrated MP-IDEAL, and self-calibrated MP-IDEAL respectively. Superior depiction of the cartilage with the MP-IDEAL is demonstrated.
Figure 5.
Results from a 3T FSE knee scan. The same 3-pt data were reconstructed with conventional IDEAL (a), pre-calibrated MP-IDEAL (b) and self-calibrated MP-IDEAL (c). A water image from a fat saturation scan is also included (d) for comparison. Both conventional IDEAL water image and the fat saturation image show “gray fat”, which is removed in the MP-IDEAL water images. The corresponding cropped and magnified images are shown in (e)-(h), where the CNR (Contrast-to-Noise Ratio) are measured between the cartilage (arrow) and the nearby bone marrow (dashed arrow). Noise standard deviation is measured in the ROI indicated. CNR from two MP-IDEAL reconstructions are 24, substantially improved from the conventional IDEAL (CNR=17). The fat saturation shows poor contrast in the same area (arrow) due to both B0 field perturbation and the fat multipeak effect. Other imaging parameters include: effective TE = 38.6ms, echo shifts = [−0.2ms, 0.6ms, 1.4ms], TR = 5000ms, 24 slices, BW = ±125kHz, FOV = 16cm×16cm, slice thickness = 3.5mm, matrix = 320×288, flip angle = 90 degrees, an 8-channel knee coil and total imaging time of 7:15 minutes. The fat saturation scan was acquired with TR = 5200ms, effective TE = 42ms, BW = ±42kHz, 288×288 imaging matrix and total scan time of 1:49 minutes.
Figure 6.
Decomposed water images from a T2W 3T FSE ankle scan (a-c) and a T1W 1.5T FSE cervical spine scan (d-f). The improved fat suppression with the MP-IDEAL approaches can be seen. Other imaging parameters for the ankle scan include: effective TE = 17.2ms, echo shifts = [−0.2ms, 0.6ms, 1.4ms], TR = 3000ms, 12 slices, BW = ±125kHz, FOV = 15cm×15cm, slice thickness = 3.5mm, matrix = 480×320, flip angle = 90 degrees and a quadrature knee coil. Total imaging time was 7:30 minutes. Imaging parameters for the spine scan include: effective TE = 12ms, echo shifts = [−0.4ms, 1.2ms, 2.8ms], TR = 717ms, 11 slices, BW = ±62.5kHz, FOV = 24cm×24cm, slice thickness = 3mm, matrix = 320×256, flip angle = 90 degrees, and total imaging time of 6:14 minutes. A 4-channel head-neck array coil was used.
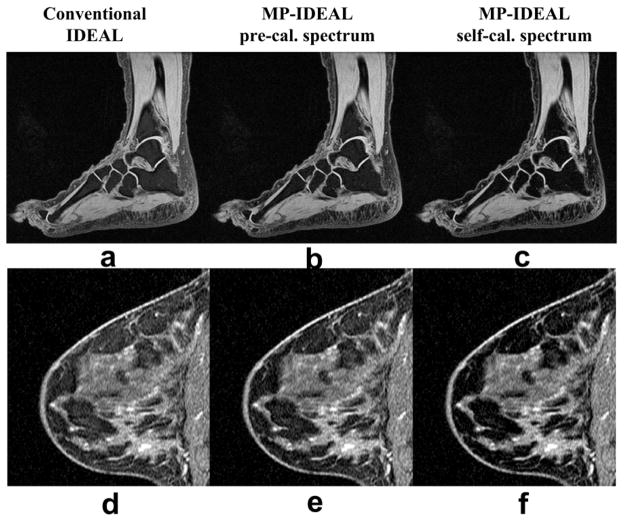
The MP-IDEAL technique was also evaluated with 3-pt 3D-SPGR data and representative results are shown in Figure 7. For both ankle and breast scans, among the water images produced from the three reconstructions, the self-calibrated MP-IDEAL achieves the best fat suppression.
Figure 7.
Decomposed IDEAL water images from a 1.5T 3D-SPGR ankle scan (a-c) and a 1.5T 3D-SPGR breast scan (d-f). In both cases, while improved fat suppression is evident with the pre-calibrated MP-IDEAL, fat is better suppressed in the self-calibrated MP-IDEAL water images. Imaging parameters for the ankle scan include: TEs = [4.4ms, 6.0ms, 7.5ms], TR = 12ms, 64 locations, BW = ±42kHz, FOV = 22cm×22cm, slice thickness = 1.5mm, matrix = 512×224, flip angle = 10 degrees, and total imaging time of 8:35 minutes. A single-channel quadrature foot coil was used. Imaging parameters for the breast scan include: TEs (fractional readout) = [2.0ms, 3.6ms, 5.2ms], TR = 9.8ms, 64 locations, BW = ±42kHz, FOV = 20cm×20cm, slice thickness = 2mm, matrix = 512×192, flip angle = 27 degrees, a 4-channel breast array coil, and total imaging time of 6:02 minutes.
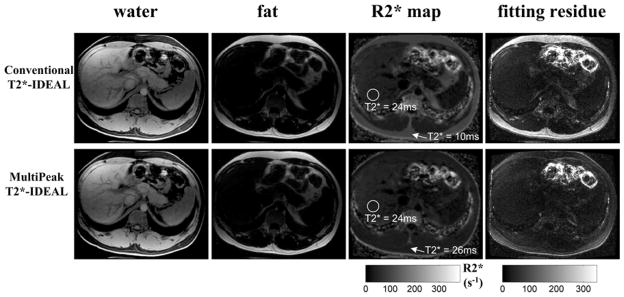
Figure 8 and Figure 9 demonstrate the improved R2* estimation in tissues containing fat with the multipeak T2*-IDEAL reconstruction. Figure 8 is a 6-pt abdominal 3D-SPGR scan. The self-calibration algorithm described above for 6-pt acquisitions was used. The averaged T2* value measured in the subcutaneous fat area (arrows) is 10ms for the conventional T2*-IDEAL reconstruction, demonstrating the R2* over-estimation effect described in Figure 2. In contrast, the multipeak corrected T2* value is 26ms in the same subcutaneous fat area. The improved R2* estimation is also confirmed by the residue maps of the two reconstructions, showing markedly better fit with the multipeak model in the fat area. As expected, the T2* values in liver are the same measured from the two reconstructions.
Figure 8.
Results from a 6-pt 3D-SPGR abdominal scan with a healthy volunteer. T2*-IDEAL reconstructions were performed with (second row) and without (first row) the multipeak correction (spectrum self-calibration). As can be seen from the R2* maps, conventional T2*-IDEAL results in an erroneous estimate of T2* in the subcutaneous fat (average T2* = 10ms). In contrast, the multipeak corrected R2* map shows an improved T2* estimate (averaged T2* = 26ms). The T2* values in liver remain the same as there is no fat in liver. As expected, the residue maps show significant improvement of the fitting in fatty tissues when using the multipeak model. Imaging parameters include: first TE = 1.1ms, echo spacing = 1.7ms, last echo = 9.5ms, TR = 16.2ms, 14 locations, BW = ±167kHz, FOV = 33cm×26cm, slice thickness = 8mm, matrix = 192×160, flip angle = 15 degrees and an 8-channel cardiac coil. The total imaging time was 30 seconds.
Figure 9 illustrates the clinical impact of the R2* over-estimation effect. Results from two patient scans are shown. The conventional T2*-IDEAL reconstruction results in a moderately reduced T2* of approximately 15ms in the liver of both patients, suggesting the presence of mild iron concentration (38). However, with the multipeak corrected T2*-IDEAL, the estimated T2* is within normal limits (22ms) for patient 1 (38). The change of the T2* estimates is caused by the presence of substantial amounts of fat, which biased the estimation of T2* to a shorter value. In addition, with the multipeak correction, the fat-signal fraction measured in patient 1 increased from 35% to 41%, likely due to the appropriate inclusion of the signal from the fat spectral peaks. On the other hand, the water-fat decomposition of patient 2 shows no fat in the liver, and as a result, the T2* value measured in the liver remains the same (T2* =15ms) even with the multipeak correction. The presence of mild iron concentration for patient 2 was also confirmed by biopsy. These examples demonstrate the importance of correcting for the multipeak fat effect when attempting to estimate R2* in liver patients.
Table 1 lists the values of the pre-calibrated αp as well as the self-calibrated αp from the data shown in Figure 4–9. The pre-calibration procedure utilizes 16 echoes, thus allowing fitting of all six visible peaks. The self-calibration algorithms use a simplified 3-frequency spectrum model. As shown in Eq.[A.4] in Appendix A, αp estimated from the 3-pt self-calibration algorithm is not a direct representation of the relative amplitude at each peak, but is also modulated by the terms contributed from the error in the fieldmap and the spectrum model. Therefore, for 3-pt self-calibration, α2 and α3 are in general complex relative to the main peak α1. As also shown in Appendix A (Eq.[A.7]), during the multipeak-IDEAL decomposition of a fat-only pixel, the modulation terms in αp caused by the field map and fat spectrum errors can automatically demodulate them out provided that the same 3-frequency fat spectrum model is used in the calibration and the multipeak-IDEAL reconstruction. Therefore, it is important to keep the phase information of αp. In practice, αp are normalized such that . The phase in αp is highly consistent from different datasets with the same echo shifts; for example, the phase values of α2 and α3 from all FSE data (Fig 4–6) are in close agreement. For 6-pt acquisitions, the additional measurements allow fitting for more unknowns, including the fieldmap. Therefore, the estimated α2 and α3 are in-phase with α1 for all three 6-pt data.
Discussion
In this work we have modified the signal model for the IDEAL/T2*-IDEAL chemical shift-based methods, in order to create a more accurate representation of the fat signal. Fat has a complex spectrum with a considerable fraction of its signal resulting from peaks other than the largest peak. In fact, one of the larger peaks (olefinic proton, peak 3 in Figure 1) is located near the water frequency, which results in some fat signal being incorrectly included in the water image. With more accurate multipeak modeling of fat, improved separation of water and fat is achieved with decreased fat signal in the water images. In addition, improved fitting of the signals within fatty tissues permits more accurate R2* mapping and T2* correction of the water-fat separation. However, further validation work is required to quantify the improvement of fat-fraction and R2* measurements and establish correlation to gold standard techniques. We have chosen IDEAL/T2*-IDEAL as the baseline algorithms, however, other nonlinear curve fitting algorithms, such as AMARES (17,39), may be used to solve the Eq.[1], thus achieving same purpose of multipeak correction. One source of error in the T2*-IDEAL technique is the assumption that the T2* values of water and fat are the same if they co-exist within a voxel (26). In practice, T2* of water and fat may be different due to their difference in T2 (8). The effective T2* shortening effect of fat described due to multiple adjacent fat peaks may substantially magnify this difference, leading to increased error from T2*-IDEAL. Therefore it is very important to correct for the fat spectral peaks in T2*-IDEAL. For methods that model different T2* values for water and fat (17,25,32), it may not be necessary to correct for the T2* shortening effect of fat if T2* of water is of the only interest. When R2* difference of water and fat is considered known and constant (e.g. 1/12ms suggested by (17)), it can be included in the model without increasing the number of unknowns. In this work, the J-coupling effect (peak splitting) between the fat molecule groups (40) is not considered, as the effective signal modulation for the short echo train length (<10ms) is small compared to the typical T2* decay. If the frequencies of the peak splitting are known or measured by high resolution spectroscopy scans, they can be included in the model.
The signal model used in MP-IDEAL requires accurate knowledge of the fat spectrum, including the frequency shifts and the relative amplitudes of the peaks. The fat spectrum can be measured by a separate acquisition, and the pre-calibrated spectrum is then assumed constant and incorporated in the signal model for nonlinear curve fitting, as demonstrated by other studies (10,17). However, it is possible that the fat spectrum may change from subject to subject and sequence to sequence with different T1 and T2 weighting. Therefore, we also introduced spectrum self-calibration methods, where the relative amplitudes of the 3 primary fat peaks are estimated directly from the data. Figure 2(b) suggests an excellent fit of signals using the 3-frequency model at the first six echoes. However, in applications where more echoes are collected, it is possible and may be important to include more peak frequencies (e.g. peak 4) in the self-calibration procedure. Like the pre-calibration methods, the self-calibration methods assume that all fat pixels in the dataset possess the same spectrum. While it has been found in a previous study that the subcutaneous fat and bone marrow have almost identical spectral components (15), one limitation of this assumption is that it doesn’t allow for the possibility of intra-data spectrum variation in different disease states or fatty tissues. However, the modified multipeak model is certainly more representative of the true fat spectrum than the previous single peak model. For all of our self-calibrated MP-IDEAL results, fat appears uniformly dark in all slices in the water images, supporting the assumption that the fat pixels within a dataset can be characterized by the same spectrum. While the pre-calibrated MP-IDEAL in general is sufficient to allow improved water-fat separation compared to conventional IDEAL, the self-calibrated MP-IDEAL provided a more consistent and superior performance.
Compared with conventional IDEAL and T2*-IDEAL, the additional computation cost of the multipeak methods primarily comes from the spectrum self-calibration procedure. In our implementation, the spectrum calibration is performed using the center slice data and the resultant fat spectrum is used for all slices. After the fat spectrum is determined, the matrix A (Eq.2) and its pseudo-inverse, which rely only on the fat spectrum and echo times, needs to be calculated once and is then used for all voxels. Therefore, the processing time at each voxel is the same for IDEAL and MP-IDEAL provided that the proper pre-calculated A matrix is used. With these considerations, the reconstruction penalty for self-calibrated MP-IDEAL is equivalent to the time needed to reconstruct one additional slice using conventional IDEAL. For pre-calibrated approaches where both the fat spectral frequencies and relative amplitudes are presumed known a priori, there is little to no additional computational time penalty.
The modification of the signal model will have an impact on the noise performance of the water-fat decomposition. Glover etl al (2) first defined the effective NSA (Number of Signal Averages) to characterize the noise property of a multipoint water-fat separation method. The optimal echo shifts of a 3-pt water-fat decomposition technique is found by Pineda et al using the Cramer-Rao Bound (CRB) theory (36), however, based on the model that fat has a single peak. For a decomposition method that models multiple fat spectral peaks, such as MP-IDEAL, it is likely that the optimal sampling strategy may be slightly different from the ones for the conventional single-peak model. Despite the complication in noise performance, the MP-IDEAL potentially allows a superior CNR in anatomy and lesions due to the improved fat suppression. A complete analysis of the noise performance and CNR for the modified signal model will be addressed in future work.
It is well known that multi-echo water-fat separation methods may suffer from water-fat ambiguity that often causes water-fat swapping, and as a result, region growing methods that are similar to phase unwrapping algorithms are often needed (4,5,34). In this work, the region growing algorithm designed for IDEAL (34) is applied without any modification. The region growing algorithm estimates the field map following a square-spiral trajectory. At each pixel, it aims to obtain a better initial guess for the iteration by averaging the fieldmap values from the neighboring pixels. Therefore, the algorithm is independent on the model used in the IDEAL iteration. The intrinsic ambiguity arises from the fact that water and fat were both modeled as single peaks separated by 210Hz at 1.5T. As a result, a fat pixel with –210Hz off-resonance behaves identically as an on-resonance water pixel. With the multipeak fat modeling, this ambiguity problem should, in theory, be eliminated as now a water pixel with a single resonant frequency should be distinguished from a fat pixel with multiple resonant frequencies regardless of the B0 off-resonance value. In practice, however, 3-pt and even 6-pt signals may not have sufficient temporal samples to reveal the difference between the two signal evolutions. In particular, local minima still exist, however, they are associated with bigger fitting residue. Therefore, while region growing algorithms are necessary, it is possible to distingusih local minima and true solution better, making the region growing algorithm more robust. This is an advantage of applying the region growing methods specifically developed for IDEAL than using general phase unwrapping algorithms.
Finally, the presence of multiple peaks in the fat spectrum complicates the ability to correct for spatial chemical shift artifacts. For a multi-point water-fat decomposition method with the single peak model, water-fat recombined images free from the chemical shift artifact can be obtained by realigning the separated water and fat images in the readout direction. However when we consider multiple peaks in the spectrum model, each peak will have a different spatial shift in the readout direction. As a consequence, in the fat images there may be blurring due to the different chemical shift artifact of the different spectra peaks of fat. Further work will address this challenge and will require k-space based water-fat separation approaches (41,42).
In conclusion, we have described a new multipeak signal model for water-fat separation and R2* estimation in the presence of fat. We demonstrated that residual fat signal in the water images can be removed with the 3-pt multipeak-IDEAL, leading to improved contrast between the water tissue and the surrounding fatty tissues. Furthermore, R2* is more accurately estimated in the presence of fat with the multipeak corrected T2*-IDEAL. The multipeak fat spectrum, characterized by frequency shifts and relative amplitudes, can be measured by a separate scan and considered known in the modified decomposition algorithms (10,17). Novel spectrum self-calibration algorithms were also introduced to reduce the technique’s sensitivity to potential spectrum variation. Compared to existing water-fat separation methods, the MP-IDEAL and MP T2*-IDEAL methods offer improved fat suppression and improved R2* estimation in the presence of fat for applications such as quantification of hepatic steatosis and hepatic iron overload.
APPENDIX A
In this section, we evaluate the impact of using the field map from conventional 3pt IDEAL reconstruction for 3-pt spectrum self-calibration, described in Eq.4–6. We first assume the real fat spectrum to have P (P ≥ 3) discrete peaks at frequencies fr1, fr2, … frP. The corresponding relative amplitudes are: αr1, αr2, … αrP, with . From Eq.2 and Eq.5, the acquired signals can be described as:
| [A.1] |
where D(ψ) is defined in Eq.[2] and
For a pure fat pixel, Eq.[A.1] becomes:
| [A.2] |
During the 3-pt spectrum self-calibration process, we assume the conventional 3-pt IDEAL results in a field map estimate of ψ̂. In addition, a simplified fat spectrum that consists of three frequencies are used for calibration: F̂, where:
| [A.3] |
Therefore, the 3-pt spectrum self-calibration using pure fat pixels lead to an estimated set of relative amplitudes α̂ that can be described by:
| [A.4] |
where ρfsc is a scaling factor such that the sum of α̂ elements is 1. We have inserted the expression for s in Eq.[A.2] and utilized the fact that D(ψ− ψ̂) = D(ψ) · D(−ψ̂).
As can be seen, in general α̂ is not equal to the true relative amplitudes αr. However, we will show in the following that the error in the calibrated spectrum will compensate for itself in the calibration step and the water-fat decomposition step because the same spectrum model (F̂) is used in the two steps.
First we show that a fat pixel can still be correctly identified as a fat pixel. For a pure fat pixel, the acquired signals can be described with Eq.[A.2]. The model, however, uses a simplified spectrum F̂ and the associated self-calibrated relative amplitudes α̂. During the water-fat decomposition step, the acquired signals are used to fit the following model:
| [A.5] |
where ψ̃ and ρ̃ represent the unknown values that are to be determined in the decomposition step, with the criterion of minimizing the least squares error:
| [A.6] |
Inserting α̂ from Eq.[A.4] into Eq.[A.6]:
| [A.7] |
where it should be noted that D(ψ̂) · D(ψ − ψ̂) = D(ψ). It can be seen that the solutions that will make the least square error 0 are:
| [A.8] |
Therefore, a fat pixel can be correctly identified as a fat-only pixel. Note that the solution of the fieldmap ψ̃ is the same as the fieldmap estimated from 3-pt conventional IDEAL ψ̂.
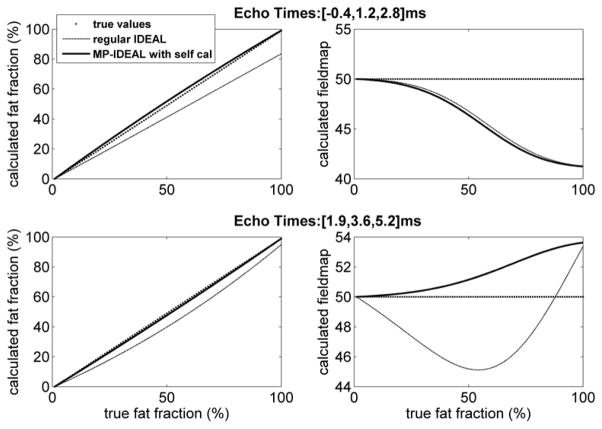
With a mixture of water and fat, Eq.[A.7] no longer has an exact set of solutions. We used simulations to study the impact on fat fraction measurements. A pre-calibrated spectrum that consists of 6 discrete frequencies is used as the real spectrum Fr · αr. The synthesized 3-echo source signals are produced using this real fat spectrum and water-fat contents with increasing fat-fraction. The spectrum self-calibration then is performed with a pure fat pixel. Both the conventional 3-pt IDEAL and MP-IDEAL reconstructions are performed with the source signals at each fat-fraction. The calculated fat-fraction and fieldmap were plotted against the true fat fraction. This procedure was repeated with different echo times, including FSE IDEAL echo times ([-0.4ms, 1.2ms, 2.8ms]) (6,36) and SPGR IDEAL echo times ([1.9ms, 3.6ms, 5.2ms]) (35). Results are shown in Figure 10. The conventional IDEAL results in biased fat fraction measurements as the fat content increases. In contrast, MP-IDEAL calculated fat-fraction values are in close agreement with the true fat fraction. As predicted from Eq.[A.8], in the case of a pure fat pixel, the fieldmap values from the two reconstructions are identical and the fat-fraction measured from MP-IDEAL is 1.
Figure 10.
Simulations to study the fat-fraction measurement using the 3-pt self-calibrated MP-IDEAL. Simulated 3-pt source signals are produced with an assumed 6-frequency fat spectrum. The 3-pt spectrum self-calibration algorithm described is performed using the field map from conventional 3-pt IDEAL and a 3-frequency fat spectrum model. The conventional IDEAL and MP-IDEAL reconstructions are performed and the fat-fraction measurements are obtained. This process is repeated with increasing fat fraction and different echo times. The true fieldmap value of 50Hz was used. While conventional IDEAL results in biased fat-fraction measurements (dashed line), MP-IDEAL (solid line) leads to substantially improved agreement with the true fat-fraction (dotted line).
References
- 1.Dixon WT. Simple proton spectroscopic imaging. Radiology. 1984;153(1):189–194. doi: 10.1148/radiology.153.1.6089263. [DOI] [PubMed] [Google Scholar]
- 2.Glover GH. Multipoint Dixon technique for water and fat proton and susceptibility imaging. J Magn Reson Imaging. 1991;1(5):521–530. doi: 10.1002/jmri.1880010504. [DOI] [PubMed] [Google Scholar]
- 3.Glover GH, Schneider E. Three-point Dixon technique for true water/fat decomposition with B0 inhomogeneity correction. Magn Reson Med. 1991;18(2):371–383. doi: 10.1002/mrm.1910180211. [DOI] [PubMed] [Google Scholar]
- 4.Xiang QS, An L. Water-fat imaging with direct phase encoding. J Magn Reson Imaging. 1997;7(6):1002–1015. doi: 10.1002/jmri.1880070612. [DOI] [PubMed] [Google Scholar]
- 5.Ma J. Breath-hold water and fat imaging using a dual-echo two-point Dixon technique with an efficient and robust phase-correction algorithm. Magn Reson Med. 2004;52(2):415–419. doi: 10.1002/mrm.20146. [DOI] [PubMed] [Google Scholar]
- 6.Reeder SB, Pineda AR, Wen Z, Shimakawa A, Yu H, Brittain JH, Gold GE, Beaulieu CF, Pelc NJ. Iterative decomposition of water and fat with echo asymmetry and least-squares estimation (IDEAL): Application with fast spin-echo imaging. Magn Reson Med. 2005;54(3):636–644. doi: 10.1002/mrm.20624. [DOI] [PubMed] [Google Scholar]
- 7.Szczepaniak LS, Babcock EE, Schick F, Dobbins RL, Garg A, Burns DK, McGarry JD, Stein DT. Measurement of intracellular triglyceride stores by H spectroscopy: validation in vivo. Am J Physiol. 1999;276(5 Pt 1):E977–989. doi: 10.1152/ajpendo.1999.276.5.E977. [DOI] [PubMed] [Google Scholar]
- 8.Thomsen C, Becker U, Winkler K, Christoffersen P, Jensen M, Henriksen O. Quantification of liver fat using magnetic resonance spectroscopy. Magn Reson Imaging. 1994;12(3):487–495. doi: 10.1016/0730-725x(94)92543-7. [DOI] [PubMed] [Google Scholar]
- 9.Ling M, Brauer M. Ethanol-induced fatty liver in the rat examined by in vivo 1H chemical shift selective magnetic resonance imaging and localized spectroscopic methods. Magn Reson Imaging. 1992;10(4):663–677. doi: 10.1016/0730-725x(92)90019-v. [DOI] [PubMed] [Google Scholar]
- 10.Bydder M, Hamilton G, Yokoo T, Middleton MS, Chavez AD, Sirlin C. Fat-Fat Interations in Dixon-Variant Imaging. Berlin, Germany: 2007. May, p. 1632. [Google Scholar]
- 11.Hilaire L, Wehrli FW, Song HK. High-speed spectroscopic imaging for cancellous bone marrow R(2)* mapping and lipid quantification. Magn Reson Imaging. 2000;18(7):777–786. doi: 10.1016/s0730-725x(00)00165-x. [DOI] [PubMed] [Google Scholar]
- 12.Wehrli FW, Perkins TG, Shimakawa A, Roberts F. Chemical shift-induced amplitude modulations in images obtained with gradient refocusing. Magn Reson Imaging. 1987;5(2):157–158. doi: 10.1016/0730-725x(87)90045-2. [DOI] [PubMed] [Google Scholar]
- 13.Brix G, Heiland S, Bellemann ME, Koch T, Lorenz WJ. MR imaging of fat-containing tissues: valuation of two quantitative imaging techniques in comparison with localized proton spectroscopy. Magn Reson Imaging. 1993;11(7):977–991. doi: 10.1016/0730-725x(93)90217-2. [DOI] [PubMed] [Google Scholar]
- 14.Ma J, Singh SK, Kumar AJ, Leeds NE, Broemeling LD. Method for efficient fast spin echo Dixon imaging. Magn Reson Med. 2002;48(6):1021–1027. doi: 10.1002/mrm.10306. [DOI] [PubMed] [Google Scholar]
- 15.Wehrli FW, Ma J, Hopkins JA, Song HK. Measurement of R′2 in the presence of multiple spectral components using reference spectrum deconvolution. J Magn Reson. 1998;131(1):61–68. doi: 10.1006/jmre.1997.1327. [DOI] [PubMed] [Google Scholar]
- 16.Bernard CP, Liney GP, Manton DJ, Turnbull LW, Langton CM. Comparison of fat quantification methods: A phantom study at 3.0T. J Magn Reson Imaging. 2007;27(1):192–197. doi: 10.1002/jmri.21201. [DOI] [PubMed] [Google Scholar]
- 17.Bydder M, Yokoo T, Hamilton G, Middleton MS, Chavez AD, Schwimmer JB, Lavine JE, Sirlin CB. Relaxation effects in the quantification of fat using gradient echo imaging. Magn Reson Imaging. 2008;26(3):347–59. doi: 10.1016/j.mri.2007.08.012. [DOI] [PMC free article] [PubMed] [Google Scholar]
- 18.Haase A, Frahm J, Hanicke W, Matthaei D. 1H NMR chemical shift selective (CHESS) imaging. Phys Med Biol. 1985;30(4):341–344. doi: 10.1088/0031-9155/30/4/008. [DOI] [PubMed] [Google Scholar]
- 19.Meyer CH, Pauly JM, Macovski A, Nishimura DG. Simultaneous spatial and spectral selective excitation. Magn Reson Med. 1990;15(2):287–304. doi: 10.1002/mrm.1910150211. [DOI] [PubMed] [Google Scholar]
- 20.Hussain HK, Chenevert TL, Londy FJ, Gulani V, Swanson SD, McKenna BJ, Appelman HD, Adusumilli S, Greenson JK, Conjeevaram HS. Hepatic fat fraction: MR imaging for quantitative measurement and display--early experience. Radiology. 2005;237:1048–1055. doi: 10.1148/radiol.2373041639. [DOI] [PubMed] [Google Scholar]
- 21.Maas M, Hollak CE, Akkerman EM, Aerts JM, Stoker J, Den Heeten GJ. Quantification of skeletal involvement in adults with type I Gaucher’s disease: fat fraction measured by Dixon quantitative chemical shift imaging as a valid parameter. AJR Am J Roentgenol. 2002;179(4):961–965. doi: 10.2214/ajr.179.4.1790961. [DOI] [PubMed] [Google Scholar]
- 22.Reeder SB, Wen Z, Yu H, Pineda AR, Gold GE, Markl M, Pelc NJ. Multicoil Dixon chemical species separation with an iterative least-squares estimation method. Magn Reson Med. 2004;51(1):35–45. doi: 10.1002/mrm.10675. [DOI] [PubMed] [Google Scholar]
- 23.Ma J, Wehrli FW, Song HK, Hwang SN. A single-scan imaging technique for measurement of the relative concentrations of fat and water protons and their transverse relaxation times. J Magn Reson. 1997;125(1):92–101. doi: 10.1006/jmre.1996.1086. [DOI] [PubMed] [Google Scholar]
- 24.Yu H, McKenzie C, Shimakawa A, Pelc N, Brittain J, Reeder S. IDEAL Water-Fat Separation with Simultaneous T2* Estimation. Proceedings 13th Scientific Meeting, International Society for Magnetic Resonance in Medicine; 2006. p. 624. [Google Scholar]
- 25.Bydder M, Middleton M, Sirlin C, Gatehouse P, Chavez A. Fat quantification by modeling the variation in signal amplitude with TE. Seattle: 2006. May, p. 2298. [Google Scholar]
- 26.Yu H, McKenzie CA, Shimakawa A, Vu AT, Brau AC, Beatty PJ, Pineda AR, Brittain JH, Reeder SB. Multiecho reconstruction for simultaneous water-fat decomposition and T2* estimation. J Magn Reson Imaging. 2007;26(4):1153–1161. doi: 10.1002/jmri.21090. [DOI] [PubMed] [Google Scholar]
- 27.Chitturi S, Weltman M, Farrell GC, McDonald D, Kench J, Liddle C, Samarasinghe D, Lin R, Abeygunasekera S, George J. HFE mutations, hepatic iron, and fibrosis: ethnic-specific association of NASH with C282Y but not with fibrotic severity. Hepatology. 2002;36(1):142–149. doi: 10.1053/jhep.2002.33892. [DOI] [PubMed] [Google Scholar]
- 28.Bugianesi E, Manzini P, D’Antico S, Vanni E, Longo F, Leone N, Massarenti P, Piga A, Marchesini G, Rizzetto M. Relative contribution of iron burden, HFE mutations, and insulin resistance to fibrosis in nonalcoholic fatty liver. Hepatology. 2004;39(1):179–187. doi: 10.1002/hep.20023. [DOI] [PubMed] [Google Scholar]
- 29.George DK, Goldwurm S, MacDonald GA, Cowley LL, Walker NI, Ward PJ, Jazwinska EC, Powell LW. Increased hepatic iron concentration in nonalcoholic steatohepatitis is associated with increased fibrosis. Gastroenterology. 1998;114(2):311–318. doi: 10.1016/s0016-5085(98)70482-2. [DOI] [PubMed] [Google Scholar]
- 30.Bonkovsky HL, Jawaid Q, Tortorelli K, LeClair P, Cobb J, Lambrecht RW, Banner BF. Non-alcoholic steatohepatitis and iron: increased prevalence of mutations of the HFE gene in non-alcoholic steatohepatitis. J Hepatol. 1999;31(3):421–429. doi: 10.1016/s0168-8278(99)80032-4. [DOI] [PubMed] [Google Scholar]
- 31.Yokoo T, Bydder M, Barksdale J, Hamilton G, Middleton M, Sirlin C, Bydder G. Effects of T1, T2, and Spectral Complexity on In-and Out-of-Phase Imaging: A systematic approach by computer simulation. Berlin, Germany: 2007. May, p. 1720. [Google Scholar]
- 32.Graff C, Clarkson EW, Li Z, Altbach MI. An algorithm for lipid-water separation in the presence of T2* decay. Berlin, Germany: 2007. May, p. 1624. [Google Scholar]
- 33.Garbow JR, Lin X, Sakata N, Chen Z, Koh D, Schonfeld G. In vivo MRS measurement of liver lipid levels in mice. J Lipid Res. 2004;45(7):1364–1371. doi: 10.1194/jlr.D400001-JLR200. [DOI] [PubMed] [Google Scholar]
- 34.Yu H, Reeder SB, Shimakawa A, Brittain JH, Pelc NJ. Field map estimation with a region growing scheme for iterative 3-point water-fat decomposition. Magn Reson Med. 2005;54(4):1032–1039. doi: 10.1002/mrm.20654. [DOI] [PubMed] [Google Scholar]
- 35.Reeder SB, McKenzie CA, Pineda AR, Yu H, Shimakawa A, Brau AC, Hargreaves BA, Gold GE, Brittain JH. Water-fat separation with IDEAL gradient-echo imaging. J Magn Reson Imaging. 2007;25(3):644–652. doi: 10.1002/jmri.20831. [DOI] [PubMed] [Google Scholar]
- 36.Pineda AR, Reeder SB, Wen Z, Pelc NJ. Cramer-Rao bounds for three-point decomposition of water and fat. Magn Reson Med. 2005;54(3):625–635. doi: 10.1002/mrm.20623. [DOI] [PubMed] [Google Scholar]
- 37.Liu CY, McKenzie CA, Yu H, Brittain JH, Reeder SB. Fat quantification with IDEAL gradient echo imaging: correction of bias from T(1) and noise. Magn Reson Med. 2007;58(2):354–364. doi: 10.1002/mrm.21301. [DOI] [PubMed] [Google Scholar]
- 38.Westwood M, Anderson LJ, Firmin DN, Gatehouse PD, Charrier CC, Wonke B, Pennell DJ. A single breath-hold multiecho T2* cardiovascular magnetic resonance technique for diagnosis of myocardial iron overload. J Magn Reson Imaging. 2003;18(1):33–39. doi: 10.1002/jmri.10332. [DOI] [PubMed] [Google Scholar]
- 39.Vanhamme L, van den Boogaart A, Van Huffel S. Improved method for accurate and efficient quantification of MRS data with use of prior knowledge. J Magn Reson. 1997;129(1):35–43. doi: 10.1006/jmre.1997.1244. [DOI] [PubMed] [Google Scholar]
- 40.Stables LA, Kennan RP, Anderson AW, Constable RT, Gore JC. Analysis of J coupling-induced fat suppression in DIET imaging. J Magn Reson. 1999;136(2):143–151. doi: 10.1006/jmre.1998.1628. [DOI] [PubMed] [Google Scholar]
- 41.Brodsky EK, Holmes JH, Reeder SB. Correction of Chemical Shift Blurring in Non-Cartesian Water-Fat Imaging. ISMRM Workshop on Non-Cartesian MRI; 2007. p. 36. [Google Scholar]
- 42.Lu W, Reeder S, Daniel B, Hargreaves B. Chemical Shift Correction in Bipolar Multi-Echo Sequences for Water and Fat Separation. Proceedings 14h Scientific Meeting, International Society for Magnetic Resonance in Medicine; 2007. p. 1622. [Google Scholar]


