Abstract
Non-invasive biomarkers of intracellular accumulation of fat within the liver (hepatic steatosis) are urgently needed for detection and quantitative grading of non-alcoholic fatty liver disease (NAFLD), the most common cause of chronic liver disease in the US. Accurate quantification of fat with MRI is challenging due the presence of several confounding factors including T2* decay. The specific purpose of this work is to quantify the impact of T2* decay and develop a multi–exponential T2* correction method for improved accuracy of fat quantification, relaxing assumptions made by previous T2* correction methods. A modified Gauss-Newton algorithm is used to estimate the T2* for water and fat independently. Improved quantification of fat is demonstrated with independent estimation of T2* for water and fat using phantom experiments. The tradeoffs in algorithm stability and accuracy between multi–exponential and single exponential techniques are discussed.
Keywords: fat quantification, chemical shift imaging, T2* decay, hepatic steatosis, IDEAL
Introduction
Non-Alcoholic Fatty Liver Disease (NAFLD) is now recognized as the most common cause of chronic liver disease, afflicting up to 30% of all Americans1. It is an emerging condition closely related to obesity and insulin resistance. Importantly, NAFLD’s prevalence among children is reported to be up to 10% overall, and as high as 53% in obese children2–4. NAFLD is expected by many experts to become a leading cause of end-stage liver disease as the prevalence of obesity increases in the general population, both in the US and worldwide.
The hallmark feature of NAFLD is intracellular accumulation of triglycerides within hepatocytes (steatosis). In many patients, steatosis leads to inflammation and fibrosis, and ultimately to cirrhosis, with subsequent liver failure or development of hepatocellular carcinoma. In such patients liver transplant is the only definitive option for cure. Non-targeted liver biopsy, which is the current gold standard for diagnosis of NAFLD, is limited by its high cost, morbidity and importantly, its high sampling variability due to the heterogeneous nature of intracellular lipid accumulation. Quantitative assessment of liver fat using MRI is attractive, because it can assess fat over the entire liver, thus avoiding the sampling variability as well as the risks and high cost of biopsy.
Chemical shift-based MRI techniques are currently under development by many groups for the quantification of liver fat5–10. These methods exploit the differences in chemical shift between water and fat (−210Hz between water and the main resonance peak of fat, at 1.5T). Chemical shift-based methods are often used to estimate the concentration of triglycerides through the use of the fat-fraction, which is independent ofB1 coil sensitivities and therefore is a useful metric of fat concentration11.
Two-point methods acquire two images, one in which water and main peak of fat are in-phase and the other in which they are out-of-phase12,13. Multi-point chemical shift-based methods5,9,14,15 separate the signals of water and fat, even in the presence of magnetic field inhomogeneities, permitting estimation of fat-fractions over a full dynamic range of 0–100%. However, two-point and multi-point chemical shift-based water-fat separation methods are limited for fat quantification as a result of T2* decay, T1 related bias7,16 and the lack of accurate spectral modeling of fat, which has multiple spectral peaks7,17, which leads to inaccurate separation of water and fat signals17. In addition, the recombination of magnitude fat and water images into a fat-fraction image can also introduce noise related bias16.
These confounding factors have recently been addressed by several groups, including small flip angle and dual flip angle approaches to avoid T1 related bias7,16, magnitude discrimination and phase constrained methods to avoid noise bias16, and the use of accurate spectral modeling to separate fat signal more accurately7,17.
T2* decay is well known to corrupt estimates of fat-fraction, and is particularly important in chronic liver diseases such as NAFLD, where concomitant iron overload can occur in up to 40% of patients18,19. Typical values of T2* in the livers of healthy individuals are variable, but typically exceed 20ms20. In the case of patients with iron overload, however, significant T2* shortening may exist. In such cases, T2* can be less than a few milliseconds21. If T2* decay is not included in the signal model, it will corrupt the accuracy of all chemical shift-based fat quantification methods. Yu et al22 and Bydder et al7 independently introduced methods that estimate T2* from the signal and demodulate its effects, correcting estimates of fat-fraction.
Yu et al22 assume T2* decay for water and fat signals to be identical, and Bydder et al7 estimate only a single T2* value independently. While correcting for a single T2* value has been shown to improve estimates of fat-fraction7,10,22, the assumption that T2* of water and fat are interdependent, is questionable and could lead to inaccuracies in the estimation of fat-fraction. We explore the inaccuracies that can result from this simplification and propose a new correction algorithm with independent T2* modeling for water and fat with the goal of improving the accuracy of fat-fraction estimation. The accuracy and stability of this algorithm are compared with that of a single T2* correction method.
Theory
Signal Model
The signal from a voxel containing water and fat with independent T2* decay for all fat peaks can be written as:
| [1] |
Here W and F are the water and fat signals, ψ is the shift (Hz) in the spectrum caused by local B0 field inhomogeneities. is the R2* of water. Δfp and are the central resonance frequency and R2* of the pth fat peak, respectively. rp is the relative proportion of the pth fat peak such that . Note that both the frequencies (Δfp) and relative amplitudes (rp) of the fat peaks are assumed to be known5,17.
Eq.1 is a multiple T2* signal equation, where each fat peak has a different T2* value. If we simplify this expression by considering T2* of water to be the same as the T2* of all fat peaks, i.e. , then we obtain the single T2* signal model used by Yu et al17,22:
| [2] |
In Yu’s single T2* method17, the fat spectrum was known a priori, either measured using MR spectroscopy or estimated directly from the data using spectrum self-calibration algorithms17.
Fat Quantification without Dual T2* correction
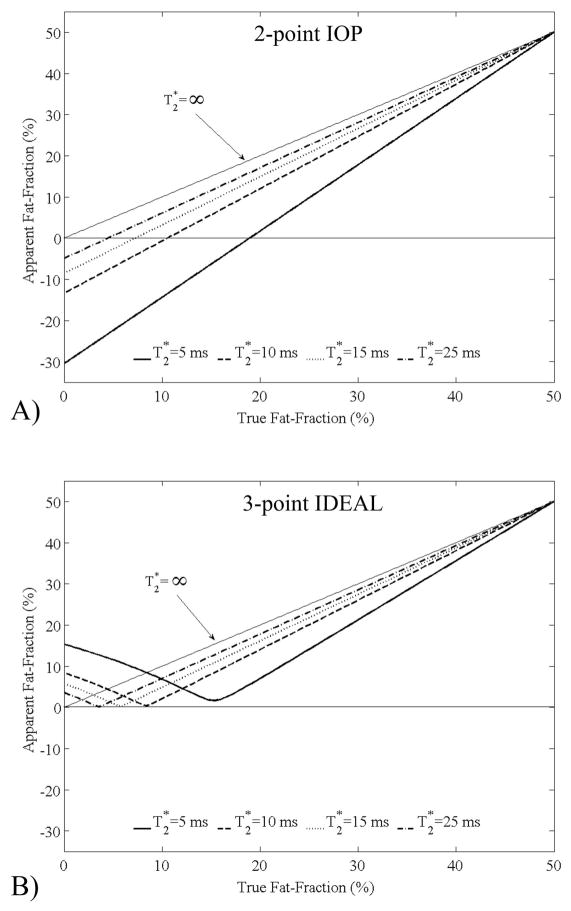
The correction of a single T2* is known to improve estimates of fat-fraction7,17. Particularly, when fat-fractions to be estimated are low, and when T2* of water and fat are similar, single T2* methods can avoid large errors. To examine the importance of T2* correction, simulations were conducted to find absolute percentage errors in the estimation of fat-fraction with signal models that do not account for T2* decay. Simulations that examined the apparent fat-fraction obtained using 2-point in-phase/out-of-phase (IOP) imaging12,13 without T2* correction, were performed and are shown in Figure 1A. As is seen in this plot, errors as large as 30% can occur. In addition, 3-point methods such as 3-point IDEAL9,23 can generate errors up to 15% if no T2* correction is performed (Figure 1B).
Figure 1.
Simulations of the apparent fat-fractions estimated using 2-point IOP and conventional 3-point IDEAL, neither of which correct for T2* decay. A) IOP demonstrates large errors with negative, paradoxical values of apparent fat-fraction. An apparent fat-fraction of −5% occurs even when no fat is present and T2* is normal (25ms). B) Relatively large errors are also seen with 3-point IDEAL when no correction for T2* decay is made. There errors are clinically very relevant and underscore the need for T2* correction. For these simulations it is assumed that the T2* of water and fat are equal.
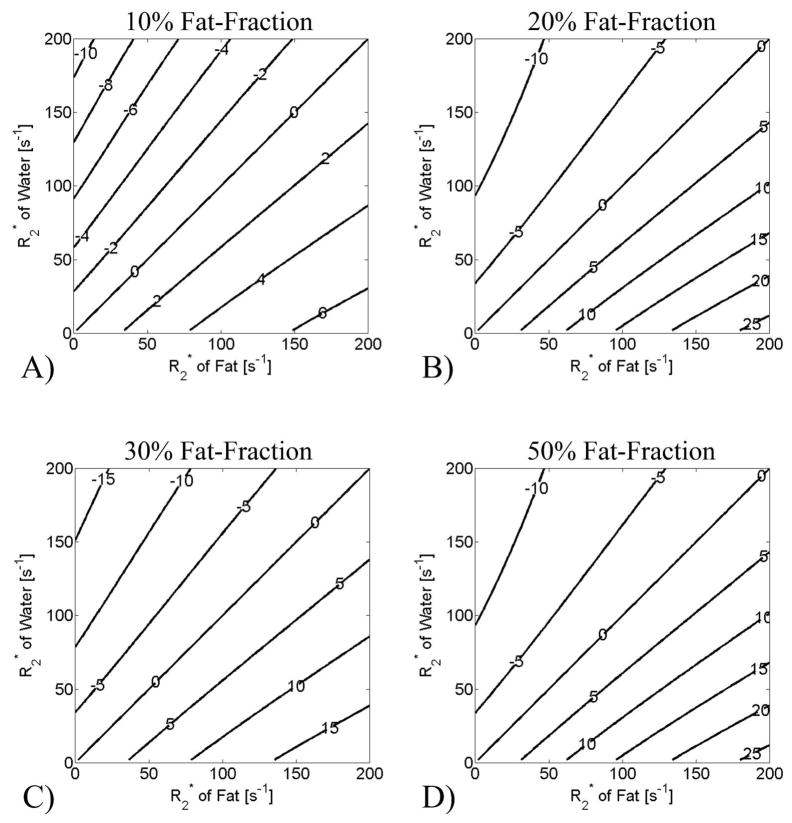
Although the correction of a single value of T2* improves estimates of fat-fraction7,17, the validity of the assumption that the rates of signal decay of water and fat are the same is unclear, as there is no physiological basis for this assumption. To examine the importance of dual T2* correction, simulations that demonstrate the impact of different fat and water T2* values were conducted to find absolute percentage errors in the estimation of fat-fraction with signal models that model the T2* of water and fat to be equal, and are shown in Figure 2. When the values of T2* for water and fat are identical (along the diagonal) this model accurately measures fat-fraction and there is no error. However, when T2* of water and fat are not the same, errors in the estimation of fat-fraction using a single T2* correction method can exceed 20% when T2* values of water and fat are short (Figure 2), particularly at higher fat-fractions.
Figure 2.
Simulations of the percentage error in measured fat-fraction when using single T2* correction with 6-point IDEAL to reconstruct data where the T2* of fat and water is different. Different fat-fractions were simulated: a) 10%, b) 20%, c) 30% and d) 50%. 0% fat-fraction is not shown because single T2* methods generate no error for this case. The labels on the contour plots show the absolute percentage errors in fat-fraction estimation. The error in the apparent fat-fraction is zero along the diagonal of the contour plots, because the single T2* correction method accurately removes the error caused by T2* decay. Relatively large errors, however, can occur when T2* of water and fat are not equal, particularly at higher fat-fraction and shorter T2* values (longer R2*).
Dual T2* method for independent estimation of T2* of water and fat
Clearly there is a need for correction of T2* decay with MRI methods attempting to quantify fat. Further, correction for T2* decay that assumes a common rate of signal decay for water and fat can lead to very large errors in the estimated fat-fraction if the rates of decay are in fact significantly different and there is also a large amount of fat. For this reason, we develop a signal model and estimation algorithm below, which permits independent estimation of T2* decay rates for water and fat to improve the accuracy of fat quantification with MRI.
Because all the protons on a single triglyceride molecule experience very similar microscopic magnetic field inhomogeneities, it may be reasonable to assume that all the fat peaks have the same T2* values, although these values are different than that of water. We define the variable such that for all p. Eq. 1 can now be written
| [3] |
We will use Eq. 3 as the signal model for the dual T2* estimation described in the remainder of this work. The real and imaginary parts of s(t) namely sr(t) and si(t), can be written
| [4] |
| [5] |
From Eqs. 4 and 5, the seven parameters that must be estimated are Wr, Wi, Fr, Fi, and ψ, where Wr, Wi and Fr, Fi are the real and imaginary parts of W and F, respectively. A minimum of four complex images (equivalent of 8 measurements) must be acquired at different echo times to estimate these parameters. We propose an iterative technique based on the Gauss-Newton method for multiple variables to independently estimate these parameters.
The initial iteration of the algorithm uses starting values estimated from a single exponential T2* correction method such as T2*–IDEAL17,22. Initial guesses for Wr, Wi, Fr, Fi, , and ψ from a single T2* correction method are useful starting values, not only to reduce the number of iterations, but also to avoid convergence to local minima24.
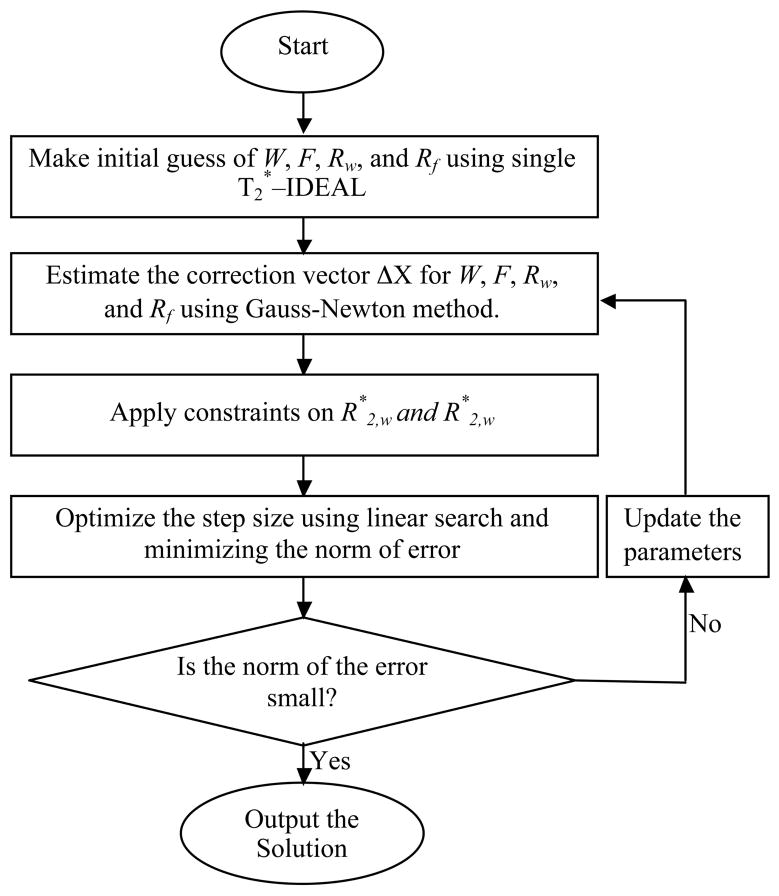
Estimates of the parameters are subsequently updated using Taylor’s first order approximation for multiple variables, as is done in the Gauss-Newton method. The difference between the measured signal and the signal calculated from the parameters in the current iteration (Eqs. 4 and 5), is then calculated. This difference was reduced by finding a constant multiplying factor that minimizes the L2 norm for the difference vector used to update the parameters25,26. In this way, the step size obtained from the Gauss-Newton method was optimized by performing a linear search in the direction of the difference vector. The process was repeated until the mean squared error was reduced to a value smaller than a predetermined value, or if the numbers of iterations exceeded a particular count. The algorithm is described as follows and is summarized in Figure 3.
Figure 3.
Flow chart that summarizes the algorithm to estimate water and fat using the signal model that allows independent estimation of T2* for water and fat.
Notation
Let be the vector representation of the parameters to be estimated, such that each element of the vector is real. Let X̂j be the estimate of the vector X at the jth iteration of the algorithm. If N echoes images are acquired at echo times of t1, t2 … tn…N then let S be the vector representation of real and imaginary echo points such that
where s r(tn) and si (tn) are the real and imaginary parts of s(tn), the signal at the nth echo. Let the estimated signal vector calculated using X̂j from the signal model in Eqs. 4 and 5 be Ŝj, where .
Let ΔX̂j be the correction factor for X̂j to reduce the mean squared error between measured signal vector S and the estimated signal vector Ŝj. The algorithm becomes:
Initialization: The initial guess for all the parameters is obtained from a single exponential T2* correction techniques such as multipeak T2*–IDEAL method17.
-
Applying Gauss-Newton method: Next, we iteratively update the estimate of X using Taylor’s first-order approximation for multiple variables, ie:
[6] and[7] The two expressions in Eqs. 6 and 7 evaluated at different echo times t1, t2,…tN can be written in the matrix form as[8] Here B is a 2N×7 matrix whose elements contain the partial derivatives from Eqs. 4 and 5. The expression for the matrix B and explicit expressions for partial derivatives are in the appendix.
- Estimating the step-size: The correction vector for the estimated parameter vector is estimated using the Moore-Penrose pseudoinverse matrix, ie:
[9] Linear-search to optimize step size: The step size obtained is optimized25,26 by multiplying ΔX̂j with a constant multiplying factor k that minimizes the residual error. k is determined by minimizing the L2 norm of (S - Ŝj). This optimization reduces the number of iterations required before the algorithm converges to a solution. When this optimization is not used, the value of k is set to 1.
- Updating the estimation: After determining the value of k, we update the estimation of vector X̂ for the next iteration, ie:
[10] Iteratively converging to solution: We repeat the procedure until the error converges to a very small value or the number of iterations become more than a predefined number. Empirically, we have found that a stopping point of 0.1% percent of the magnitude of the X, or when the number of iterations exceeds 50, is a useful stopping criterion. Typically, the algorithm converged in 20 iterations.
Estimating T2* of fat in the case of extreme fat fractions
If the estimated fat-fraction from single exponential techniques is 0% (or 100%) then we have no need for dual exponential technique, as there is no fat (water) to estimate. The dual T2* technique becomes ill-conditioned at very low (high) fat fractions when there is very little signal from fat (water), because the very low fat signal observed at the sample times could occur either from the absence of fat or from extremely short T2* values of fat. In these cases, the B matrix becomes singular, and there are multiple possible solutions to the problem. This problem can be solved by imposing constraints on the estimated values of R2* of water and fat. We have constrained the values of R2* of water or fat to be less than 300 s−1 and greater than 0 s−1, which encompasses a very wide range that will handle all physiologically possible values of R2* in water or fat.
Methods and Materials
Phantom Construction and Imaging
A fat/water/iron oxide phantom was constructed containing varying known fat fractions (0.0, 0.03, 0.05, 0.11, 0.21, 0.32, 0.42, 0.52) and iron concentrations (0, 10, 21, 32 μg Fe/mL), with details described elsewhere27.
Imaging was performed using the head coil of a 1.5T Signa HDx system (v14.0, TwinSpeed, GE Healthcare, Waukesha, WI) using an investigational multi-echo 3D spoiled gradient echo pulse sequence. Imaging parameters included the following: TEmin=1.4 ms, ΔTE=1.6 ms, 6 echoes/TR, and TR=42.7 ms, with flip=5° to minimize T1 bias16, FOV=35×35 cm, matrix=256 × 256, BW=±100kHz, 1 signal average, and slice thickness=8mm.
Results
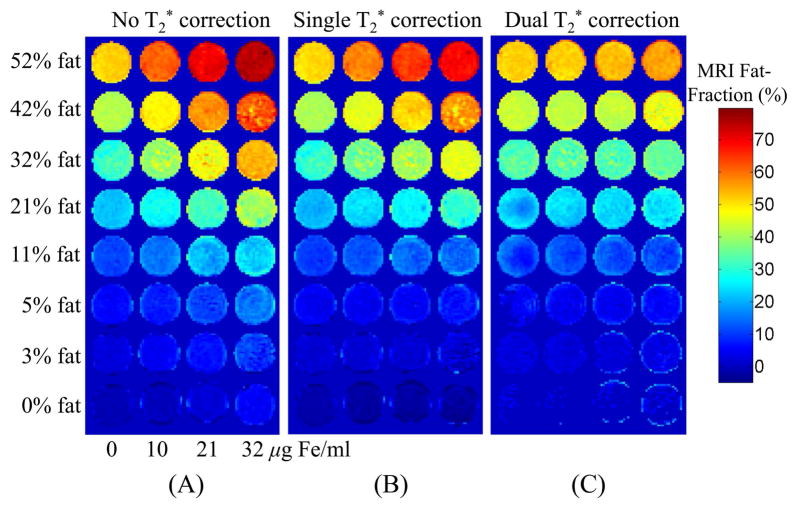
Figure 4 shows the phantom fat-fraction images reconstructed using methods considering no T2* correction (Figure 4A), single T2* correction (Figure 4B) and dual T2* correction (Figure 4C). Improved and uniform estimation of fat-fraction can be observed using the proposed method, especially at higher fat-fractions.
Figure 4.
Fat-fraction images from the fat/water/SPIO phantom reconstructed with a) no T2* correction, b) single T2* correction, c) dual T2* reconstruction. For each row, fat-fraction should remain constant as the SPIO concentration increases. Only with the dual T2* correction method does this occur.
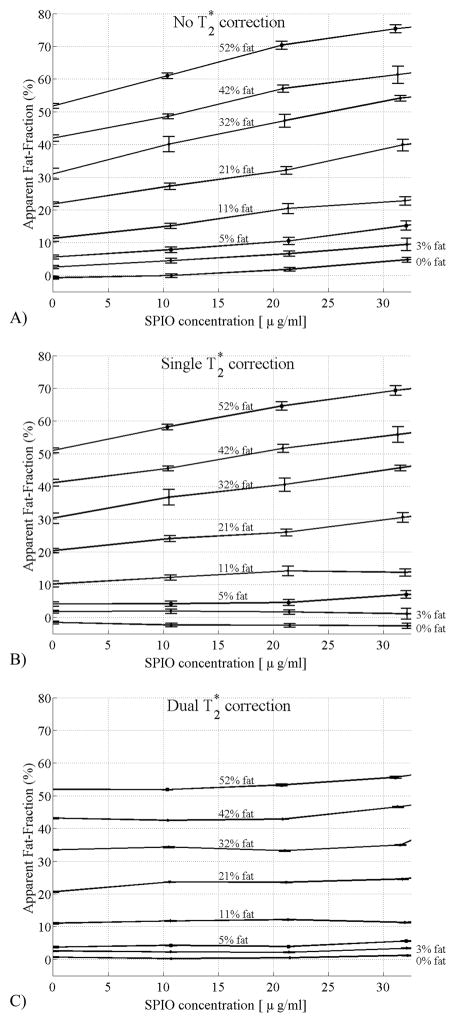
Figure 5 plots the estimated values of fat-fraction at different true fat-fractions (0.0, 0.03, 0.05, 0.11, 0.21, 0.32, 0.42, 0.52) and iron concentrations (0, 10, 21, 32 μg Fe/mL) without T2* correction (Figure 4A), single T2* correction (Figure 4B) and with T2* correction using the proposed dual T2* method (Figure 4C). Error bars show the standard error of the mean. For iron concentrations of 32 μg/mL, errors in estimated fat-fractions were reduced from 30% with no T2* correction to 25% with single T2* correction and to less than 5% using dual T2* correction. As expected, the impact of T2* correction was less at lower fat fractions and/or lower iron concentrations.
Figure 5.
Fat-fraction measured from the fat/water/SPIO phantom reconstructed with a) no T2* correction, b) single T2* correction, c) dual T2* reconstruction. Error bars show the standard error of the mean. As the SPIO concentration increases, the fat-fraction should remain constant if the correction algorithm is removing the effects of T2* decay correctly. Large errors are seen without T2* correction, and although the single T2* correction method improves estimates of fat-fraction, relatively large errors are still seen at high fat fractions. Only with the dual T2* correction method does the estimated fat-fraction agree closely with the known fat-fraction, independent of SPIO concentration.
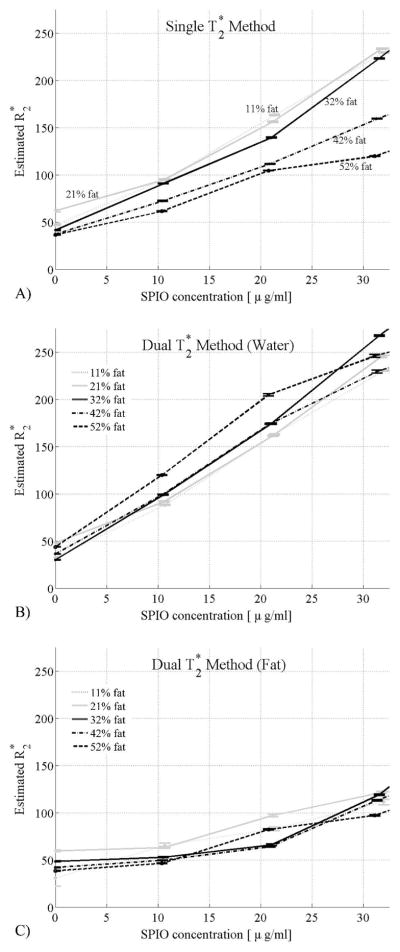
Figure 6 shows the estimated R2* values from single T2* correction (Figure 6A) and the dual T2* correction methods (Figure 6B,C) at different iron concentrations for different fat-fractions. Error bars show the standard error of the mean. These plots demonstrate large differences in the estimated R2* values of water and fat in this phantom. This is particularly true at higher SPIO concentrations where R2* of water more rapidly increases, compared to that of fat. The results for R2* show that the R2* of water is similar to the R2* of fat for SPIO concentrations below 5 μg/mL and that the R2* of water is significantly greater than the R2* of fat for SPIO concentrations above 5 μg/mL, underscoring the need for a dual T2* correction. It can also be observed that the estimated R2* values using the single exponential correction method are much closer to the R2* values of water from the dual exponential correction technique for low fat-fractions and gradually approach the R2* values of fat using the dual exponential correction method, as the fat-fraction increases from 11% to 52%. These results also suggest that R2* values of water and fat are not equal, and need to be estimated independently.
Figure 6.
Estimated R2* values from single T2* correction method (a) and the dual T2* correction method (b, c) at increasing SPIO concentrations and different fat-fractions. Error bars show the standard error of the mean. With the single T2* correction method, the estimated values of R2* increase as SPIO concentrations increase, and there is a strong dependence of the estimated R2* with fat-fraction. Using the dual T2* correction method, the R2* of water is more strongly affected by increasing concentrations of SPIO. Interestingly, there is relatively minimal dependence of the estimated R2* values on fat-fraction using the dual T2* method. These findings suggest that the dual T2* method more accurately reflects the signal behavior of the fat/water/SPIO phantom.
Discussion
Accurate quantification of fat requires correction for the differing T2* decay of water and fat. Simulations demonstrate that very large errors in the estimation of fat-fraction can occur using IOP imaging or three point methods that do not correct for T2* decay. IOP imaging produces negative apparent fat-fractions even at normal values of T2* (fat-fraction=−5%) and much larger errors with higher degrees of iron overload (fat-fraction=−30%). This phenomenon occurs because the in-phase image is acquired at a longer echo time, and therefore has more T2* weighting. In the absence of fat, a paradoxical value of fat-fraction that is less than zero will be calculated. Although correction for a single, shared value of T2* for water and fat improves errors in the apparent fat-fraction, large errors can occur when the T2* values of water and fat are different particularly at high fat-fractions and short T2* values.
Errors such as these are clinically relevant. Although the precise concentration of triglyceride that is considered abnormal is debated, it is generally thought that fat-fractions above approximately 5% are clinically important. In a large MR spectroscopy study performed by Szczepaniak et al28 in 2349 participants of the Dallas Heart Study, they defined a 95th percentile cutoff of 5.56% hepatic fat-fraction as abnormal, based on a subset of 345 patients with no identifiable risk factors for hepatic steatosis. Using this cutoff to distinguish normal from abnormal patients, it is clear that correction for T2* is essential for any MRI method attempting to quantify fat. This is particularly true for any method used for early detection of steatosis when fat is in low concentration.
In our phantom experiments, relatively large errors occur in the estimation of fat-fraction when no T2* correction is used. The single T2* correction method reduces the error, but relatively large errors still occur at higher SPIO concentrations when high levels of fat are also present. This occurs because the SPIOs shortens the T2* of water more than fat at higher iron concentrations, and the assumption that the signals from water and fat have similar decay rates breaks down. Only with an algorithm that allows for independent estimation and correction for T2* of water and fat can accurate estimates of fat-fraction be made in these situations.
The behavior of the estimated R2* from the phantom experiments explicitly demonstrates the differential effect of SPIO on the water and fat signals. This is clearly seen in the estimated R2* values of water and fat using the dual T2* method. This dependence is also seen indirectly with the single T2* method, where there is a strong dependence on the apparent R2* value, due to an averaging effect from water and fat, ie: one would expect that the estimated R2* using the single T2* method would be similar to that of water at low fat-fractions, and closer to the R2* of fat at higher fat-fractions. This behavior was seen and indicates that modeling of independent decay rates for water and fat will improve the accuracy of the signal model.
The differences in R2* between water and fat estimated using the dual T2* method indicate that SPIOs preferentially accelerate the signal decay of water more than that of fat. This effect may be caused by the fact that SPIOs are soluble in water and insoluble in fat, and therefore are more isolated from fat molecules than water. It is unknown whether this phantom accurately reflects the underlying microscopic relationship of water, fat and iron in an iron-overloaded, steatotic liver. Further work is needed to understand whether important differences in R2* between water and fat occur in vivo, similar to those seen in our phantom experiments.
There are important disadvantages of including independent correction of T2* of water and fat. The introduction of this additional degree of freedom dramatically increased the complexity of the estimation algorithm, including the need for constrained reconstruction methods to avoid instabilities at low (and high) fat-fractions. The computation of the matrix B and its pseudoinverse is computationally very expensive because B has 2N×7 elements (eg. 12×7=84 for 6 echoes) and for each iteration we must calculate all of the partial derivatives. In addition, the estimation of additional degrees of freedom is expected to degrade the noise performance of this method. Full evaluation of the noise performance of this method is involved and beyond the scope of the current work. Future work will focus on a full evaluation of the noise performance algorithm optimization.
In conclusion, non-invasive quantification of fat is needed for early detection and grading of fatty liver disease. T2* values of water and fat are independently estimated with our method using a modified Gauss-Newton method for multiple variables, relaxing the assumptions made by single exponential T2* correction methods, that assume a common value of T2* for both water and fat. Improved quantification of fat can be achieved using independent estimation of T2* values for water and fat. Future work will optimize the noise performance and investigate the performance and importance of this method for in vivo applications.
Acknowledgments
This project was supported in part by GE Healthcare, and the UW ICTR, funded through an NIH Clinical and Translational Science Award, grant number 1UL1RR025011. Scott B. Reeder is supported by an RSNA Scholar Grant.
APPENDIX A
The matrix B is a 2N x 7 matrix determined by the partial derivatives shown in Eqs. 6 and 7 calculated at different time points, tn:
| [A.1] |
Elements of this matrix must be calculated for each iteration. The partial derivatives contained in the elements of B are listed below:
| [A.2] |
| [A.3] |
| [A.4] |
| [A.5] |
| [A.6] |
| [A.7] |
| [A.8] |
| [A.9] |
| [A.10] |
| [A.11] |
| [A.12] |
| [A.13] |
| [A.14] |
| [A.15] |
References
- 1.Harrison SA, Neuschwander-Tetri BA. Nonalcoholic fatty liver disease and nonalcoholic steatohepatitis. Clin Liver Dis. 2004;8(4):861–879. ix. doi: 10.1016/j.cld.2004.06.008. [DOI] [PubMed] [Google Scholar]
- 2.Papandreou D, Rousso I, Mavromichalis I. Update on non-alcoholic fatty liver disease in children. Clin Nutr. 2007;26(4):409–415. doi: 10.1016/j.clnu.2007.02.002. [DOI] [PubMed] [Google Scholar]
- 3.Franzese A, Vajro P, Argenziano A, et al. Liver involvement in obese children. Ultrasonography and liver enzyme levels at diagnosis and during follow-up in an Italian population. Dig Dis Sci. 1997;42(7):1428–1432. doi: 10.1023/a:1018850223495. [DOI] [PubMed] [Google Scholar]
- 4.Tominaga K, Kurata JH, Chen YK, et al. Prevalence of fatty liver in Japanese children and relationship to obesity. An epidemiological ultrasonographic survey. Dig Dis Sci. 1995;40(9):2002–2009. doi: 10.1007/BF02208670. [DOI] [PubMed] [Google Scholar]
- 5.Reeder SB, Robson PM, Yu H, et al. Quantification of hepatic steatosis with MRI: the effects of accurate fat spectral modeling. J Magn Reson Imaging. 2009;29(6):1332–1339. doi: 10.1002/jmri.21751. [DOI] [PMC free article] [PubMed] [Google Scholar]
- 6.Hussain HK, Chenevert TL, Londy FJ, et al. Hepatic fat fraction: MR imaging for quantitative measurement and display--early experience. Radiology. 2005;237(3):1048–1055. doi: 10.1148/radiol.2373041639. [DOI] [PubMed] [Google Scholar]
- 7.Bydder M, Yokoo T, Hamilton G, et al. Relaxation effects in the quantification of fat using gradient echo imaging. Magn Reson Imaging. 2008;26(3):347–359. doi: 10.1016/j.mri.2007.08.012. [DOI] [PMC free article] [PubMed] [Google Scholar]
- 8.Kim H, Taksali SE, Dufour S, et al. Comparative MR study of hepatic fat quantification using single-voxel proton spectroscopy, two-point dixon and three-point IDEAL. Magn Reson Med. 2008;59(3):521–527. doi: 10.1002/mrm.21561. [DOI] [PMC free article] [PubMed] [Google Scholar]
- 9.Reeder SB, McKenzie CA, Pineda AR, et al. Water-fat separation with IDEAL gradient-echo imaging. J Magn Reson Imaging. 2007;25(3):644–652. doi: 10.1002/jmri.20831. [DOI] [PubMed] [Google Scholar]
- 10.Yokoo T, Bydder M, Hamilton G, et al. Nonalcoholic fatty liver disease: diagnostic and fat-grading accuracy of low-flip-angle multiecho gradient-recalled-echo MR imaging at 1.5 T. Radiology. 2009;251(1):67–76. doi: 10.1148/radiol.2511080666. [DOI] [PMC free article] [PubMed] [Google Scholar]
- 11.Reeder S, Hines C, Yu H, McKenzie C, Brittain J. On The Definition of Fat-Fraction for In Vivo Fat Quantification with Magnetic Resonance Imaging. Proceedings 17th Scientific Meeting, International Society for Magnetic Resonance in Medicine; 2009. p. 211. [Google Scholar]
- 12.Martin J, Sentis M, Puig J, et al. Comparison of in-phase and opposed-phase GRE and conventional SE MR pulse sequences in T1-weighted imaging of liver lesions. J Comput Assist Tomogr. 1996;20(6):890–897. doi: 10.1097/00004728-199611000-00005. [DOI] [PubMed] [Google Scholar]
- 13.Ma J. Breath-hold water and fat imaging using a dual-echo two-point Dixon technique with an efficient and robust phase-correction algorithm. Magn Reson Med. 2004;52(2):415–419. doi: 10.1002/mrm.20146. [DOI] [PubMed] [Google Scholar]
- 14.Xiang QS, An L. Water-fat imaging with direct phase encoding. J Magn Reson Imaging. 1997;7(6):1002–1015. doi: 10.1002/jmri.1880070612. [DOI] [PubMed] [Google Scholar]
- 15.Glover GH. Multipoint Dixon technique for water and fat proton and susceptibility imaging. J Magn Reson Imaging. 1991;1(5):521–530. doi: 10.1002/jmri.1880010504. [DOI] [PubMed] [Google Scholar]
- 16.Liu CY, McKenzie CA, Yu H, Brittain JH, Reeder SB. Fat quantification with IDEAL gradient echo imaging: correction of bias from T(1) and noise. Magn Reson Med. 2007;58(2):354–364. doi: 10.1002/mrm.21301. [DOI] [PubMed] [Google Scholar]
- 17.Yu H, Shimakawa A, McKenzie CA, Brodsky E, Brittain JH, Reeder SB. Multiecho water-fat separation and simultaneous R2* estimation with multifrequency fat spectrum modeling. Magn Reson Med. 2008;60(5):1122–1134. doi: 10.1002/mrm.21737. [DOI] [PMC free article] [PubMed] [Google Scholar]
- 18.George DK, Goldwurm S, MacDonald GA, et al. Increased hepatic iron concentration in nonalcoholic steatohepatitis is associated with increased fibrosis. Gastroenterology. 1998;114(2):311–318. doi: 10.1016/s0016-5085(98)70482-2. [DOI] [PubMed] [Google Scholar]
- 19.Moirand R, Mortaji AM, Loreal O, Paillard F, Brissot P, Deugnier Y. A new syndrome of liver iron overload with normal transferrin saturation. Lancet. 1997;349(9045):95–97. doi: 10.1016/S0140-6736(96)06034-5. [DOI] [PubMed] [Google Scholar]
- 20.Rossi C, Boss A, Haap M, Martirosian P, Claussen C, Schick F. Whole-body T2* mapping. Proceedings 16th Scientific Meeting, International Society for Magnetic Resonance in Medicine; 2008. p. 2714. [Google Scholar]
- 21.Wood JC, Enriquez C, Ghugre N, et al. MRI R2 and R2* mapping accurately estimates hepatic iron concentration in transfusion-dependent thalassemia and sickle cell disease patients. Blood. 2005;106(4):1460–1465. doi: 10.1182/blood-2004-10-3982. [DOI] [PMC free article] [PubMed] [Google Scholar]
- 22.Yu H, McKenzie CA, Shimakawa A, et al. Multiecho reconstruction for simultaneous water-fat decomposition and T2* estimation. J Magn Reson Imaging. 2007;26(4):1153–1161. doi: 10.1002/jmri.21090. [DOI] [PubMed] [Google Scholar]
- 23.Reeder SB, Wen Z, Yu H, et al. Multicoil Dixon chemical species separation with an iterative least-squares estimation method. Magn Reson Med. 2004;51(1):35–45. doi: 10.1002/mrm.10675. [DOI] [PubMed] [Google Scholar]
- 24.Yu H, Reeder SB, Shimakawa A, Brittain JH, Pelc NJ. Field map estimation with a region growing scheme for iterative 3-point water-fat decomposition. Magn Reson Med. 2005;54(4):1032–1039. doi: 10.1002/mrm.20654. [DOI] [PubMed] [Google Scholar]
- 25.Lustig M, Donoho D, Pauly JM. Sparse MRI: The application of compressed sensing for rapid MR imaging. Magn Reson Med. 2007;58(6):1182–1195. doi: 10.1002/mrm.21391. [DOI] [PubMed] [Google Scholar]
- 26.Block KT, Uecker M, Frahm J. Undersampled radial MRI with multiple coils. Iterative image reconstruction using a total variation constraint. Magn Reson Med. 2007;57(6):1086–1098. doi: 10.1002/mrm.21236. [DOI] [PubMed] [Google Scholar]
- 27.Hines C, Yu H, Shimakawa A, et al. Validation of Fat Quantification with T2* Correction and Accurate Spectral Modeling in a Novel Fat-Water-Iron Phantom. Proceedings 17th Scientific Meeting, International Society for Magnetic Resonance in Medicine; 2009. p. 2707. [Google Scholar]
- 28.Szczepaniak LS, Nurenberg P, Leonard D, et al. Magnetic resonance spectroscopy to measure hepatic triglyceride content: prevalence of hepatic steatosis in the general population. Am J Physiol Endocrinol Metab. 2005;288(2):E462–468. doi: 10.1152/ajpendo.00064.2004. [DOI] [PubMed] [Google Scholar]


