Abstract
Objective: Metabolic inhibition causes a decline in mechanical performance and, if prolonged, myocardial contracture and cell death. The decline in mechanical performance is mainly due to altered intracellular calcium handling, which is under control of the Na+/Ca2+-exchanger (NCX) The driving force of the NCX (ΔGncx) determines the activity of NCX. The aim of this study was to describe the relation between ΔGncx and calcium homeostasis during metabolic inhibition. Methods: In left ventricular rabbit myocytes, during metabolic inhibition (2 mmol/L sodium cyanide), sodium ([Na+]i), calcium ([Ca2+;]i), and action potentials were determined with SBFI, indo-1, and the patch clamp technique. Changes of ΔGncx were calculated. Results: During metabolic inhibition: The first 8 min [Na+]i remained constant, systolic calcium decreased from 532 ± 28 to 82 ± 13 nM, diastolic calcium decreased from 121 ± 12 to 36 ± 10 nM and the sarcoplasmic reticulum (SR) calcium content was depleted for 85 ± 3%. After 8 min [Na+;]i and diastolic calcium started to increase to 30 ± 1.3 mmol/L and 500 ± 31 nM after 30 min respectively. The action potential duration shortened biphasically. In the first 5 min it shortened from 225 ± 12 to 153 ± 11 ms and remained almost constant until it shortened again after 10 min. After 14 min action potential and calcium transients disappeared due to unexcitability of the myocytes. This resulted in an increased of the time average of ΔGncx from 6.2 ± 0.2 to 7.7 ± 0.3 kJ/mol during the first 3 min, where after it decreased and became negative after about 15 min. Conclusion: Metabolic inhibition caused an early increase of ΔGncx caused by shortening of the action potential. The increase of ΔGncx contributed to decrease of diastolic calcium, calcium transient amplitude, SR calcium content, and contractility. The increase of diastolic calcium started after ΔGncx became lower than under aerobic conditions.
Keywords: Na/Ca-exchanger, myocytes, calcium, sodium, action potential, metabolic inhibition, SR, driving force
Introduction
The sarcolemmal Na+/Ca2+-exchanger (NCX) is a passive ion transport mechanism, which directly couples transmembrane movements of Ca2+ to reciprocal movements of Na+ with a stoichiometric ratio of three sodium per calcium (Reeves and Hale, 1984). The direction of action (forward mode, Ca2+ efflux or reversed mode, Ca2+ influx) depends on the driving force of NCX (ΔGncx). A passive transporter such as NCX must be out of thermodynamic equilibrium in order to operate. This requires a non-zero driving force and the continuous input of metabolic energy. The energy required to maintain a non-equilibrium state is provided by the Na+/K+-ATPase, which channels metabolic energy derived from ATP hydrolysis into the trans-sarcolemmal electrochemical potential differences of sodium. Therefore, NCX is indirectly under thermodynamic control of myocardial metabolism and the phosphorylation potential, ΔGATP (Fiolet et al., 1984).
The ΔGncx can be calculated from the difference of three times the trans-sarcolemmal electrochemical potential of sodium and once that of calcium (Chapman et al., 1983; Fiolet et al., 1995). Thus, measurement of concentration gradients of the respective ions and membrane potential allows calculation of ΔGncx. Under physiological resting conditions in cardiac myocytes the reversal potential of NCX is about −20 mV. Therefore, at a resting membrane potential of −90 mV ΔGncx deviates 70 mV from thermodynamic equilibrium, corresponding to a free energy of about 7 kJ/mol (Bers et al., 1988; Barry and Bridge, 1993). This favors transport of calcium coupled to inward transport of sodium. However, in dynamic conditions, such as during electrical stimulation, ΔGncx continuously changes due to changes of membrane potential and [Ca2+]i and even operates in reversed mode (calcium influx) for a short period after the upstroke of the action potential (Despa et al., 2002; Baartscheer et al., 2003a). Nevertheless, it is unanimously agreed that the NCX is the main pathway for Ca2+ extrusion from ventricular myocytes (Noble et al., 1991; Egger and Niggli, 1999; Bers, 2001; Weber et al., 2002) and contributes to contraction by regulating the overall calcium balance (Mullins, 1979; Barry and Bridge, 1993).
In pathophysiological conditions in which myocardial metabolism is disturbed, such as ischemia and anoxia, ΔGncx must adapt to reduced metabolic energy derived from ATP hydrolysis (ΔGATP), which influence [Ca2+]i homeostasis and contractility (Fiolet et al., 1984; Baartscheer et al., 2003b). Indeed, It has been shown that during metabolic inhibition ΔGncx is shifted toward more reversed and less forward mode resulting in an increase of [Ca2+]i (Boston et al., 1998; Sugishita et al., 2001; Ju and Allen, 2005; Barry et al., 2009).
However, little is known about the time course of change of ΔGncx during metabolic inhibition. Therefore, the aim of the study is to establish (1) how altered [Na+]i, [Ca2+]i, and action potential configuration during metabolic inhibition modify ΔGncx and (2) how this influence calcium handling.
Materials and Methods
Animal care and handling conformed to Guide for the Care and Use of Laboratory Animals published by the US National Institutes of Health (NIH Publication No. 85-23, revised 1996) and the study was approved by the local ethical committee.
Isolation of left midmural ventricular myocytes
Midmural left ventricular myocytes were isolated (5 rabbits, 20 myocytes for each experimental condition) as described previously (Ter Welle et al., 1988) and stored until use, at room temperature in separate vials, each containing about 105 myocytes in 5 mL Hepes solution containing (mmol/L): [Na+] 156, [K+] 4.7, [Ca2+] 2.6, [Mg2+] 2.0, [Cl−] 150.6, 4.3, 1.4, [Hepes] 17, [Glucose] 11 supplied with 1% fatty acid free albumin (pH 7.3).
Measurement of free cytosolic [Ca2+]i, [Na2+]i, and transmembrane potentials
Before each individual experiment, cells were loaded during 30 min with 5 μmol/L indo-1/AM or 120 min with 10 μmol/L SBFI, washed twice with fresh Hepes solution (without albumin), and kept for another 15 min to ensure complete de-esterification. Hardware for data recording consisted of a patch clamp amplifier (Axopatch 200B), two home made differential amplifiers for photomultiplier signals and a combined A/D and D/A board (DAS1802AO, Keithley Metrabyte) controlled by custom made software (Test-point).
Loaded myocytes were placed in a thermally controlled (37°C) cell chamber on the stage of an inverted fluorescence microscope (Nikon Diaphot) and superfused with Hepes solution (without albumin) at a rate of 1–2 mL/min. A quiescent rod-shaped myocyte was selected. Action potentials were recorded using the perforated patch clamp technique with a pipette solution containing (mmol/L): [Na+] 6, [K+] 140, [Mg2+] 1.0, [Cl−] 153.6, 1.4, [Hepes] 17, [Glucose] 11, [Ca2+] 2.6, and 0.2 mg/mL amphotericin B (pH 7.1). Pipette resistance was 3–5 MΩ. The potential to bath solution was adjusted to zero. Capacitance and the pipette series resistance were compensated to about 80%. Access resistance to the cell decreased within 10 min after seal formation. Dual wavelength emission fluorescence of Indo-1 was recorded (410/516 nm, excitation at 340 nm) simultaneously with action potential recordings. Free cellular calcium ([Ca2+]i) and total cytoplasmic buffered calcium was calculated as described previously (Baartscheer et al., 1996, 2003b). Fluorescence and action potential signals were digitized at 1 kHz.
In separate experiments, using 2 Hz field stimulation, dual wavelength emission of SBFI was recorded (410/590 nm, excitation at 340 nm) without measurements of action potentials, and [Na+]i was calculated and calibrated as described previously (Baartscheer et al., 1997).
The increase of [Ca2+]i upon rapid cooling (RC) was used to estimate sarcoplasmic reticulum (SR) calcium content. RC causes complete depletion of calcium from SR and calcium released remains confined to the cytoplasm (Bers, 1987). RC was performed by rapid superfusion with ice-cold Tyrode's solution of the same composition; low temperature (0–1°C) was reached within 200 ms. Application of RC implies the end of an experiment.
Aerobic metabolism was blocked by 2 mmol/L sodium cyanide and glucose was omitted from the perfusion solution After a control period of 5 min (2 Hz, 37°C).
Formulation and calculation of ΔGncx
In each myocyte, in which action potential and [Ca2+]i were measured, ΔGncx was calculated using the equation given below. The value of [Na+]i used to calculate ΔGncx was the average of four myocytes per heart.
In which Vm is membrane potential, F the Faraday constant and R and T have their usual meaning. In this study positive values of ΔGexch correspond to driving force in forward mode (inward sodium transport) and negative values to reversed mode (outward sodium transport) respectively.
Statistics
Data are expressed as mean ± SEM for five rabbits (20 myocytes) four myocytes per heart. One way ANOVA (with a post hoc test according to Student–Newman–Keuls) at a level of significance of p < 0.05.
Results
[Na2+]i, [Ca2+]i, and transmembrane potentials
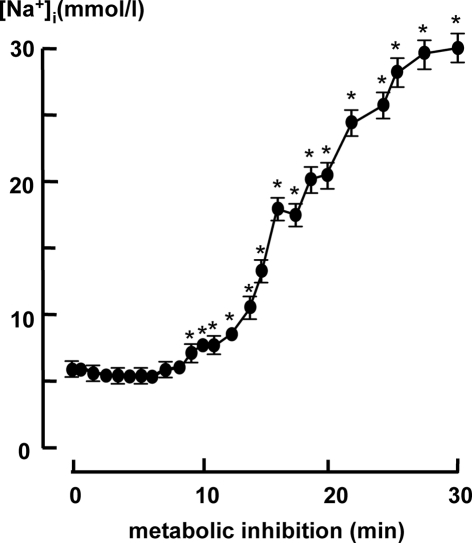
[Na+]i did not show cycle related fluctuations. Figure 1 summarizes the average [Na+]i as a function of the duration of metabolic inhibition in 2 Hz stimulated myocytes (n = 20). The first 8 min of metabolic inhibition [Na+]i remained constant at a value of 6.4 mmol/L, thereafter [Na+]i started to increase to 30 ± 1.3 mmol/L after 30 min of metabolic inhibition.
Figure 1.
Cytosolic [Na+]i in 2 Hz stimulated myocytes (n = 20) during metabolic inhibition. All data expressed as mean ± SEM. *p < 0.05 versus Ctrl (t = 0; one way ANOVA).
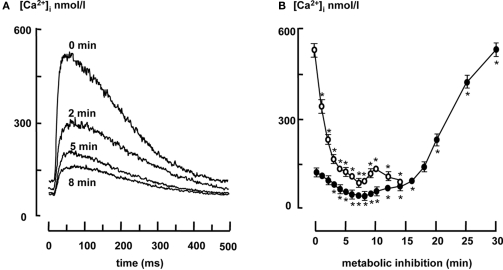
[Ca2+]i transients decreased upon metabolic inhibition. This is shown in Figure 2A, which shows typical examples of [Ca2+]i transients in 2 Hz stimulated myocytes under aerobic condition (t = 0) and 2, 5, 8, and 10 min after metabolic inhibition. Data are summarized in Figure 2B, which shows that diastolic [Ca2+]i decreased upon metabolic inhibition from 121 ± 12 to 36 ± 10 nmol/L until it started to rise after 8 min, exceeding 500 nmol/L after 30 min. The increase of diastolic calcium is associated with development of contracture, when diastolic calcium reached values above the values under aerobic conditions (16.3 ± 0.5 min after the onset of metabolic inhibition). Systolic calcium decreased from 532 ± 28 to 82 ± 13 nM within 8 min, followed by a small increase to 152 nM after 10 min and equaled diastolic Ca2+ when myocytes became inexcitable after 15 min.
Figure 2.
(A) Representative examples of [Ca2+]i transients under aerobic conditions (t = 0) and after 2, 5, and 8 min of metabolic inhibition. (B) Systolic (open circles) and diastolic [Ca2+]i (closed circles) in 2 Hz stimulated myocytes (n = 20) during metabolic inhibition. All data expressed as mean ± SEM. *p < 0.05 versus Ctrl (t = 0; one way ANOVA).
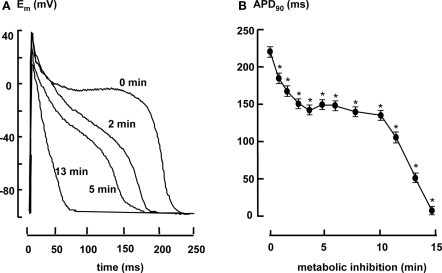
Figure 3A shows typical examples of action potentials under aerobic condition (t = 0) and 2, 5, and 13 min after aerobic metabolic inhibition. Figure 3B shows the average time course of APD90 (action potential duration at 90% repolarization). APD90 shortened biphasically. In the first 5 min of aerobic metabolic inhibition APD90 shortened from 225 ± 12 to 153 ± 11 ms and remained constant until it shortened after 10 min and the myocytes became inexcitable.
Figure 3.
(A) Representative examples of action potentials under aerobic conditions (t = 0) and after 2, 5, and 13 min of metabolic inhibition. (B) Action potential duration in 2 Hz stimulated myocytes (n = 20) measured at 90% repolarization (APD90) during metabolic inhibition. All data expressed as mean ± SEM. *p < 0.05 versus Ctrl (t = 0; one way ANOVA).
The driving force of the Na+/Ca2+-exchanger
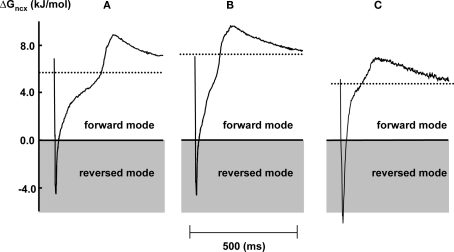
The dynamic change of ΔGncx during the cardiac cycle was calculated from [Na+]i, [Ca2+]i, and the transmembrane potential in each individual myocytes with a sample frequency of 1 kHz. Figure 4 shows representative examples of ΔGncx profiles in a steady state 2 Hz stimulated myocytes under aerobic condition (Figure 4A) and after 2 and 10 min of metabolic inhibition (Figures 4B,C respectively). Upon depolarization ΔGncx shifted for a very short period from forward mode (Na+ influx, Ca2+ efflux) toward reversed mode (Na+ efflux, Ca2+ influx), followed by a recovery phase toward forward mode values due to decrease of the calcium transient amplitude and repolarization. In all conditions ΔGncx was more positive upon repolarization compared to diastole, due to the difference between action potential and calcium transient duration. After 2 min of metabolic inhibition the recovery phase toward forward mode of NCX was faster due to shortening of the action potential duration. This resulted in a more positive time average of ΔGncx (dotted lines) of 7.7 ± 0.3 kJ/mol compared to 6.2 ± 0.2 before metabolic inhibition. Time average ΔGncx is the average of calculated ΔGncx for each sample point during the entire cardiac cycle. After 10 min of metabolic inhibition the recovery phase toward forward mode of NCX further fastened due to further shortening of the action potential duration. However, ΔGncx shifted toward reversed mode due an increase of [Na+]i, in and a decrease of [Ca2+]i. Resulting in a lower time average ΔGncx of 3.9 ± 0.2 kJ/mol.
Figure 4.
Representative examples of the dynamic change of ΔGncx in 2 Hz stimulated myocytes during one stimulation cycle, under aerobic condition (A) and after 2 (B) and 10 (C) min of metabolic inhibition. The dotted area corresponds to reversed mode operation of NCX. The dotted lines represent time averaged ΔGncx over one stimulation cycle.
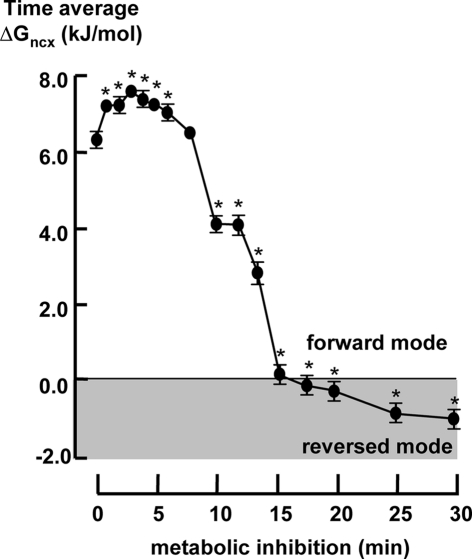
Figure 5 shows the time course of the time averaged of ΔGncx during metabolic inhibition. The time averaged of ΔGncx increased during the first 3 min of metabolic inhibition followed by a gradual decrease toward 0 kJ/mol after about 15 min. Time averaged of ΔGncx reached the same value as under aerobic condition after about 7 min of metabolic inhibition. After 15 min it further decline to −1.2 ± 0.3 kJ/mol after 30 min.
Figure 5.
The time averaged ΔGexch in 2 Hz stimulated myocytes (n = 20) during metabolic inhibition. All data expressed as mean ± SEM. *p < 0.05 versus Ctrl (t = 0; one way ANOVA).
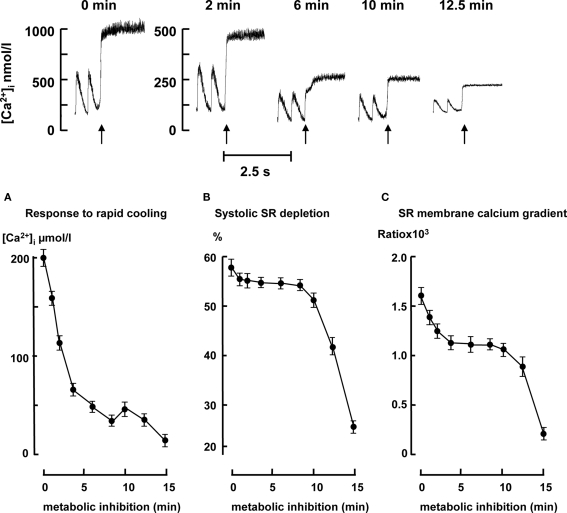
Figure 6 top panel shows typical example of the increase of cytosolic free calcium upon RC just before (t = 0) and during metabolic inhibition (t = 2, 6, 10, and 12, 5 min). The amplitude of increase of total [Ca2+] upon RC during metabolic inhibition decreased from 200 ± 9 to 35 ± 5 μmol/L within the 8-min followed by a small increase until it further decreased after 10 min (Figure 6A). Figure 6B shows the degree to which SR becomes depleted during systole (ratio of the calcium transient amplitude and SR calcium content expressed as the change of total calcium). In the first 10 min of metabolic inhibition a small decline of the SR depletion upon electrical stimulation was observed followed by a large decrease after around 10 min. Figure 6C shows the ratio of the estimate of SR calcium content and diastolic calcium. This is a measure of the calcium gradient across the SR membrane during diastole. The calcium gradient across the SR decreased until it reached a new steady state after 5 min of metabolic inhibition. After 10 min the gradient decreased further to almost zero after 15 min.
Figure 6.
Top panel: representative examples of the increase of [Ca2⩲]i upon rapid cooling (RC) in 2 Hz stimulated myocytes just before metabolic inhibition (t = 0) and 2, 6, 10, and 12. 5 min after metabolic inhibition. Bottom panel: SR calcium content, systolic SR depletion, and SR membrane calcium gradient during metabolic inhibition in 2 Hz stimulated myocytes (n = 10 for each time point). (A) SR calcium content is expressed as the change of cytosolic total calcium (μmol/L) in response to RC. (B) The degree to which SR became depleted during systole (ratio of the calcium transient amplitude expressed as total calcium and SR calcium content. (C) Ratio of SR calcium content and diastolic calcium. All data expressed as mean ± SEM. *p < 0.05 versus Ctrl (t = 0; one way ANOVA).
Discussion
This study quantifies the relation between metabolic inhibition in rabbit left ventricular myocytes and changes of the driving force of NCX (ΔGncx) and calcium handling. We demonstrate that during the first minutes of metabolic inhibition ΔGncx is shifted to more positive values due to shortening of the action potential associated with an increased calcium efflux. After the initial rise ΔGncx collapsed, resulting in an increase of diastolic [Ca2+]i and contracture of the myocytes.
The ΔGncx depends on [Na+]i, [Ca2+]i, and membrane potential (Despa et al., 2002; Baartscheer et al., 2003a). Under aerobic condition in we found that ΔGncx deviated 70 mV (around 7 kJ/mol) from thermodynamic equilibrium (Figure 4), which favors outward transport of calcium coupled to inward transport of sodium. This value is in agreement with measurements of −20 mV of the reversal potential of NCX (Bers et al., 1988; Barry and Bridge, 1993) at a resting membrane potential of −90 mV. The time courses of [Na+]i [Ca2+]i, and membrane potential upon metabolic inhibition resulted in a transient increase of ΔGncx followed by a decrease and became negative (reversed mode: Ca2+ influx) after about 16 min (Figure 5). The initial increase of ΔGncx can be explained by shortening of the action potential most likely due to opening of the K-ATP channels (Elliott et al., 1989; Shigematsu and Arita, 1997) where as the decline of ΔGncx is caused by a decrease of the calcium transient and increase of [Na+]i.
It is generally accepted that NCX regulates the overall calcium balance in myocytes (Noble et al., 1991; Egger and Niggli, 1999; Bers, 2001; Weber et al., 2002) and that ΔGncx largely determines activity of NCX (Baartscheer et al., 1998). Therefore, it is expected that diastolic [Ca2+]i follows the time course of ΔGncx. Indeed, the increase of ΔGncx (increased forward mode and Ca2+-efflux) is related to a decrease of diastolic [Ca2+]i. Diastolic [Ca2+]i started to increase when ΔGncx became lower compared to values before metabolic inhibition (decreased forward mode and Ca2+-efflux). The increase of diastolic [Ca2+]i accelerated at the moment ΔGncx became negative (reversed mode NCX, calcium influx) and is associated with development of contracture.
In the first minutes of metabolic inhibition and anoxia contractility rapidly declines accompanied by a small fall of ΔGATP (Elliott et al., 1989). This is in agreement with the rapid reduction in calcium transient amplitude and SR calcium content in our experiments. The SR Ca2+-ATPase is directly under thermodynamic control of myocardial metabolism and ΔGATP, and therefore a fall in ΔGATP results in a fall of the calcium gradient across the SR membrane and as a consequence a fall in SR calcium content, calcium transient amplitude, and contractility. The discrepancy of the rapid decline of the calcium transient and a fall of ΔGATP was attributed to altered excitation–contraction coupling due to the shortening of the action potential (Stern et al., 1988). However, contribution of action potential shortening on ΔGncx and thus on calcium handling was never considered. We demonstrate that in the first minutes of metabolic inhibition action potential shortening resulted in an increase of ΔGncx and a threefold reduction of diastolic [Ca2+]i. We also demonstrate that in the first minutes of metabolic inhibition the calcium gradient across the SR membrane was only reduced by 25% (Figure 6C) where both SR calcium content (Figure 6A) and calcium transient amplitude (Figure 2B) were reduced by 75 and 85% respectively. In addition, the systolic SR depletion upon electrical stimulation was only reduced by 4% (Figure 6B), suggesting that excitation–contraction was hardly changed. From these result we conclude that increased ΔGncx, increased forward mode (calcium efflux) activity of NCX causes increased calcium efflux. Because SERCA function is reduced during metabolic inhibition due to a lower ΔGATP the SR calcium release is not balanced by SR calcium uptake. This unbalanced calcium is transported out of the cell by the increased forward mode of NCX and causes a decrease of the SR calcium content and reduction in contractility. In addition, diastolic calcium set maximal SR calcium load at a given ΔGATP. The shift toward more forward mode NCX during the first minutes of metabolic inhibition resulted in a decrease of diastolic [Ca2+]i (Figure 2) and as a consequence contributes to a decline of SR Ca2+ content, calcium transient amplitude, and contractility.
An alternative mechanism, by which diastolic [Ca2+]i is initially decreased could be reduced influx of calcium. The main candidate for such a mechanism is L-type calcium channel. Indeed, it has been shown that the open probability of the L-type calcium channel is reduced during metabolic inhibition (Chantawansri et al., 2008). However, Zahradniková et al. (2007) have shown that short depolarization (as during short action potential durations) can increase the gain of EC coupling. This results in a larger electrochemical potential of Ca2+ during opening of the channels resulting in the same influx of calcium although open probability is decreased. This explanation is in agreement with our observation that calcium influx via L-type calcium channels to trigger SR calcium release is hardly changed as shown by the unchanged relative systolic SR depletion during the first minutes of metabolic inhibition (Figure 6B). In addition, the rate of inactivation of L-type calcium channels is enhanced by increasing release of calcium from SR (Altamirano and Bers, 2007). The latter however is reduced after of metabolic inhibition. Another possibility is that during metabolic inhibition the function of the RyR-channels is altered resulting in the same fractional release by a lower L-type calcium channel current. However, SR calcium content, diastolic calcium, and the phosphorylation state of the RyR-channels are decreased in the first phase after metabolic inhibition. All these changes results in a decrease of the open probability of the RyR-channels. Therefore, we do not think that reduced calcium influx plays a role by decreasing the diastolic [Ca2+]i.
Limitations of the study
We used bulk cytosolic [Na+]i and [Ca2+]i data to calculate ΔGexch. It may be argued that the actual driving force of NCX could deviate from calculated ΔGexch due to the existence of sub-sarcolemmal gradients of these ions. So far, there is few data on the actual magnitude of sub-sarcolemmal sodium and the quantitative importance is disputed. The existence of sub-sarcolemmal calcium gradients has been demonstrated using optical (Etter et al., 1997) and electrophysiological (Trafford et al., 1995) techniques; estimates for maximal systolic sub-sarcolemmal [Ca2+]i were up to four times bulk values (Trafford et al., 1995). Although “fuzzy” space effects would thus affect our calculations quantitatively, this is not necessarily so qualitatively.
We conclude that blockade of aerobic metabolism caused an early temporal increase of calcium efflux due to increased activity of the forward mode of NCX (increase of ΔGncx) due to shortening of the action potential. This resulted in a decrease of diastolic calcium, which contributed to the early decline of the calcium transient, SR calcium content, and contractile performance. Intracellular calcium started to increase after ΔGncx becomes lower compared to the value under aerobic conditions and this increase started to accelerated after ΔGncx became negative (reversed mode NCX) and is associated wit development of contracture. Overall we conclude that ΔGncx also regulates the calcium balance under pathological conditions.
Conflict of Interest Statement
The authors declare that the research was conducted in the absence of any commercial or financial relationships that could be construed as a potential conflict of interest.
References
- Altamirano J., Bers D. M. (2007). Effect of intracellular Ca2+ and action potential duration on L-type Ca2+ channel inactivation and recovery from inactivation in rabbit cardiac myocytes. Am. J. Physiol. 293, H563–H573 [DOI] [PubMed] [Google Scholar]
- Baartscheer A., Schumacher C. A., Belterman C. N. W., Coronel R., Fiolet J. W. T. (2003a). [Na+]i and the driving force of the Na+/Ca2+-exchanger in heart failure. Cardiovasc. Res. 57, 986–995 10.1016/S0008-6363(02)00854-4 [DOI] [PubMed] [Google Scholar]
- Baartscheer A., Schumacher C. A., Belterman C. N. W., Coronel R., Fiolet J. W. T. (2003b). SR calcium handling and calcium after-transients in a rabbit model of heart failure. Cardiovasc. Res. 58, 99–108 10.1016/S0008-6363(02)00854-4 [DOI] [PubMed] [Google Scholar]
- Baartscheer A., Schumacher C. A., Fiolet J. W. T. (1997). Small changes of cytosolic sodium in rat ventricular myocytes measured with SBFI in emission ratio mode. J. Mol. Cell. Cardiol. 29, 3375–3383 [DOI] [PubMed] [Google Scholar]
- Baartscheer A., Schumacher C. A., Fiolet J. W. T. (1998). Cytoplasmic sodium, calcium and free energy change of the Na+/Ca2+-exchanger in rat ventricular myocytes. J. Mol. Cell. Cardiol. 30, 2437–2447 [DOI] [PubMed] [Google Scholar]
- Baartscheer A., Schumacher C. A., Opthof T., Fiolet J. W. T. (1996). The origin of increased cytoplasmic calcium upon reversal of the Na+/Ca2+-exchanger in isolated rat ventricular myocytes. J. Mol. Cell. Cardiol. 28, 1963–1996 [DOI] [PubMed] [Google Scholar]
- Barry H. W., Bridge J. H. B. (1993). Intracellular calcium homeostasis in cardiac myocytes. Circulation 87, 1806–1815 [DOI] [PubMed] [Google Scholar]
- Barry H. W., Zhang X. Q., Halkos M. E., Vinten-Johansen J., Saegusa N., Spitzer K. W., Matsuoka N., Sheets M., Rao N. V., Kennedy T. P. (2009). Nonanticoagulant heparin reduces myocyte Na+ and Ca2+ loading during simulated ischemia and decreases reperfusion injury. Am. J. Physiol. 298, H102–H111 [DOI] [PMC free article] [PubMed] [Google Scholar]
- Bers D. M. (1987). Ryanodine and the calcium content of cardiac SR assessed by caffeine and rapid cooling contracture. Am. J. Physiol. 253, C408–C411 [DOI] [PubMed] [Google Scholar]
- Bers D. M. (2001). Excitation–Contraction Coupling and Cardiac Contractile Force, 2 Edn Dordrecht: Kluwer Academic Publishers [Google Scholar]
- Bers D. M., Christensen D. M., Nguyen T. X. (1988). Can Ca entry via Na-Ca-exchange directly activate muscle contraction. J. Mol. Cell. Cardiol. 20, 233–255 [DOI] [PubMed] [Google Scholar]
- Boston D. R., Koyama T., Rodriguez-Larrain J., Zou A., Barry W. H. (1998). Effects of angiotensin II on intracellular calcium and contracture in metabolically inhibited cardiomyocytes. J. Pharmacol. Exp. Ther. 285, 716–723 [PubMed] [Google Scholar]
- Chantawansri C., Huynh N., Yamanaka J., Garfinkel A., Lamp S. T., Inoue M., Bridge J. H. B., Goldhaber J. I. (2008). Effect of metabolic inhibition on couplon behavior in rabbit ventricular myocytes. Biophys. J. 94, 1656–1666 [DOI] [PMC free article] [PubMed] [Google Scholar]
- Chapman R. A., McGuican J. A. S., Coray A. (1983). Sodium/calcium exchange in mammalian ventricular muscle: a study with sodium sensitive micro-electrodes. J. Physiol. 343, 253–276 [DOI] [PMC free article] [PubMed] [Google Scholar]
- Despa S., Mohammed A. I., Christopher R. W., Pogwizd S. M., Bers D. M. (2002). Intracellular Na+ concentration is elevated in heart failure but Na/K pump function is unchanged. Circulation 105, 2543–2548 10.1161/01.CIR.0000016701.85760.97 [DOI] [PubMed] [Google Scholar]
- Egger M., Niggli E. (1999). Regulatory function of Na–Ca exchange in the heart: milestones and outlook. J. Membr. Biol. 168, 107–130 [DOI] [PubMed] [Google Scholar]
- Elliott A. C., Smith G. L., Allen D. G. (1989). Simultaneous measurements of action potential duration and intracellular ATP in isolated ferret heart exposed to cyanide. Circ. Res. 64, 583–591 [DOI] [PubMed] [Google Scholar]
- Etter E. F., Kuhn M. A., Fay F. S. (1997). Detection of changes near-membrane Ca2+ concentration using novel membrane-associated Ca2+ indicators. J. Biol. Chem. 269, 1041–1049 [PubMed] [Google Scholar]
- Fiolet J. W. T., Baartscheer A., Schumacher C. A. (1984). The change of the free of ATP hydrolysis during global ischemia and anoxia in the rat heart. Its possible role in regulation of transsarcolemmal sodium and potassium gradient. J. Mol. Cell. Cardiol. 23, 735–748 [DOI] [PubMed] [Google Scholar]
- Fiolet J. W. T., Baartscheer A., Schumacher C. A. (1995). Intracellular [Ca2+] and vO2 after manipulation of the free-energy of the Na+/Ca2+-exchanger in isolated ventricular myocytes. J. Mol. Cell. Cardiol. 27, 1513–1525 [DOI] [PubMed] [Google Scholar]
- Ju Y. K., Allen D. G. (2005). Cyanide inhibits the Na+/Ca2+ exchanger in isolated cardiac pacemaker cells of the cane toad. Pflugers Arch. 449, 442–448 10.1007/s00424-004-1334-x [DOI] [PubMed] [Google Scholar]
- Mullins L. J. (1979). The generation of electrical currents in cardiac fibers by Na/Ca-exchange. Am. J. Physiol. 236, 103–110 [DOI] [PubMed] [Google Scholar]
- Noble D., Noble S. J., Bett G. C. L., Earm Y. E., Ho W. K., So I. K. (1991). The role of sodium–calcium exchange during the cardiac action potential. Ann. N. Y. Acad. Sci. 1639, 334–353 [DOI] [PubMed] [Google Scholar]
- Reeves J. P., Hale C. C. (1984). The stoicheometry of the cardiac sodium-calcium exchange system. J. Biol. Chem. 259, 7733–7739 [PubMed] [Google Scholar]
- Shigematsu S., Arita M. (1997). Anoxia-induced activation of ATP-sensitive K+ channels in guinea pig ventricular cells and its modulation by glycolysis. Cardiovasc. Res. 35, 273–282 [DOI] [PubMed] [Google Scholar]
- Stern M. D., Silverman H. S., Houser S. R., Josephson R. A., Capogrossi M. C., Nichols C. G., Lederer W. J., Lakatta E. G. (1988). Anoxic contractile failure in rat heart myocytes is caused by failure of intracellular calcium release due to alteration of the action potential. Proc. Natl. Acad. Sci. U.S.A. 85, 6954–6958 [DOI] [PMC free article] [PubMed] [Google Scholar]
- Sugishita K., Su Z., Li F., Philipson K. D., Barry H. W. (2001). Gender Influences [Ca2+]i During metabolic inhibition in myocytes overexpressing the Na(+)-Ca(2+) exchanger. Circulation 104, 2101–2106 10.1161/hc4001.097038 [DOI] [PubMed] [Google Scholar]
- Ter Welle H. F., Baartscheer A., Fiolet J. W. T., Schumacher C. A. (1988). The cytoplasmic free energy of ATP hydrolysis in isolated rod-shaped rat myocytes. J. Mol. Cell. Cardiol. 20, 435–441 [DOI] [PubMed] [Google Scholar]
- Trafford A. W., Díaz M. E., O'Neil S. C., Eisner D. A. (1995). Comparison of subsarcolemmal and bulk calcium concentration during spontaneous calcium release in rat ventricular myocytes. J. Physiol. 488, 577–586 [DOI] [PMC free article] [PubMed] [Google Scholar]
- Weber C. R., Piacentino V., Ginsburg K. S., Houser S. R., Bers D. M. (2002). Na+–Ca2+ exchange current and submembrane [Ca2+] during the cardiac action potential. Circ. Res. 90, 182–189 [DOI] [PubMed] [Google Scholar]
- Zahradníková A., Jr., Poláková E., Zahradník I., Zahradníková A. (2007). Kinetics of calcium spikes in rat cardiac myocytes. J. Physiol. 578, 677–691 10.1113/jphysiol.2006.117796 [DOI] [PMC free article] [PubMed] [Google Scholar]


