

Abstract
Tumors whose primary site is challenging to diagnose represent a considerable proportion of new cancer cases. We present validation study results for a gene expression-based diagnostic test (the Pathwork Tissue of Origin Test) that aids in determining the tissue of origin using formalin-fixed, paraffin-embedded (FFPE) specimens. Microarray data files were generated for 462 metastatic, poorly differentiated, or undifferentiated FFPE tumor specimens, all of which had a reference diagnosis. The reference diagnoses were masked, and the microarray data files were analyzed using a 2000-gene classification model. The algorithm quantifies the similarity between RNA expression patterns of the study specimens and the 15 tissues on the test panel. Among the 462 specimens, overall agreement with the reference diagnosis was 89% (95% CI, 85% to 91%). In addition to the positive test results (ie, rule-ins), an average of 12 tissues for each specimen could be ruled out with >99% probability. The large size of this study increases confidence in the test results. A multisite reproducibility study showed 89.3% concordance between laboratories. The Tissue of Origin Test makes the benefits of microarray-based gene expression tests for tumor diagnosis available for use with the most common type of histology specimen (ie, FFPE).
Tumors whose primary site is challenging to diagnose represent 3% to 5% of all new cancer cases.1 Pathologists and oncologists undertake exhaustive determination of tissue of origin in clinicopathologically ambiguous tumor tissues, often at considerable cost. Immunohistochemistry (IHC) panels, serum markers, imaging tests, and other assays are used, because most oncology treatments are predicated on known primary cancers, as are indications for anticancer drugs, reimbursement policies,2 and entry criteria for clinical trials. For most oncologists, the primary site is the starting point for standard-of-care patient management. Studies have associated improved survival with institution of tumor-specific therapy in those cases where the primary site was eventually identified.3,4 It is this expectation of improved outcome with tumor-specific therapy that motivates the search for the primary site in clinical practice today, and the search has recently intensified, with new targeted drugs introduced as therapy for specific indicated tumor tissue types.2,5 In addition, a definitive primary site relieves patient anxiety over uncertain diagnosis.
Although IHC staining can often narrow the range of diagnostic possibilities6–8 or discriminate among two or three tissue types,9,10 such panels often lack the combination of range, sensitivity, and specificity needed for unequivocal identification of the primary site of origin, particularly if a wide range of possible primary sites must be considered.7,11–13 Selection and use of IHC stains also tend to differ from institution to institution. Furthermore, interpretation and reporting of IHC results remain highly subjective. A recent meta-analysis of four large studies, in which pathologists were blinded to knowledge of the primary site and clinical data, showed that IHC correctly identified the primary site in only 66% (95% CI = 60% to 71%) of metastatic cancers.14 In patients who present initially with a primary cancer of uncertain origin, a primary site is eventually identified in <30%.6
Recently, gene expression tests have been developed as an adjunct to morphological evaluation and IHC analysis in the evaluation of patients with uncertain primary cancer. Most of these molecular profiling assays use microarrays or RT-PCR to quantify mRNA or microRNA.4,15–27 The microarray-based assays are capable of measuring the expression levels of thousands of gene markers, whereas the RT-PCR–based assays focus on a smaller subset of 10 to 100 gene markers. Although the design, development, and performance characteristics of these expression tests vary, overall accuracy in identifying the source of poorly differentiated lesions from known primary cancers has been in the range of 75% to 89%.
In the largest study to date, a microarray-based expression test validated on 547 snap-frozen specimens had 88% accuracy in identifying the tissue of origin,21 and the assay delivered reproducible results (94% concordance) in different laboratory settings.18 This evidence of robust microarray performance across a wide range of poorly differentiated tissues is supported by statistical analyses suggesting that for highly dimensional cancer classification problems (eg, when choosing a single tissue type from more than a dozen possible types), the optimal number of gene expression markers is >1000 genes (Buturovic LJ: On the optimal number of gene expression markers for tissue of origin cancer diagnostics. Poster presented at: Annual Meeting for the American Association for Cancer Research; September 17–20, 2007; Atlanta, GA; B4).22,28
Although both statistical theory and validation data support use of microarrays for primary tumor site classification, array technologies have traditionally required large amounts of fresh or frozen tissue, which is impractical for routine clinical use. Until recently, the degraded RNA typically found in formalin-fixed paraffin-embedded (FFPE) tissue had been considered unsuitable for microarray analysis. Nucleic acids are well known to undergo chemical degradation, fragmentation, cross-linking with proteins, and methylation (especially of poly-A tails) during fixation and storage.29–37
In recent years, however, the assumption that FFPE specimens cannot provide adequate RNA for meaningful microarray analysis has been reconsidered.38–40 Several studies have now documented that microarray tests can be performed on FFPE specimens, not only for measurement of short noncoding microRNAs,41–43 but also for simultaneous quantification of the hundreds of thousands of diverse mRNA transcripts that cumulatively represent the full picture of genome-wide expression.26,44–49
The Pathwork Tissue of Origin Test (Pathwork Diagnostics, Redwood City, CA) is a microarray-based gene expression test that compares the RNA profile of a tumor FFPE specimen to established RNA profiles of 15 known tissues. The test measures the degree of similarity between the expression patterns of the tumor and those of a panel of 15 different tissue types. The tumor tissue types represented are bladder, breast, colorectal, gastric, hepatocellular, kidney, non–small cell lung, ovarian, pancreatic, prostate, thyroid carcinomas, melanoma, testicular germ cell tumor, non-Hodgkin's lymphoma, and sarcoma. For each specimen, the test produces 15 separate Similarity Scores (SS), one for each tissue type on the panel. A Tissue of Origin Test report with these results is provided to the oncologist and pathologist, and is intended to be used in the context of the patient's history and other test results.
Here we present results from a multicenter clinical validation study and an interlaboratory reproducibility study of the Pathwork Tissue of Origin Test for FFPE, a microarray-based gene expression test cleared by the Food and Drug Administration that uses a 2000-gene profile for identifying a tumor's tissue of origin in FFPE samples. Although the panel of tumor tissues classified by this test is the same as the panel for the previously published Tissue of Origin Test for frozen specimens,21 the algorithms used and the processing methods are different, and therefore it is a distinct test requiring an independent validation study, as reported here.
Materials and Methods
Overall Study Design
Formalin-fixed, paraffin-embedded, tumor specimens were analyzed with the Tissue of Origin Test for FFPE (Figure 1). All sample preparation and microarray testing was performed at one of four independent processing laboratories: Affymetrix Clinical Services Laboratory (West Sacramento, CA), Cogenics (Research Triangle Park, NC), Expression Analysis (Research Triangle Park, NC), Pathwork Diagnostics Laboratory (Redwood City, CA). Affymetrix Clinical Services Laboratory, Expression Analysis, and Pathwork Diagnostics Laboratory performed experiments for the validation study; intersite reproducibility was assessed at Expression Analysis, Pathwork Diagnostics Laboratory, and Cogenics. Laboratories performing the test were blinded to the reference diagnoses of samples. Microarray data files (CEL files) were sent to Pathwork Diagnostics for analysis with computer algorithms for data normalization, data verification (quality control)18 and tissue of origin classification. All algorithms had been prespecified (ie, locked) before data analysis. The set of specimens used for clinical validation was completely independent of the set of specimens that had been used for algorithm training.
Figure 1.
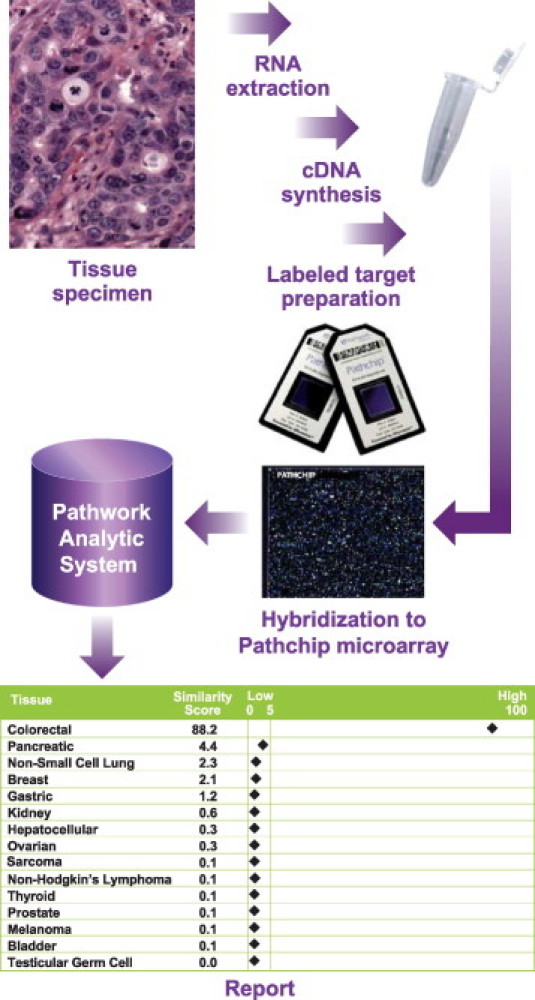
Tissue of Origin Test Workflow. To perform the Tissue of Origin Test, total RNA from an FFPE specimen is processed to labeled cDNA for hybridization to the Pathchip microarray. The microarray data file (CEL) is then transmitted to Pathwork Diagnostics (Redwood City, CA) for analysis. A Tissue of Origin Test report is produced, with one Similarity Score (SS) for each of the 15 tissue types as shown here in a sample report for a colorectal tissue of origin. The sum of the 15 SS values is always 100. A tissue with an SS value of ≤5 can be ruled out with >99% likelihood.
Tissue calls issued by the test for 462 evaluable specimens were compared with the known diagnoses for the specimens. The primary endpoint was overall percent agreement between expression results and the reference diagnoses. The average number of tissues that could be ruled out as a tissue of origin for each specimen was also calculated. Other endpoints included the yield of total RNA from FFPE specimens, the impact on test performance of specimen biopsy site, status as primary or metastatic tumor, block age and percent viable tumor, and the interlaboratory reproducibility of the test as determined by analysis of 60 specimens (4 of each tissue type) in each of three laboratories.
Development of the Tissue of Origin Test
The Pathwork Tissue of Origin Test for FFPE uses an RNA expression profile of 2000 gene markers to assess the similarity of the patient tumor to a panel of 15 known tumor types. The test relies on two distinct algorithms, one for standardization and one for classification.
Standardization corrects for variations due to differences in RNA quality, sample storage and preparation, operators, or microarray procedures.18 The standardization algorithm was developed by evaluating >5000 tissue specimens in multiple laboratories to identify a set of stable probe sets or markers that could be applied to normalize raw probe-level intensity values across every array. The specimens spanned a range of tissues. The data files were derived from fresh-frozen specimens processed by 11 laboratories, and consisting of 85% cancer and 15% normal and adjacent normal tissue samples. The data set included publicly available CEL files from the International Genomics Consortium's Expression Project for Oncology (expO), deposited in the GEO database) under the GSE number 2109, and from commercial data sources. The goal was to include files that spanned an adequate range of laboratories and operators to ensure that the genes used for standardization were highly robust.
Standardized expression data are evaluated in the test's classification algorithm. which was developed using a database of 2032 frozen and 104 FFPE specimens, divided into independent training and test data sets. The training set data are a combination of public data sets, commercial data sources, and private correspondence. The publicly available component has been derived from GEO (GSE number 2109). All training specimens had been assigned one of 15 tissue of origin diagnoses according to standard clinical and pathological practices. The test set consisted of the FFPE specimens. Machine learning techniques guided selection of the 2000-gene profile and the optimal model needed to classify the tumor. The model consists of a list of markers and a set of coefficients. These components are combined to produce 15 similarity scores, each corresponding to the probability that the input specimen has a molecular signature of the corresponding tissue of origin.
FFPE Specimens
Specimens were admitted into the clinical validation study using the following entry criteria. (i) Samples were obtained under an institutional review board-approved procedure. (ii) All human tumor samples were selected from the 15 tumor tissues included in the Pathwork Tissue of Origin Test panel. These tissues are: bladder, breast, colorectal, gastric, testicular germ cell, kidney, hepatocellular, and non-small cell lung cancer, as well as non-Hodgkin's lymphoma, melanoma, ovarian cancer, pancreatic cancer, prostate cancer, thyroid cancer, and sarcoma. (iii) All samples were selected from the 58 morphologies included in the development of the Pathwork Tissue of Origin Test. A complete list is provided in Supplemental Table S1 (http://jmd.amjpathol.org). (iv) To approximate the test's likely use in clinical practice, the specimens were all metastases or primaries that were poorly differentiated or undifferentiated. (v) Specimens contained enough material for one 10-μm-thick curl for microarray analysis, and one 5-μm-thick H&E-stained section for confirmation of ≥60% tumor tissue. The curls were stored at 4°C and protected from light. (vi) All specimens were estimated to contain ≥60% tumor tissue by the vendor pathologist. A board-certified Pathwork pathologist reviewed H&E slides to ensure consistency with the reference diagnoses, verify percent tumor, and note percent necrosis of all specimens before processing. If percent tumor was not consistent with the vendor description, the Pathwork pathologist assessment was used for this study. If histology was not consistent, the specimen was excluded from the study. Tumor is defined as tumor cells plus stroma. (vii) Clinical information associated with specimens was requested but not required for entry. Available clinical information was recorded for age, race, gender of patient, site of biopsy, or resection from which specimen was obtained (Table 1), tissue dimensions, and date (year) in which specimen was obtained.
Table 1.
Patient Characteristics
| Characteristic | No. |
|---|---|
| Total sample size | 462 |
| Sex (n = 462) | |
| F | 257 |
| M | 205 |
| Age range (n = 459) | |
| 10 to <20 | 3 |
| 20 to <30 | 19 |
| 30 to <40 | 44 |
| 40 to <50 | 79 |
| 50 to <60 | 133 |
| 60 to <70 | 104 |
| 70 to <80 | 63 |
| ≥80 | 14 |
| Ethnicity (n = 385)⁎ | |
| African American | 3 |
| Asian/Pacific Islander | 68 |
| European origin | 314 |
F, female; M, male.
As recorded by tissue bank at sample acquisition.
The FFPE specimens were obtained from seven different human tumor tissue banks. Specimens had been resected within the past 5 years. The FFPE specimens used in this study reflected the range of acquisition and handling standards used by each tissue bank and its affiliated community, and academic oncology practices. Specimens had been designated as one of the 58 morphologies consolidated into 15 tissue types covered by the Tissue of Origin Test, and ranged from 25 to 57 specimens for each tissue. After acquisition, screening, de-identification, and coding at Pathwork Diagnostics, specimens were distributed to one of four laboratories for processing and microarray scanning.
RNA Extraction and Processing
Total RNA was extracted and isolated from each 10-μm-thick FFPE curl per the manufacturer's instructions for use of FormaPure for nucleic acid isolation from formalin-fixed paraffin-embedded tissue (Agencourt; Beckman-Coulter Genomics, Beverly, MA) and Ambion DNase I RNA-free kit (Ambion; Life Technologies, Austin, TX). Total RNA concentration was determined with a spectrophotometer (NanoDrop, Wilmington, DE). Two-cycle RNA amplification was accomplished with the RampUP kit (Genisphere, Hatfield, PA). Starting material was 30 ng total RNA at a concentration of 10 ng/μL. A minimum of 25 μg sense RNA and a yield of 2.5 μg labeled cDNA were required to proceed to microarray analysis. At all sites, a positive/negative control was run with every batch of specimens.
In the reproducibility portion of this study, adjacent 10-μm-thick curls were obtained from FFPE blocks from 60 specimens. A set of 60 curls was sent to each of three sites for RNA isolation and processing. This study was designed to measure overall clinical reproducibility by including key sources of expected variation, such as variation across a single FFPE tumor specimen block, multiple operators, multiple days, and multiple lots of reagents.
Specimen Processing
Of 595 specimens from which RNA isolation was attempted, 549 (92%) yielded at least 150 ng. Thirty nanograms total RNA is required to perform the Tissue of Origin Test. Total RNA from 563 samples (30 ng each) was processed. Of these, 549 (98%) were processed successfully and were hybridized to Pathchip microarrays. Of the 549 specimens, all 549 (100%) met the minimum cDNA criterion of ≥2.5 μg needed for hybridization. Of the 549, 462 (84%) passed prespecified microarray quality control criteria and were used in data analyses. In all cases at each site, the batch control on each processing plate gave the correct prediction.
Microarray Analysis
The Tissue of Origin Test used Pathchip microarrays manufactured by Affymetrix (Affymetrix, Santa Clara, CA). Following specimen processing, labeled cDNA was hybridized to the Pathchip microarray. The microarrays were washed and stained using the GeneChip hybridization wash and stain kit in a GeneChip fluidics station FS450 or FS450Dx. All arrays were scanned with an Affymetrix GeneChip scanner 3000 or 3000Dx. The resulting intensity data (CEL files) were sent to Pathwork Diagnostics, where data quality was verified to meet the prespecified quality control metrics of Overall Signal ≥10, Percent Present ≥5, and Regional Discontinuity ≤0.84. The metrics are calculated as follows. (i) The Overall Signal value is the mean of the summarized expression values of all probe sets on the Pathchip microarray; low overall signal (and low Percent Present, described below) is likely the result of inadequate amplification, insufficient quantities of labeled cDNA or inadequate hybridization time or temperature. (ii) The Percent Present value is the percentage of probe sets on the Pathchip microarray that are assigned a Present call by the Affymetrix MAS 5.0 algorithm, excluding the Affymetrix control probe sets with “AFFX_” as prefix. (iii) Regional Discontinuity is the probe-level correlation between the intensity of a probe and the mean intensity of the two vertically adjacent probes on the chip surface, computed over all Pathchip probes, and measures any variation in regional probe intensity that could result from air pockets or other hybridization problems.
The microarrays that passed the quality metrics were used to generate the Tissue of Origin Test results, which were automatically generated by the computer algorithm without consideration of the reference diagnosis.
Sample Size
The minimum sample size for clinical validation was found to be at least 351 samples or at least 23 specimens per tissue source, based on the 85% power to exclude the null hypothesis that percent agreement is ≤75% (α = 0.05) if the true percent agreement is at least 81% (corresponding to the expected baseline of 81% determined from feasibility studies). In the clinical validation study, 462 files were analyzed, with 25 to 57 specimens representing each tissue type.
Data Analysis
The Tissue of Origin Test report was interpreted and results were analyzed using the following guide to report interpretation: The SS is a measure of the similarity of the RNA expression pattern of the specimen to the RNA expression pattern of the indicated tissue. Similarity Scores range from 0 (very low similarity) to 100 (very high similarity) and sum to 100 across all 15 tissues on the panel. The highest SS indicates the likely tissue of origin, with one exception: in male patients, a highest SS for ovarian cancer, followed by a second highest SS for testicular germ cell cancer, corresponds to testicular germ cell cancer. An SS of ≤5 rules out that tissue type as the likely tissue of origin.
In male patients, when testicular germ cell cancer tissue was the highest SS, the result was in agreement with the available diagnosis 100% of the time (12/12). There were nine other cases in males in which ovarian cancer was the highest SS and testicular germ cell cancer was the second highest SS; 100% of the cases (9/9) were testicular germ cell cancer by available diagnosis. Similarity Scores for ovarian cancer in males and prostate cancer or testicular germ cell tumor in females have no clinical significance. Such SS, if they occur, result from RNA expression patterns that are similar to patterns in the database.
Data analysis for the primary outcome, percent agreement with reference diagnoses, involved dividing the number of FFPE specimens for which the test result matches the reference diagnosis by the total number of FFPE specimens for which a Tissue of Origin Test Report was generated. The percent agreement and nonagreement were calculated with 95% confidence intervals. The positive percent agreement was calculated as 100 × TP/POS, where TP is the number of test results that matched the reference diagnoses for the given tissue of origin and POS is the total number of positive specimens as per reference diagnosis for the given tissue of origin. The negative percent agreement was calculated as 100 × [1 − (FP/NEG)], where FP is the number of test results that are false positive (as per the reference diagnoses) for the given tissue of origin and NEG is the number of negative specimens as per the reference diagnosis for the given tissue of origin. The diagnostic odds ratio50 was calculated for each tissue type to provide a single indicator of test performance in these populations. Other outcomes of interest (eg, specimens with adequate total or sense RNA, labeled cDNA, and passing data verification) were reported as simple percentages. For the reproducibility study, if the Tissue of Origin result from one site matched the result from another site, the results were considered concordant. Overall pairwise concordance is reported. Kappa analysis for intersite agreement51 and Bland-Altman analysis to assess systematic bias between laboratories52 were also performed.
Results
Agreement with Reference Diagnoses
For the 462 qualified specimens, overall agreement of the test result with reference diagnoses was 88.5% (95% CI, 85.3% to 91.3%) (Table 2). The positive percent agreement was 88.5, and the negative percent agreement was 99.1.
Table 2.
Tissue of Origin Test Clinical Validation Results
| Reference cancer diagnosis | Agreement % (ratio) | 95% CI | Nonagreement % (ratio) | 95% CI |
|---|---|---|---|---|
| Bladder | 79.3 (23/29) | 60.3–92.0 | 20.7 (6/29) | 8.0–39.7 |
| Breast | 96.5 (55/57) | 87.9–99.6 | 3.5 (2/57) | 0.4–12.1 |
| Colorectal | 91.7 (33/36) | 77.5–98.2 | 8.3 (3/36) | 1.8–22.5 |
| Gastric | 72.0 (18/25) | 50.6–87.9 | 28.0 (7/25) | 12.1–49.4 |
| Hepatocellular | 96.0 (24/25) | 79.6–99.9 | 4.0 (1/25) | 0.1–20.4 |
| Kidney | 89.3 (25/28) | 71.8–97.7 | 10.7 (3/28) | 0.3–28.2 |
| Melanoma | 84.0 (21/25) | 63.9–95.5 | 16.0 (4/25) | 0.5–36.1 |
| Non-Hodgkin's lymphoma | 89.7 (26/29) | 72.6–97.8 | 10.3 (3/29) | 2.2–27.4 |
| Non-small cell lung | 85.2 (23/27) | 66.3–95.8 | 14.8 (4/27) | 4.2–33.7 |
| Ovarian | 88.9 (40/45) | 75.9–96.3 | 11.1 (5/45) | 3.7–24.1 |
| Pancreas | 85.7 (24/28) | 67.3–96.0 | 14.3 (4/28) | 4.0–32.7 |
| Prostate | 96.0 (24/25) | 79.6–99.9 | 4.0 (1/25) | 0.1–20.4 |
| Sarcoma | 88.9 (24/27) | 70.8–97.6 | 11.1 (3/27) | 2.4–29.2 |
| Testicular germ cell | 84.0 (21/25) | 63.9–95.5 | 16.0 (4/25) | 4.5–36.1 |
| Thyroid | 90.3 (28/31) | 74.2–98.0 | 9.7 (3/31) | 2.0–25.8 |
| Overall | 88.5 (409/462) | 85.3–91.3 | 11.5 (53/462) | 8.7–14.7 |
When the entire data set of 5732 SS with a value of ≤5 was analyzed, it was found that any tissue type with an SS of ≤5 had a 99.8% probability of not being the Tissue of Origin. Thus, for each specimen, in addition to the single positive call, an average of 12 tissues were ruled out (ie, SS ≤5) with 99.8% accuracy. The diagnostic odds ratio, a commonly used single measure of test performance, was >100 for all 15 tissues, with a range of 185 (for gastric) to 14,292 (for liver and prostate) indicating that all 15 tests are highly informative.
The distribution of Tissue of Origin Test results is shown in Table 3 and indicates the high level of overall agreement of the test results with the reference diagnoses.
Table 3.
Distribution of Tissue of Origin Test Results by Tumor Type
| Specimen (abbreviation) | No. of specimens | Distribution of Tissue of Origin Test results result across the 15 tissues on the Tissue of Origin Test panel |
||||||||||||||
|---|---|---|---|---|---|---|---|---|---|---|---|---|---|---|---|---|
| BL | BR | CO | GA | GC | KI | LI | LU | LY | ME | OV | PA | PR | SC | TH | ||
| Bladder (BL) | 29 | 23 | 1 | 1 | 4 | |||||||||||
| Breast (BR) | 57 | 55 | 2 | |||||||||||||
| Colorectal (CO) | 36 | 33 | 1 | 1 | 1 | |||||||||||
| Gastric (GA) | 25 | 5 | 18 | 1 | 1 | |||||||||||
| Germ Cell (GC) | 25 | 1 | 1 | 21 | 2 | |||||||||||
| Kidney (KI) | 28 | 25 | 3 | |||||||||||||
| Hepatocellular (LI) | 25 | 24 | 1 | |||||||||||||
| Non-Small Cell Lung (LU) | 27 | 1 | 1 | 23 | 1 | 1 | ||||||||||
| Non-Hodgkin's Lymphoma (LY) | 29 | 2 | 26 | 1 | ||||||||||||
| Melanoma (ME) | 25 | 2 | 21 | 2 | ||||||||||||
| Ovarian (OV) | 45 | 1 | 1 | 40 | 2 | 1 | ||||||||||
| Pancreas (PA) | 28 | 2 | 1 | 24 | 1 | |||||||||||
| Prostate (PR) | 25 | 1 | 24 | |||||||||||||
| Sarcoma (SC) | 27 | 1 | 1 | 1 | 24 | |||||||||||
| Thyroid (TH) | 31 | 1 | 2 | 28 | ||||||||||||
| Total | 462 | 23 | 59 | 46 | 24 | 21 | 27 | 24 | 23 | 28 | 21 | 45 | 29 | 24 | 40 | 28 |
The confusion matrix highlights, on the diagonal in bold, the high level of overall agreement of the test results with the reference diagnoses. The results off the diagonal identify the test results that do not agree with the reference diagnosis.
The average highest SS for the 409 specimens whose calls were in agreement with the reference diagnosis was 72.6, compared to the considerably lower average highest SS of 39.9 for the 53 specimens that were not in agreement.
Analysis of Subgroups
Test performance was good with both metastatic specimens (n = 179; 91.1% agreement) and with poorly differentiated to undifferentiated primary tumors (n = 283; 86.9% agreement) (Table 4). For the 179 metastatic specimens, Tissue of Origin Test results were stratified by biopsy site (Table 5). The percent agreement in 113 specimens taken from lymph nodes (92.0%) was similar to that observed in biopsies from other sites, and no apparent difference in performance related to biopsy site was seen.
Table 4.
Tissue of Origin Test Performance According to Metastatic versus Primary Tumor Status
| Tumor type | Agreement % (ratio) | Nonagreement % (ratio) |
|---|---|---|
| Metastatic | 91.1 (163/179) | 8.9 (16/179) |
| Primary | 86.9 (246/283) | 13.1 (37/283) |
| Overall | 88.5 (409/462) | 11.5 (53/462) |
| 95% CI | 85.3–91.3 | 8.7–14.7 |
Table 5.
Tissue of Origin Test Performance According to Biopsy Site of Metastatic Samples
| Biopsy site | Agreement % (ratio) | Nonagreement % (ratio) |
|---|---|---|
| Colorectal | 100.0 (5/5) | 0.0 (0/5) |
| Gastric | 83.3 (5/6) | 16.7 (1/6) |
| Kidney | 100.0 (1/1) | 0.0 (0/1) |
| Liver | 100.0 (9/9) | 0.0 (0/9) |
| Lung | 60.0 (3/5) | 40.0 (2/5) |
| Lymph Node | 92.0 (104/113) | 8.0 (9/113) |
| Ovary | 100.0 (6/6) | 0.0 (0/6) |
| Soft Tissue | 86.7 (13/15) | 13.3 (2/15) |
| Other | 89.5 (17/19) | 10.5 (2/19) |
| Overall⁎ | 91.1 (163/179) | 8.9 (16/179) |
Metastatic tumors only.
Test performance was consistent at all levels of viable percent tumor >60%, the prespecified cutoff for specimen adequacy. Agreement ratios for positive calls were 91.9% (34/37) in the lowest 60% to 70% viable tumor range, 85.2% (46/54) in the 70% to 80% range, 90.9% (100/110) in the 80% to 90% range, and 88.1% (133/151) in the ≥90% range. There was no indication of deteriorating performance at the lower range of percent tumor in the specimen.
Test results were stratified by the age of the FFPE block (Table 6). There was no trend of diminishing performance in older specimens. Data for FFPE blocks >4 years old were not sufficient (n = 6) to make any conclusions about performance. Test performance was similar at the three test sites: 92.9% (158/170) overall agreement at Affymetrix Clinical Services Laboratory, 87.8% (164/187) at EA, and 82.9% (87/105) at Pathwork Diagnostics Laboratory.
Table 6.
Tissue of Origin Test Performance Stratified by Age of FFPE Specimens
| Specimen, year | Agreement % (ratio) | Nonagreement % (ratio) |
|---|---|---|
| Before 2005 | 83.3 (5/6) | 16.7 (1/6) |
| 2005 | 86.2 (94/109) | 13.8 (15/109) |
| 2006 | 92.1 (82/89) | 7.9 (7/89) |
| 2007 | 89.9 (134/149) | 10.1 (15/149) |
| 2008 | 86.7 (85/98) | 13.3 (13/98) |
| 2009 | 81.8 (9/11) | 18.2 (2/11) |
| Overall | 88.5 (409/462) | 11.5 (53/462) |
| 95% CI | 85.3–91.3 | 8.7–14.7 |
Probability of Agreement with Reference Diagnosis by Highest SS
The probability of agreement between a Tissue of Origin Test result and the reference diagnosis was increased in specimens with elevated highest SS (Figure 2). Test reports with elevated highest SS are more common, as indicated by the higher number of specimens in each bin at the higher SS. The decline of confidence with decreasing highest SS was modest. At the lowest end of the range (10 to 20), there were only eight specimens; of these, seven were nonagreements. Therefore, given the few available data, we conclude that performance has not been established for test results where the highest SS is less than 20.
Figure 2.

Probability of agreement with reference diagnosis for Tissue of Origin Test Similarity Score. The x axis indicates the highest SS of a Tissue of Origin Test report for the 462 specimens, in 10 equal bins from 0 to 100. The y axis indicates percent probability that the test result in the corresponding bin of a Tissue of Origin Test report is in agreement with the reference diagnosis. The probabilities are estimated for SS bins of width 10. Thus, each bar represents the aggregate probability for the corresponding bin. Error bars indicate the 95% confidence intervals of the percent probability estimate. The number of specimens in the bin, used to calculate the probability, is indicated above each error bar. For example, a report with a highest SS of 75 indicates actual tissue of origin of the specimen under test approximately 90% of the time. Note that Tissue of Origin Test results with highest SS of <20 are rare.
Reproducibility of Tissue of Origin Results in Laboratories Processing Replicate Specimens
The reproducibility of the test was established in a study performed at three laboratories. Replicate 10-μm-thick curls were sent to each laboratory and processed to yield 162 Tissue of Origin Test reports. This provided 149 qualified paired results. Overall concordance between paired results in the three laboratories was 89.3% (133/149). For each specimen, the 15 SS produced by each test are considered the primary diagnostic. The SS for the three laboratory pairs were evaluated using linear regression and correlation analysis. Correlation coefficients (r) ranged from 0.92 to 0.93, and slopes from 0.93 to 0.96, establishing that the test is highly reproducible. Kappa analysis of intersite agreement ranged from 0.85 to 0.92. Bland-Altman analysis was performed to assess systematic bias between laboratories that could adversely affect test results. No evidence of systemic bias among the three sites was found, in that fewer than 10% of specimens were outside the 95% limit of agreement.
Discussion
The use of RNA expression patterns to determine the tissue of origin of clinical specimens is a long-awaited application of molecular biology to an important clinical problem. Until recently, such application has been delayed by the difficulties in obtaining accurate and useful gene expression measurements from the most commonly available pathology specimens, which are formalin-fixed and paraffin-embedded. In a recent article,48 it is stated that “only a quarter of unselected FFPE samples aged 2–8 years provided RNA of sufficient quality for successful expression analysis,” using microarrays. We describe methods that allow almost 80% of such formalin-fixed samples to provide high-quality microarray data. With the availability of methods for the reproducible extraction and amplification of FFPE-derived RNA, these routine clinical specimens have become available for analysis of RNA expression. This, combined with the ability to measure the levels of thousands of different RNA sequences using microarray technology, makes gene expression a powerful new tool in oncology diagnostics.
Here we have described such a diagnostic test for the classification of primary site of tumors in FFPE specimens derived from metastatic or poorly differentiated tumor specimens. In a blinded, multisite study of 462 FFPE specimens, the overall agreement of test results with reference diagnoses was 88.5%. Performance was high for both metastatic and poorly differentiated primary tumor specimens, showing 91% and 87% agreement, respectively. In contrast, a recent meta-analysis showed that IHC correctly identified the primary site in only 66% (95% CI, 60% to 71%) of metastatic cancers, in four large studies in which pathologists were similarly blinded to knowledge of the primary site and clinical data.14
This is, to our knowledge, the largest and most rigorously conducted validation of a gene expression–based test for identifying a tumor's primary site using formalin-fixed paraffin-embedded specimens. The large number of specimens analyzed, with at least 25 specimens per tissue type, allows confidence in the overall accuracy results for both rule-in and rule-out of the tissue of origin. The distribution of specimens validated test performance for each of the fifteen cancer tissue types.
In addition to issuing a single positive call for each of the 462 FFPE specimens, the Tissue of Origin Test also produced an average of 12 high-probability negative calls (SS ≤5) for every specimen. The ability to rule out a dozen possible tissues of origin in an uncertain tumor has substantial clinical value for pathologists and oncologists.
The agreement rate seen in this study is the highest reported for an expression-based tissue of origin test.15,17,20–25 Although other tissue of origin assays have claimed overall accuracies of approximately 75% to 90%, the results of each study need to be evaluated carefully before making comparisons. For example, many classifiers lose significant accuracy when assessing poorly differentiated or metastatic tissues20,22,26 or a particular tissue type.19 As attested in a recent review,53 design features of each study also need to be considered, such as sample size and method of reporting accuracy. Such criteria should be used to assess the validity of performance claims.
By demonstrating that microarray analysis can be performed on FFPE specimens, this study has removed a major limitation on use of the optimal expression platform for tissue of origin classification. Microarray analysis of typical FFPE specimens is feasible, and can provide results that are accurate and reproducible.
Given the performance documented in this study, the Tissue of Origin Test appears suitable for use in clinical settings, especially in the light of the small amounts of material required. As little as 30 ng total RNA is sufficient to perform the test. Appropriate use of this expression test may eliminate unnecessary diagnostic tests, allow selection of more targeted therapy, speed enrollment in appropriate clinical trials, and avoid patient exposures to costly, ineffective, or potentially toxic treatments. Identification of a tumor's primary site with gene expression testing has already been successfully used as a guide to tumor-specific therapy in a limited number of cases.4,48,54 The principal goal driving pathologists' use of IHC panels and other tests remains identification of primary cancer site. The present study demonstrated that microarray-based gene expression testing can further refine this search. As newer targeted therapies are introduced, the value in improved tissue of origin classification will only increase.2,5 A recent study with frozen specimens has shown the utility of the Tissue of Origin Test in identifying the tissue of origin in tumor specimens from 21 patients with a diagnosis of carcinoma of unknown primary.55
In summary, this study showed that routine FFPE specimens can be reliably processed to yield high-quality gene expression microarray data files. The Tissue of Origin Test shows a high degree of agreement with the reference diagnosis for approximately 9 of every 10 specimens. Tissues on the panel with SS results of ≤5 can be ruled out as the primary site with >99% likelihood. A multisite interlaboratory study has shown that the Tissue of Origin Test results are highly reproducible, with 89.3% concordance between laboratories. The ability to obtain high-quality, whole-genome gene expression data from routine clinical specimens and to convert these data into accurate and reproducible results, indicating the likely primary site of a malignancy, will be highly useful as an aid in the diagnosis of human malignancies. As a diagnostic test cleared by the U.S. Food and Drug Administration that has been rigorously validated and provides objective information, the Tissue of Origin Test can assist pathologists and oncologists in determining the primary sites of tumors, and may thereby help guide more targeted and less toxic therapy.
Acknowledgments
We thank the management and professional staff of the processing laboratories involved in this study: Expression Analysis (Research Triangle Park, NC), Affymetrix Clinical Services Laboratory (West Sacramento, CA), Cogenics (Research Triangle Park, NC), and Pathwork Diagnostics Laboratory (Redwood City, CA). We also thank Robert Getts and colleagues at Genisphere, Inc. (Hatfield, PA), for helpful discussions. We acknowledge colleagues at Pathwork Diagnostics for valuable input on the manuscript. We thank Paul Courter and Jane Seck for their editorial assistance.
Footnotes
Supported by Pathwork Diagnostics Inc., Redwood City, CA.
R.P., R.D., M.H.M., L.B., and W.D.H. are employees and shareholders of Pathwork Diagnostics, which developed the tissue of origin test described in the article. C.T.R. was an employee and shareholder of Pathwork Diagnostics during this study. J.S.N. has received honoraria for consultation with Pathwork Diagnostics. There are no other potential conflicts of interest. All authors except J.S.N. were at the time of the study employed by Pathwork Diagnostics which developed the Pathwork Tissue of Origin Test evaluated in this study.
Supplemental material for this article can be found at http://jmd.amjpathol.org or at doi:10.1016/j.jmoldx.2010.11.001.
Contributor Information
Raji Pillai, Email: rpillai@pathworkdx.com.
W. David Henner, Email: dhenner@pathworkdx.com.
Supplementary data
Pathwork Tissue of Origin Test Kit–FFPE: Included and Excluded Morphologies
References
- 1.Pavlidis N., Fizazi K. Cancer of unknown primary (CUP) Crit Rev Oncol Hematol. 2005;54:243–250. doi: 10.1016/j.critrevonc.2004.10.002. [DOI] [PubMed] [Google Scholar]
- 2.Greco F.A., Hainsworth J.D. Cancer of unknown primary site. In: DeVita V.T., Hellman S., Rosenberg S.A., editors. Cancer: Principles & Practice of Oncology. ed 7. Lippincott Williams & Wilkins; Philadelphia PA: 2005. pp. 2213–2234. [Google Scholar]
- 3.Abbruzzese J.L., Abbruzzese M.C., Lenzi R., Hess K.R., Raber M.N. Analysis of a diagnostic strategy for patients with suspected tumors of unknown origin. J Clin Oncol. 1995;13:2094–2103. doi: 10.1200/JCO.1995.13.8.2094. [DOI] [PubMed] [Google Scholar]
- 4.Varadhachary G.R., Talantov D., Raber M.N., Meng C., Hess K.R., Jatkoe T., Lenzi R., Spigel D.R., Wang Y., Greco F.A., Abbruzzese J.L., Hainsworth J.D. Molecular profiling of carcinoma of unknown primary and correlation with clinical evaluation. J Clin Oncol. 2008;26:4442–4448. doi: 10.1200/JCO.2007.14.4378. [DOI] [PubMed] [Google Scholar]
- 5.Greco F.A., Pavlidis N. Treatment for patients with unknown primary carcinoma and unfavorable prognostic factors. Semin Oncol. 2009;36:65–74. doi: 10.1053/j.seminoncol.2008.10.005. [DOI] [PubMed] [Google Scholar]
- 6.Bugat R., Bataillard A., Lesimple T., Voigt J.J., Culine S., Lortholary A., Merrouche Y., Ganem G., Kaminsky M.C., Negrier S., Perol M., Laforêt C., Bedossa P., Bertrand G., Coindre J.M., Fizazi K. FNCLCC: Summary of the Standards, Options and Recommendations for the management of patients with carcinoma of unknown primary site. Br J Cancer. 2003;89(Suppl 1):S59–S66. doi: 10.1038/sj.bjc.6601085. (2002) [DOI] [PMC free article] [PubMed] [Google Scholar]
- 7.Park S.Y., Kim B.H., Kim J.H., Lee S., Kang G.H. Panels of immunohistochemical markers help determine primary sites of metastatic adenocarcinoma. Arch Pathol Lab Med. 2007;131:1561–1567. doi: 10.5858/2007-131-1561-POIMHD. [DOI] [PubMed] [Google Scholar]
- 8.Pavlidis N., Briasoulis E., Hainsworth J., Greco F.A. Diagnostic and therapeutic management of cancer of an unknown primary. Eur J Cancer. 2003;39:1990–2005. doi: 10.1016/s0959-8049(03)00547-1. [DOI] [PubMed] [Google Scholar]
- 9.Baker P.M., Oliva E. Immunohistochemistry as a tool in the differential diagnosis of ovarian tumors: an update. Int J Gynecol Pathol. 2005;24:39–55. [PubMed] [Google Scholar]
- 10.McKenney J.K., Amin M.B. The role of immunohistochemistry in the diagnosis of urinary bladder neoplasms. Semin Diagn Pathol. 2005;22:69–87. doi: 10.1053/j.semdp.2005.11.005. [DOI] [PubMed] [Google Scholar]
- 11.Bahrami A., Truong L.D., Ro J.Y. Undifferentiated tumor: true identity by immunohistochemistry. Arch Pathol Lab Med. 2008;132:326–348. doi: 10.5858/2008-132-326-UTTIBI. [DOI] [PubMed] [Google Scholar]
- 12.Brown R.W., Campagna L.B., Dunn J.K., Cagle P.T. Immunohistochemical identification of tumor markers in metastatic adenocarcinoma: A diagnostic adjunct in the determination of primary site. Am J Clin Pathol. 1997;107:12–19. doi: 10.1093/ajcp/107.1.12. [DOI] [PubMed] [Google Scholar]
- 13.Sica G., Wagner P.L., Altorki N., Port J., Lee P.C., Vazquez M.F., Saqi A. Immunohistochemical expression of estrogen and progesterone receptors in primary pulmonary neuroendocrine tumors. Arch Pathol Lab Med. 2008;132:1889–1895. doi: 10.5858/132.12.1889. [DOI] [PubMed] [Google Scholar]
- 14.Anderson G.G., Weiss L. Determining tissue of origin for metastatic cancers: meta-analysis and literature review of immunohistochemistry performance. Appl Immunohistochem Mol Morphol. 2010;1:3–8. doi: 10.1097/PAI.0b013e3181a75e6d. [DOI] [PubMed] [Google Scholar]
- 15.Bloom G., Yang I.V., Boulware D., Kwong K.Y., Coppola D., Eschrich S., Quackenbush J., Yeatman T.J. Multi-platform, multi-site, microarray-based human tumor classification. Am J Pathol. 2004;164:9–16. doi: 10.1016/S0002-9440(10)63090-8. [DOI] [PMC free article] [PubMed] [Google Scholar]
- 16.Bridgewater J., van Laar R., Floore A., Van'T Veer L. Gene expression profiling may improve diagnosis in patients with carcinoma of unknown primary. Br J Cancer. 2008;98:1425–1430. doi: 10.1038/sj.bjc.6604315. [DOI] [PMC free article] [PubMed] [Google Scholar]
- 17.Buckhaults P., Zhang Z., Chen Y.C., Wang T.L., St Croix B., Saha S., Bardelli A., Morin P.J., Polyak K., Hruban R.H., Velculescu V.E., Shih IeM Identifying tumor origin using a gene expression-based classification map. Cancer Res. 2003;63:4144–4149. [PubMed] [Google Scholar]
- 18.Dumur C.I., Lyons-Weiler M., Sciulli C., Garrett C.T., Schrijver I., Holley T.K., Rodriguez-Paris J., Pollack J.R., Zehnder J.L., Price M., Hagenkord J.M., Rigl C.T., Buturovic L.J., Anderson G.G., Monzon F.A. Interlaboratory performance of a microarray-based gene expression test to determine tissue of origin in poorly differentiated and undifferentiated cancers. J Mol Diagn. 2008;10:67–77. doi: 10.2353/jmoldx.2008.070099. [DOI] [PMC free article] [PubMed] [Google Scholar]
- 19.Horlings H.M., van Laar R.K., Kerst J.M., Helgason H.H., Wesseling J., van der Hoeven J.J., Warmoes M.O., Floore A., Witteveen A., Lahti-Domenici J., Glas A.M., Van't Veer L.J., de Jong D. Gene expression profiling to identify the histogenetic origin of metastatic adenocarcinomas of unknown primary. J Clin Oncol. 2008;26:4435–4441. doi: 10.1200/JCO.2007.14.6969. [DOI] [PubMed] [Google Scholar]
- 20.Ma X.J., Patel R., Wang X., Salunga R., Murage J., Desai R., Tuggle J.T., Wang W., Chu S., Stecker K., Raja R., Robin H., Moore M., Baunoch D., Sgroi D., Erlander M. Molecular classification of human cancers using a 92-gene real-time quantitative polymerase chain reaction assay. Arch Pathol Lab Med. 2006;130:465–473. doi: 10.5858/2006-130-465-MCOHCU. [DOI] [PubMed] [Google Scholar]
- 21.Monzon F.A., Lyons-Weiler M., Buturovic L.J., Rigl C.T., Henner W.D., Sciulli C., Dumur C.I., Medeiros F., Anderson G.G. Multicenter Validation of a 1,550-Gene Expression Profile for Identification of Tumor Tissue of Origin. J Clin Oncol. 2009;27:2503–2508. doi: 10.1200/JCO.2008.17.9762. [DOI] [PubMed] [Google Scholar]
- 22.Ramaswamy S., Tamayo P., Rifkin R., Mukherjee S., Yeang C.H., Angelo M., Ladd C., Reich M., Latulippe E., Mesirov J.P., Poggio T., Gerald W., Loda M., Lander E.S., Golub T.R. Multiclass cancer diagnosis using tumor gene expression signatures. Proc Natl Acad Sci USA. 2001;98:15149–15154. doi: 10.1073/pnas.211566398. [DOI] [PMC free article] [PubMed] [Google Scholar]
- 23.Rosenfeld N., Aharonov R., Meiri E., Rosenwald S., Spector Y., Zepeniuk M., Benjamin H., Shabes N., Tabak S., Levy A., Lebanony D., Goren Y., Silberschein E., Targan N., Ben-Ari A., Gilad S., Sion-Vardy N., Tobar A., Feinmesser M., Kharenko O., Nativ O., Nass D., Perelman M., Yosepovich A., Shalmon B., Polak-Charcon S., Fridman E., Avniel A., Bentwich I., Bentwich Z., Cohen D., Chajut A., Barshack I. MicroRNAs accurately identify cancer tissue origin. Nat Biotechnol. 2008;26:462–469. doi: 10.1038/nbt1392. [DOI] [PubMed] [Google Scholar]
- 24.Su A.I., Welsh J.B., Sapinoso L.M., Kern S.G., Dimitrov P., Lapp H., Schultz P.G., Powell S.M., Moskaluk C.A., Frierson H.F., Jr, Hampton G.M. Molecular classification of human carcinomas by use of gene expression signatures. Cancer Res. 2001;61:7388–7393. [PubMed] [Google Scholar]
- 25.Talantov D., Baden J., Jatkoe T., Hahn K., Yu J., Rajpurohit Y., Jiang Y., Choi C., Ross J.S., Atkins D., Wang Y., Mazumder A. A quantitative reverse transcriptase-polymerase chain reaction assay to identify metastatic carcinoma tissue of origin. J Mol Diagn. 2006;8:320–329. doi: 10.2353/jmoldx.2006.050136. [DOI] [PMC free article] [PubMed] [Google Scholar]
- 26.van Laar R.K., Ma X.J., de Jong D., Wehkamp D., Floore A.N., Warmoes M.O., Simon I., Wang W., Erlander M., van't Veer L.J., Glas A.M. Implementation of a novel microarray-based diagnostic test for cancer of unknown primary. Int J Cancer. 2009;125:1390–1397. doi: 10.1002/ijc.24504. [DOI] [PubMed] [Google Scholar]
- 27.Rosenwald S., Gilad S., Benjamin S., Lebanony D., Dromi N., Faerman A., Benjamin H., Tamir R., Ezagouri M., Goren E., Barshack I., Nass D., Tobar A., Feinmesser M., Rosenfeld N., Leizerman I., Ashkenazi K., Spector Y., Chajut A., Aharonov R. Validation of a microRNA-based qRT-PCR test for accurate identification of tumor tissue origin. Mod Pathol. 2010;23:814–823. doi: 10.1038/modpathol.2010.57. [DOI] [PubMed] [Google Scholar]
- 28.Yeang C.H., Ramaswamy S., Tamayo P., Mukherjee S., Rifkin R.M., Angelo M., Reich M., Lander E., Mesirov J., Golub T. Molecular classification of multiple tumor types. Bioinformatics. 2001;17(Suppl 1):S316–S322. doi: 10.1093/bioinformatics/17.suppl_1.s316. [DOI] [PubMed] [Google Scholar]
- 29.Benchekroun M., DeGraw J., Gao J., Sun L., von Boguslawsky K., Leminen A., Andersson L.C., Heiskala M. Impact of fixative on recovery of mRNA from paraffin-embedded tissue. Diagn Mol Pathol. 2004;13:116–125. doi: 10.1097/00019606-200406000-00008. [DOI] [PubMed] [Google Scholar]
- 30.Bresters D., Schipper M.E., Reesink H.W., Boeser-Nunnink B.D., Cuypers H.T. The duration of fixation influences the yield of HCV cDNA-PCR products from formalin-fixed, paraffin-embedded liver tissue. J Virol Methods. 1994;48:267–272. doi: 10.1016/0166-0934(94)90125-2. [DOI] [PubMed] [Google Scholar]
- 31.Cronin M., Pho M., Dutta D., Stephans J.C., Shak S., Kiefer M.C., Esteban J.M., Baker J.B. Measurement of gene expression in archival paraffin-embedded tissues: development and performance of a 92-gene reverse transcriptase-polymerase chain reaction assay. Am J Pathol. 2004;164:35–42. doi: 10.1016/S0002-9440(10)63093-3. [DOI] [PMC free article] [PubMed] [Google Scholar]
- 32.Feldman M.Y. Reactions of nucleic acids and nucleoproteins with formaldehyde. Prog Nucleic Acid Res Mol Biol. 1973;13:1–49. doi: 10.1016/s0079-6603(08)60099-9. [DOI] [PubMed] [Google Scholar]
- 33.Macabeo-Ong M., Ginzinger D.G., Dekker N., McMillan A., Regezi J.A., Wong D.T., Jordan R.C. Effect of duration of fixation on quantitative reverse transcription polymerase chain reaction analyses. Mod Pathol. 2002;15:979–987. doi: 10.1097/01.MP.0000026054.62220.FC. [DOI] [PubMed] [Google Scholar]
- 34.Masuda N., Ohnishi T., Kawamoto S., Monden M., Okubo K. Analysis of chemical modification of RNA from formalin-fixed samples and optimization of molecular biology applications for such samples. Nucleic Acids Res. 1999;27:4436–4443. doi: 10.1093/nar/27.22.4436. [DOI] [PMC free article] [PubMed] [Google Scholar]
- 35.McGhee J.D., von Hippel P.H. Formaldehyde as a probe of DNA structure. 3. Equilibrium denaturation of DNA and synthetic polynucleotides Biochemistry. 1977;16:3267–3276. doi: 10.1021/bi00634a001. [DOI] [PubMed] [Google Scholar]
- 36.Medeiros F., Rigl C.T., Anderson G.G., Becker S.H., Halling K.C. Tissue handling for genome-wide expression analysis: a review of the issues, evidence, and opportunities. Arch Pathol Lab Med. 2007;131:1805–1816. doi: 10.5858/2007-131-1805-THFGEA. [DOI] [PubMed] [Google Scholar]
- 37.Srinivasan M., Sedmak D., Jewell S. Effect of fixatives and tissue processing on the content and integrity of nucleic acids. Am J Pathol. 2002;161:1961–1971. doi: 10.1016/S0002-9440(10)64472-0. [DOI] [PMC free article] [PubMed] [Google Scholar]
- 38.Chung J.Y., Braunschweig T., Williams R., Guerrero N., Hoffmann K.M., Kwon M., Song Y.K., Libutti S.K., Hewitt S.M. Factors in tissue handling and processing that impact RNA obtained from formalin-fixed, paraffin-embedded tissue. J Histochem Cytochem. 2008;56:1033–1042. doi: 10.1369/jhc.2008.951863. [DOI] [PMC free article] [PubMed] [Google Scholar]
- 39.Farragher S.M., Tanney A., Kennedy R.D., Paul Harkin D. RNA expression analysis from formalin fixed paraffin embedded tissues. Histochem Cell Biol. 2008;130:435–445. doi: 10.1007/s00418-008-0479-7. [DOI] [PubMed] [Google Scholar]
- 40.Hewitt S.M., Lewis F.A., Cao Y., Conrad R.C., Cronin M., Danenberg K.D., Goralski T.J., Langmore J.P., Raja R.G., Williams P.M., Palma J.F., Warrington J.A. Tissue handling and specimen preparation in surgical pathology: issues concerning the recovery of nucleic acids from formalin-fixed, paraffin-embedded tissue. Arch Pathol Lab Med. 2008;132:1929–1935. doi: 10.5858/132.12.1929. [DOI] [PubMed] [Google Scholar]
- 41.Hui A.B., Shi W., Boutros P.C., Miller N., Pintilie M., Fyles T., McCready D., Wong D., Gerster K., Waldron L., Jurisica I., Penn L.Z., Liu F.F. Robust global micro-RNA profiling with formalin-fixed paraffin-embedded breast cancer tissues. Lab Invest. 2009;89:597–606. doi: 10.1038/labinvest.2009.12. [DOI] [PubMed] [Google Scholar]
- 42.Szafranska A.E., Davison T.S., Shingara J., Doleshal M., Riggenbach J.A., Morrison C.D., Jewell S., Labourier E. Accurate molecular characterization of formalin-fixed, paraffin-embedded tissues by microRNA expression profiling. J Mol Diagn. 2008;10:415–423. doi: 10.2353/jmoldx.2008.080018. [DOI] [PMC free article] [PubMed] [Google Scholar]
- 43.Xi Y., Nakajima G., Gavin E., Morris C.G., Kudo K., Hayashi K., Ju J. Systematic analysis of microRNA expression of RNA extracted from fresh frozen and formalin-fixed paraffin-embedded samples. RNA. 2007;13:1668–1674. doi: 10.1261/rna.642907. [DOI] [PMC free article] [PubMed] [Google Scholar]
- 44.Dunn T.A., Fedor H., Isaacs W.B., De Marzo A.M., Luo J. Genome-wide expression analysis of recently processed formalin-fixed paraffin embedded human prostate tissues. Prostate. 2009;69:214–218. doi: 10.1002/pros.20863. [DOI] [PMC free article] [PubMed] [Google Scholar]
- 45.Fedorowicz G., Guerrero S., Wu T.D., Modrusan Z. Microarray analysis of RNA extracted from formalin-fixed, paraffin-embedded and matched fresh-frozen ovarian adenocarcinomas. BMC Med Genomics. 2009;2:23. doi: 10.1186/1755-8794-2-23. [DOI] [PMC free article] [PubMed] [Google Scholar]
- 46.Frank M., Doring C., Metzler D., Eckerle S., Hansmann M.L. Global gene expression profiling of formalin-fixed paraffin-embedded tumor samples: a comparison to snap-frozen material using oligonucleotide microarrays. Virchows Arch. 2007;450:699–711. doi: 10.1007/s00428-007-0412-9. [DOI] [PubMed] [Google Scholar]
- 47.Lassmann S., Kreutz C., Schoepflin A., Hopt U., Timmer J., Werner M. A novel approach for reliable microarray analysis of microdissected tumor cells from formalin-fixed and paraffin-embedded colorectal cancer resection specimens. J Mol Med. 2009;87:211–224. doi: 10.1007/s00109-008-0419-y. [DOI] [PubMed] [Google Scholar]
- 48.Penland S.K., Keku T.O., Torrice C., He X., Krishnamurthy J., Hoadley K.A., Woosley J.T., Thomas N.E., Perou C.M., Sandler R.S., Sharpless N.E. RNA expression analysis of formalin-fixed paraffin-embedded tumors. Lab Invest. 2007;87:383–391. doi: 10.1038/labinvest.3700529. [DOI] [PubMed] [Google Scholar]
- 49.Ravo M., Mutarelli M., Ferraro L., Grober O.M., Paris O., Tarallo R., Vigilante A., Cimino D., De Bortoli M., Nola E., Cicatiello L., Weisz A. Quantitative expression profiling of highly degraded RNA from formalin-fixed, paraffin-embedded breast tumor biopsies by oligonucleotide microarrays. Lab Invest. 2008;88:430–440. doi: 10.1038/labinvest.2008.11. [DOI] [PubMed] [Google Scholar]
- 50.Glas A.S., Lijmer J.G., Prins M.H., Bonsel G.J., Bossuyt P.M. The diagnostic odds ratio: a single indicator of test performance. J Clin Epidemiol. 2003;56:1129–1135. doi: 10.1016/s0895-4356(03)00177-x. [DOI] [PubMed] [Google Scholar]
- 51.Cohen J. A coefficient of agreement for nominal scales. Educ Psychol Meas. 1960;20:37–46. [Google Scholar]
- 52.Bland J.M., Altman D.G. Statistical methods for assessing agreement between two methods of clinical measurement. Lancet. 1986;1:307–310. [PubMed] [Google Scholar]
- 53.Monzon F.A., Koen T.J. Diagnosis of metastatic neoplasms: molecular approaches for identification of tissue of origin. Arch Pathol Lab Med. 2010;134:216–224. doi: 10.5858/134.2.216. [DOI] [PubMed] [Google Scholar]
- 54.Varadhachary G.R., Raber M.N., Matamoros A., Abbruzzese J.L. Carcinoma of unknown primary with a colon-cancer profile-changing paradigm and emerging definitions. Lancet Oncol. 2008;9:596–599. doi: 10.1016/S1470-2045(08)70151-7. [DOI] [PubMed] [Google Scholar]
- 55.Monzon F.A., Medeiros F., Lyons-Weiler M., Henner W.D. Identification of tissue of origin in carcinoma of unknown primary with a microarray-based gene expression test. Diagn Pathol. 2010;5:3. doi: 10.1186/1746-1596-5-3. [DOI] [PMC free article] [PubMed] [Google Scholar]
Associated Data
This section collects any data citations, data availability statements, or supplementary materials included in this article.
Supplementary Materials
Pathwork Tissue of Origin Test Kit–FFPE: Included and Excluded Morphologies