

Abstract
Bone morphogenetic protein-6 (BMP-6) suppresses inflammatory genes in renal proximal tubular cells and regulates iron metabolism by inducing hepcidin. In diabetic patients, an increase of myofibroblast progenitor cells (MFPCs), also known as fibrocytes, was found to be associated with decreased BMP-6 expression. We hypothesized that loss of endogenous BMP-6 would aggravate renal injury and fibrosis. Wild type (WT) and BMP-6 null mice underwent unilateral ureteral obstruction. In WT mice, ureteral obstruction down-regulated BMP-6. Obstructed kidneys of BMP-6 null mice showed more casts (1.5-fold), epithelial necrosis (1.4-fold), and brush border loss (1.3-fold). This was associated with more inflammation (1.8-fold more CD45+ cells) and more pronounced overexpression of profibrotic genes for αSMA (2.0-fold), collagen I (6.8-fold), fibronectin (4.3-fold), CTGF (1.8-fold), and PAI-1 (3.8-fold), despite similar BMP-7 expression. Also, 1.3-fold more MFPCs were obtained from BMP-6 null than from WT mononuclear cell cultures, but in vivo only very few MFPCs were observed in obstructed kidneys, irrespective of BMP-6 genotype. The obstructed kidneys of BMP-6 null mice showed 2.2-fold more iron deposition, in association with 3.3-fold higher expression of the oxidative stress marker HO-1. Thus, ureteral obstruction leads to down-regulation of BMP-6 expression, and BMP-6 deficiency aggravates tubulointerstitial damage and fibrosis independent of BMP-7. This process appears to involve loss of both direct anti-inflammatory and antifibrotic action and indirect suppressive effects on renal iron deposition, oxidative stress, and MFPCs.
See related Commentary on page 964
Bone morphogenetic protein-6 (BMP-6) is a member of the transforming growth factor (TGF)-β superfamily. The TGF-β superfamily of growth factors comprises more than 30 members, including activins, inhibins, three TGF-β isoforms, and the family of BMPs.1 BMPs regulate patterning, cell growth, differentiation, and survival in various organ systems throughout development. BMP-6 and BMP-7 share 87% amino acid identity and signal via the type I receptors activin-like kinase ALK2, ALK3, and ALK6.2,3 In the embryonic kidney, BMP-7 is critical for nephron development,4–6 but BMP-4 and BMP-6 can substitute for BMP-7 loss during nephrogenesis.7 In the adult kidney, BMP-7 expression is present in the podocyte and in the distal nephron.8 Administration of recombinant BMP-7 prevents progression of fibrosis in a variety of mouse models of genetic and metabolic renal damage.9–11 BMP-7 expression exerts a protective action on the proximal tubular cell, preventing release of inflammatory mediators12 and counteracting epithelial-to-mesenchymal transition.10
In embryogenesis, BMP-6 is expressed in stromal cells of normal renal tissue.4,13 Proximal tubular cells in culture are protected against oxidant damage by BMP-6 via heme oxygenase (HO)-dependent pathways.14 BMP-6 expression was found to be down-regulated in a congenital rat model of hypertension, leading to renal damage.15 In mice with diabetic nephropathy, BMP-6 levels in renal cortex were significantly lower than in controls.16 This suggests that, along with BMP-7, BMP-6 also is involved in regulation of response to injury in the kidney.
BMP-6 null mice are viable, fertile, and phenotypically characterized by mild sternal ossification defects.17 Recently, BMP-6 was identified as a major regulator of hepcidin expression and thereby of iron homeostasis.18,19 BMP-6 null mice developed massive iron overload in the liver, resembling human juvenile hemochromatosis. Furthermore, BMP-6 is a major regulator of myofibroblast progenitor cells (MFPCs), also known as smooth muscle progenitor cells or fibrocytes.20 MFPCs contribute to scar tissue formation and extracellular matrix accumulation.21 MFPCs have been identified in fibrosis resulting from unilateral ureteral obstruction (UUO).22 In a previous study, we found a 1.6-fold increase of MFPCs in diabetic patients, associated with a 3.9-fold decrease of BMP-6 expression in diabetes-derived MFPCs, compared with control MFPCs.20 We hypothesized that BMP-6 may also be a regulator of MFPCs and resident cells in renal response to injury, and that it might inhibit iron deposition and oxidative stress in the damaged kidney. In the present study, therefore, we induced UUO in BMP-6 null mice and in their wild type (WT) littermates and investigated the effects of endogenous BMP-6 expression on renal damage, inflammation, and fibrosis.
Materials and Methods
Animal Experiments
Outbred male C57Bl/6J×129Sv BMP-6 null mice, in which the 3′ end of exon 2 of the BMP-6 gene was deleted by insertion of a neomycin resistance gene,17 were mated with female C57Bl/6J mice. From their offspring, female BMP-6 null mice and their female WT littermates were used for the present study. Genotyping was performed on 100 to 200 ng DNA isolated from earmarks, following a standard procedure. Primers with the following sequence were used: 5′ BMP-6, 5′-TCCCCACATCAACGACACCA-3′ and 3′ BMP-6, 5′-TCCCCACCACACAGTCCTTG-3′ (Eurogentec, Seraing, Belgium). All mice were housed in standard cages in a room with constant temperature, on a 12-hour light-dark cycle. Animals were fed a standard pellet laboratory chow and had free access to water. The experiments were performed with the approval of the Experimental Animal Ethics Committee of the University of Utrecht.
Unilateral ureteral obstruction was induced in BMP-6 null mice and their WT littermates (n = 6 per group). Mice were anesthetized by inhalation of isoflurane-oxygen. Under aseptic conditions, a small incision was made in the flank, and the left ureter was permanently ligated at two points. After 14 days, the mice were anesthetized by intraperitoneal injection of ketamine-xylazine-atropine and were exsanguinated. Sham-operated mice (n = 3 per group) were also studied. Urine collection was performed before sacrifice. Plasma creatinine was measured with an enzymatic assay (J2L Elitech, Labarthe Inard, France). Albuminuria was determined by sandwich enzyme-linked immunosorbent assay (Bethyl Laboratories, Montgomery, TX).
Renal Histology and Immunohistochemistry
Renal tissue was paraffin-embedded and cut into 3-μm sections. Periodic acid Schiff staining and Prussian Blue staining were performed to assess morphology and iron deposition. Additionally, 4-μm liver sections were made to assess iron content and fibrosis (Sirius Red). For assessment of iron content in liver and kidney, digital scoring was performed using Adobe Photoshop CS4 version 11.0.2 (Adobe Systems, Uxbridge, UK) and ImageJ software version 1.40 (NIH, Bethesda, MD). Renal tubular injury was assessed by determining the percentage of affected tubules per 15 cortical fields at ×200 magnification, according to the following criteria and as described previously23: tubular dilation, epithelial necrosis, cast deposition, and loss of brush border. Injury was graded on a scale from 0 to 5 (0 = 0%, 1 = 0 to 10%, 2 = 10 to 25%, 3 = 25 to 50%, 4 = 50 to 75%, and 5 = 75 to 100%) and was scored by an observer blind to the identity of the section. Immunostaining for E-cadherin was performed on FFPE slides blocked for endogenous peroxidase and pretreated by heating in citrate buffer. Sections were incubated for 90 minutes with primary antibody (ab53033, Abcam, Cambridge, UK). PowerVision poly-HRP-anti-rabbit IgG was used as secondary antibody (ImmunoLogic, Duiven, The Netherlands). Photographs were taken on a Nikon Eclipse E800 microscope with a Nikon DXM1200 digital camera using the Nikon ACT-1 software version 2.70 (Nikon Netherlands, Lijnden, The Netherlands).
Immunofluorescence
For pSmad1/5/8 immunostaining, freshly cut sections were deparaffinized, blocked for endogenous peroxidase (1% H2O2 in methanol) and pretreated by heating in EDTA buffer for 15 minutes. After 30 minutes blocking with 3% bovine serum albumin, sections were incubated overnight with rabbit anti-pSmad1/5/8 antibody (#9511; Cell Signaling Technology, Danvers, MA) in a 1/200 dilution. PowerVision poly-HRP-anti-rabbit IgG was used as secondary antibody (ImmunoLogic, Duiven, The Netherlands) and amplified with fluorophore tyramide amplification reagent (Perkin-Elmer, Boston, MA). Slides were counterstained with TOPRO-3 (Molecular Probes, Eugene, OR), mounted in Vectashield (Vector Laboratories, Burlingame, CA), and visualized by confocal laser scanning microscopy. Digital quantification of staining intensity was performed using ImageJ software (NIH).
Immunostaining for CD45 was performed on deparaffinized sections, which were blocked for endogenous peroxidase and pretreated by heat-based antigen retrieval in citrate buffer. Sections were incubated overnight with a 1:25 dilution of rat-anti-mouse anti-CD45 antibody (clone 30-F11; BD Pharmingen, San Diego, CA). Subsequently, slides were incubated with horseradish peroxidase (HRP)-conjugated rabbit anti-rat IgG and HRP-conjugated swine anti-rabbit IgG (both from Dako, Glostrup, Denmark), and were amplified with fluorophore tyramide amplification reagent (Perkin-Elmer). Slides were counterstained with TOPRO-3 (Molecular Probes), mounted in Vectashield (Vector Laboratories), and visualized by confocal laser scanning microscopy. The number of CD45+ cells per high-power field (×400) was counted in 15 fields and scored by an observer blind to the identity of the section.
Immunostaining for α smooth muscle actin (αSMA) was performed by incubating FFPE slides with a mouse-anti-αSMA antibody (Sigma-Aldrich, St Louis, MO), which was biotinylated using an ARK kit (Dako) and streptavidin-HRP and amplified with fluorophore tyramide amplification reagent (Perkin-Elmer). Digital quantification of staining intensity was performed using ImageJ software (NIH).
Incorporation of MFPCs in the kidney was evaluated by double immunofluorescence staining for CD45 and αSMA. Paraffin-embedded sections were stained for CD45 as described above. After tetramethylrhodamine isothiocyanate-tyramide amplification, a second peroxidase blocking step was performed for 30 minutes using 0.3% H2O2 in phosphate-buffered saline. Subsequently, slides were incubated with a mouse-anti-αSMA antibody (Sigma-Aldrich), which was biotinylated using an ARK kit (Dako) and streptavidin-HRP and amplified with fluorophore tyramide amplification reagent. Visualization was performed by confocal laser scanning microscopy. Only cells identified by red membranous CD45 staining surrounding green cytoplasmic αSMA staining together with a blue nucleus were counted as MFPCs. The number of MFPCs per high-power field (×400) was counted in 15 fields per slide in a blinded fashion.
Quantitative PCR
Renal cortex was harvested by dissecting small caps of the upper and the lower poles. Before homogenization, absence of medulla was checked in frozen sections of the cut surface. Total RNA was extracted from frozen renal cortex using RNeasy columns (Qiagen, Valencia, CA). For analysis of localization of BMP-6 expression in WT mice (n = 4), glomeruli, cortical tubulointerstitium, and medulla were microdissected from 10-μm cryosections per sample and put on a PALM MembraneSlide (Carl Zeiss MicroImaging, Munich, Germany), after which the tissue was cut and catapulted with a PALM MicroBeam into the cap of a 0.5-ml tube. Concentration of mRNA was measured with a spectrophotometer (NanoDrop; Thermo Scientific, Wilmington, DE). We used 3 μg of undiluted RNA for cDNA synthesis, using a Superscript II reverse transcriptase system (Invitrogen, Carlsbad, CA).
After cDNA synthesis, expression of mRNA was assessed by quantitative real-time PCR using TaqMan gene expression assays with the following predesigned probes and primers (Applied Biosystems, Foster City, CA): Mm00775963_g1 (Id1), Mm00711781_m1 (Id2), Mm00492575_m1 (Id3), Mm00484738_m1 (Smad6), Mm01340178_m1 (BMP-2), Mm00432087_m1 (BMP-4), Mm00432091_m1 (BMP-5), Mm00483888_m1 (COL1A2), Mm01546133_m1 (ACTA2, αSMA), Mm01256734_m1 (FN1), Mm00432102_m1 (BMP7), Mm00432095_m1 (BMP-6), Mm00441724_m1 (TGF-β1), Mm00515790_g1 (CTGF), Mm00435860_m1 (PAI-1), Mm00516004_m1 (HO-1), Mm00486918 (E-cadherin), Mm00446190_m1 (IL-6), Mm00441242_m1 (MCP-1), and Mm00446973_m1 (TBP). Gene quantification was performed in duplicate on a 7900 real-time PCR system (Applied Biosystems) using standard cycling conditions as recommended by the manufacturer. TBP was used as internal reference.
Culture of Myofibroblast Progenitor Cells
Myofibroblast progenitor cells, defined as αSMA+ and collagen-secreting cells cultured from peripheral blood mononuclear cells, were cultured as described previously,20 according to a protocol adapted from Bucala and colleagues.24,25 Mononuclear cells were isolated from the spleen of BMP-6 null mice and WT mice and were counted with a hemocytometer. Next, 5 × 10⁶ mononuclear cells per well were plated on fibronectin-coated dishes in Dulbecco's modified Eagle's medium supplemented with 20% heat-inactivated fetal bovine serum, and antibiotics (penicillin 100 U/ml and streptomycin 100 μg/ml; Invitrogen, Carlsbad, CA). After 4 days in culture, cells were detached, using trypsin-EDTA and a cell scraper. The MFPCs were identified by staining for αSMA-PE (R&D Systems, Minneapolis, MN) and for collagen I-fluorescein isothiocyanate (Sigma-Aldrich) and were counted by flow cytometry (Beckman Coulter, Fullerton, CA). Isotype-stained samples served as negative controls.
Statistical Analysis
Data are presented as means ± SEM. Mann-Whitney U-test was used for assessment of histological parameters. Student's t-test was used for analysis of fluorescence-activated cell sorting data and for comparison of mRNA expression between BMP-6 null mice and WT mice. For comparisons between multiple groups (sham-operated vs contralateral vs obstructed kidneys), analysis of variance with Bonferroni's correction was performed. Values of P < 0.05 were considered to be significant (two-tailed). Calculations were performed using GraphPad Prism software version 4.00 for Windows (GraphPad Software, San Diego, CA).
Results
Renal BMP Signaling Activity Is Decreased in BMP-6 Null Mice
In WT mice, mRNA expression of BMP-6 is localized mainly to glomeruli and cortical tubulointerstitium. In renal medulla, BMP-6 expression is low: 10-fold lower than in glomeruli (P < 0.05) and 15-fold lower than in cortical tubulointerstitium (P < 0.05) (Figure 1A).
Figure 1.

Renal BMP signaling activity is decreased in BMP-6 null mice. A: Gene expression analysis by quantitative PCR on microdissected renal tissue showed that BMP-6 mRNA is present mainly in renal cortex from WT adult mice. Expression is 1.5-fold higher in cortical tubulointerstitium (TI), compared with glomeruli (P < 0.05). In renal medulla, expression is 10-fold lower than in glomeruli (P < 0.05), and 15-fold lower than in cortical TI (P < 0.05). *P < 0.05 vs glomeruli, **P < 0.05 vs cortical TI. B: PAS-stained sections from renal tissue of sham-operated mice, showing no difference in renal histology between WT and BMP-6 null mice. Scale bar = 50 μm. C: Immunofluorescent staining for pSmad1/5/8 (green) showed decreased nuclear staining in BMP-6 null mice, compared with WT mice; blue indicates nuclear counterstaining (TO-PRO-3). Scale bar = 50 μm. Digital quantification of pSmad1/5/8 staining showed a significant decrease in BMP-6 null mice, compared with WT mice. *P < 0.05 vs WT mice. D: Gene expression analysis of the BMP target genes Id2, Id3, and Smad6 showed a significant reduction in BMP-6 null mice, compared with WT mice. Id1 mRNA showed a trend toward decrease, although this was not statistically significant. *P < 0.05 vs WT mice. E: Gene expression of BMP-2, BMP-4, and BMP-5 was significantly elevated in BMP-6 null mice, compared with WT mice. *P < 0.05 vs WT mice.
Nuclear phosphorylated Smad1/5/8 (pSmad1/5/8) was prominent in the proximal tubule in WT mice, but was significantly decreased in BMP-6 null mice (mean intensity, 23 ± 4 vs 15 ± 4; P = 0.007; Figure 1C), indicating less BMP signaling activity. Consistent with this, BMP target genes Id2, Id3, and Smad6 were down-regulated in renal cortex of BMP-6 null mice, compared with WT mice. Id1 mRNA was not significantly different, although there was a trend toward lower expression in BMP-6 null cortex (Figure 1D). Remarkably, the decline in BMP signaling activity took place despite an increased expression of BMP-2 (P = 0.012), BMP-4 (P = 0.002), and BMP-5 mRNA (P = 0.008) in BMP-6 null mice, compared with WT mice (Figure 1E).
BMP-6 Deficiency Is Associated with More Renal Damage
In sham-operated BMP-6-deficient and WT mice, no differences were observed regarding kidney weight, body weight, albuminuria, and plasma creatinine (Table 1), nor in glomerular or tubulointerstitial morphology (Figure 1B). Renal function of mice subjected to UUO was not impaired and did not differ between BMP-6 null mice and WT mice (Table 1). Albumin excretion in all groups was within the normal range for mice. In sham-operated mice, there was no statistically different number of glomeruli in BMP-6 null mice (8.5 ± 1.3 glomeruli/mm2) versus WT mice (8.9 ± 1.0 glomeruli/mm2). At 14 days after UUO, however, the obstructed kidneys of BMP-6 null mice showed increased tubulointerstitial damage (Figure 2A), characterized by more extensive tubular epithelial necrosis (P = 0.022), protein casts (P = 0.014), and brush border loss (P = 0.044; Figure 2B).
Table 1.
Weights and Functional Renal Parameters of WT and BMP-6 Null Mice
| Variable | WT SHM | BMP-6 null SHM | WT UUO | BMP-6 null UUO |
|---|---|---|---|---|
| Body weight (g) | 25.2 ± 1.7 | 23.6 ± 1.4 | 20.8 ± 1.5 | 23.6 ± 1.9 |
| Kidney weight, nonobstructed kidney (mg) | 134.8 ± 1.9 | 133.3 ± 5.5 | 187.2 ± 4.7 | 180.4 ± 4.3 |
| Kidney weight, obstructed kidney (mg) | — | — | 145.0 ± 5.4 | 124.4 ± 4.1 |
| Plasma creatinine (mg/dL) | 0.18 ± 0.08 | 0.25 ± 0.03 | 0.17 ± 0.03 | 0.21 ± 0.03 |
| Albuminuria (mg/g Cr)⁎ | 157.1 ± 12.5 | 61.7 ± 5.9 | 116.3 ± 14.8 | 84.0 ± 9.5 |
Data are presented as means SEM. SHM, sham-operated; UUO, unilateral ureteric obstruction; WT, wild type.
There was a statistically significant lowering in albuminuria in sham-operated BMP-6 null mice, compared with WT mice (P < 0.05). Albuminuria values were not elevated to pathological levels.
Figure 2.
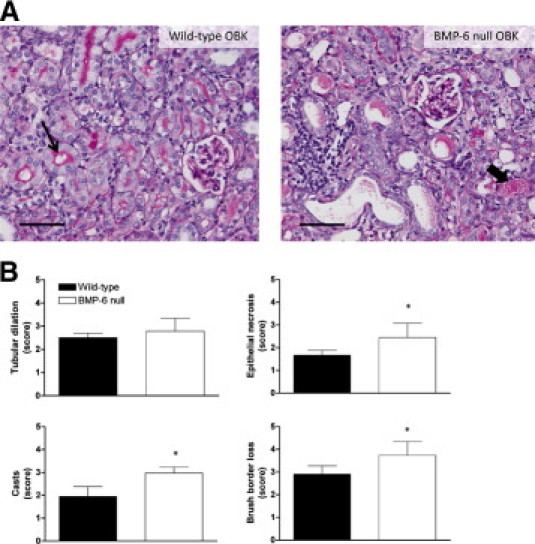
BMP-6 deficiency is associated with more renal damage. Semiquantitative assessment was performed for four parameters: tubular dilation, epithelial necrosis, casts, and brush border loss. A: Representative PAS-stained sections of obstructed kidneys (OBK) from both WT and BMP-6 null mice. In WT mice, the tubular lumen is often lined with a fine, pink brush border (thin arrow); this characteristic has been lost in BMP-6 null mice. Epithelial flattening, necrosis, and cast formation (thick arrow) are more prominent in BMP-6 null mice. Scale bar = 50 μm. B: Scoring for parameters of tubular damage; 15 fields were scored per section (at an original magnification of ×200). *P < 0.05 vs WT mice.
BMP-6 Deficiency Is Associated with Increased Inflammation
A 1.8-fold increase of CD45+ leukocytes was present in the tubulointerstitium of obstructed kidneys of BMP-6 null mice, compared with WT mice (P = 0.033). In contralateral kidneys of both groups, <1 CD45+ cell high-power field (×400) was present (Figure 3, A and B). MCP-1 and IL-6 mRNA were both significantly increased in obstructed kidneys, but this did not differ between BMP-6 null mice and WT mice. MCP-1 mRNA, however, was significantly increased (3.2-fold) in contralateral kidneys of BMP-6 null mice, compared with those of WT mice (Figure 3C).
Figure 3.

BMP-6 deficiency is associated with increased inflammation. Inflammation was assessed by immunofluorescent staining for the hematopoietic cell marker CD45. A: Representative sections from obstructed kidneys show infiltration of CD45+ cells (membranous/cytoplasmic staining) into the interstitial space. Contralateral kidneys and sham-operated kidneys barely show any CD45+ cells in the tubulointerstitial space. Scale bar = 50 μm. B: Scoring for CD45+ cells shows a 1.8-fold increase in obstructed kidneys from BMP-6 null mice, compared with obstructed kidneys from WT mice. C: Gene expression analysis for the inflammatory mediators IL-6 and MCP-1 showed a tendency toward increased expression in obstructed kidneys of BMP-6 null mice, compared with WT mice. Expression of MCP-1 was significantly higher in CLK of BMP-6 null mice, compared with WT. CLK, contralateral kidneys from mice undergoing unilateral ureteric obstruction (UUO); OBK, obstructed kidneys from mice undergoing UUO; SHM, sham-operated control mice. *P < 0.05 vs WT mice; **P < 0.05 vs SHM; ***P < 0.05 vs CLK.
BMP-6 Deficiency Is Associated with Increased Expression of ECM Genes and αSMA
mRNA expression of procollagen type 1α2 (COL1A2), α smooth-muscle actin (ACTA2), and fibronectin (FN1) was increased in obstructed kidneys of both BMP-6 null and WT mice, but to a significantly greater extent in BMP-6 null mice (respectively 6.8-fold, 2.0-fold, and 4.3-fold increase). Of note, expression of COL1A2, ACTA2, and FN1 was also higher in contralateral kidneys of BMP-6 null mice, compared with WT mice. Notably, COL1A2 was significantly elevated even in sham-operated BMP-6 null mice. FN1 and ACTA2 levels were increased in obstructed, as well as in contralateral kidneys of BMP-6 null mice after UUO, but not in sham-operated BMP-6 null mice (Figure 4).
Figure 4.
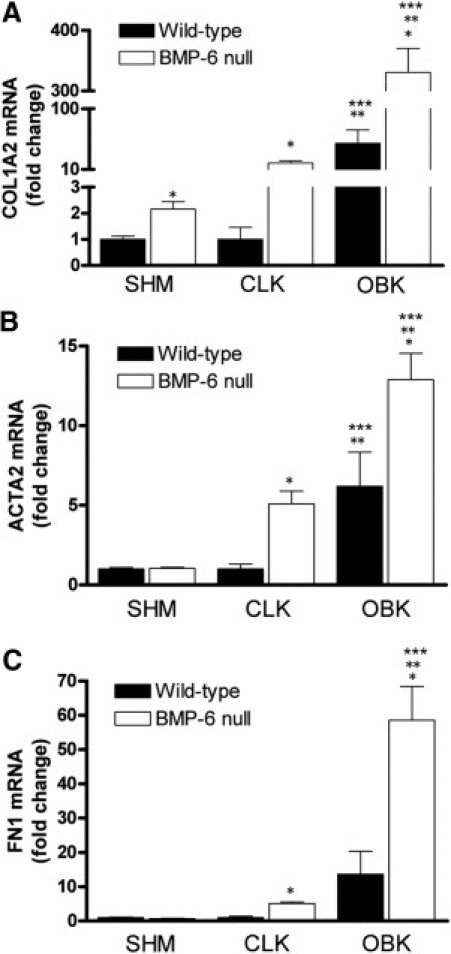
BMP-6 deficiency is associated with increased expression of αSMA and ECM genes. Gene expression analysis was performed on renal cortical tissue with quantitative PCR. A–C: A significant increase in expression between obstructed kidneys of BMP-6 null mice, compared with WT mice, was found for procollagen 1α2 (COL1A2), αSMA (ACTA2), and fibronectin (FN1). CLK, contralateral kidneys from mice undergoing UUO; OBK, obstructed kidneys from mice undergoing UUO; SHM, sham-operated control mice. *P < 0.05 vs WT mice; **P < 0.05 vs SHM; ***P < 0.05 vs CLK.
In concert with the increased expression of ECM genes, a significant up-regulation of αSMA protein expression (as a marker for myofibroblasts) was detected by immunofluorescence in obstructed kidneys, compared with sham-operated and contralateral kidneys. Importantly, in obstructed kidneys of BMP-6 null mice, αSMA intensity was 1.3-fold higher, compared with obstructed kidneys of WT mice (P = 0.029; Figure 5).
Figure 5.

BMP-6 deficiency is associated with increased αSMA intensity. A: Immunofluorescence staining was performed on renal FFPE tissue. Scale bar = 50 μm. B: Staining intensity of αSMA was significantly higher in BMP-6 null mice, compared with control animals. The settings for digital quantification were too high to detect any staining in sham-operated and contralateral kidneys. Vessels were excluded from the analysis. CLK, contralateral kidneys from mice undergoing UUO; OBK, obstructed kidneys from mice undergoing UUO; SHM, sham-operated control mice. *P < 0.05 vs WT mice.
BMP-6 Deficiency Is Not Associated with Change in E-Cadherin Expression
E-cadherin immunohistochemistry revealed strong basal staining in distal tubules, and in thick and thin ascending limbs of the loop of Henle in sham-operated and contralateral kidneys. There was some very faint staining of lateral junctions in proximal tubules as well. In obstructed kidneys, presence of E-cadherin was especially prominent in lateral junctions in distal tubules. There was no difference in E-cadherin immunohistochemistry between BMP-6-deficient and WT mice (see Supplemental Figure S1A at http://ajp.amjpathol.org). There was also no difference in E-cadherin mRNA expression between sham-operated, contralateral, or obstructed kidneys in either genotype (see Supplemental Figure S1B at http://ajp.amjpathol.org).
BMP-6 Deficiency Is Associated with Up-Regulation of TGF-β1, CTGF, and PAI-1
BMP-7 levels were similar in kidneys of sham-operated BMP-6 null mice and WT mice, and UUO resulted in a significant down-regulation of BMP-7 in the obstructed but not in the contralateral kidney, compared with sham-operated kidneys, irrespective of BMP-6 genotype (P < 0.05; Figure 6A). In renal cortex of WT mice BMP-6 mRNA was also detectable, and after UUO it was down-regulated in the obstructed kidney (P < 0.05; Figure 6B), even more profoundly than BMP-7. Gene expression levels of BMP-2, BMP-4, and BMP-5 were not significantly different in obstructed kidneys, compared with contralateral kidneys and sham-operated mice (data not shown). TGF-β1 expression was up-regulated in BMP-6 KO mice, compared with WT mice. For sham-operated kidneys and contralateral kidneys after UUO, this up-regulation was 1.8-fold (P = 0.004) and 2.4-fold (P = 0.008), respectively. In obstructed kidneys, TGF-β1 mRNA levels were highly variable and, despite a 1.8-fold difference of the means, statistical significance was not reached (P = 0.25; Figure 6C). Expression of the TGF-β1 target gene plasminogen activator inhibitor-1 (PAI-1) was 3.8-fold higher in obstructed kidneys of BMP-6 null mice, compared with sham-operated mice (P = 0.001; Figure 6D), and the expression of connective tissue growth factor (CTGF) was higher in obstructed (2.0-fold; P = 0.01), contralateral (3.5-fold; P = 0.009), and sham-operated (3.9-fold; P = 0.04) kidneys of BMP-6 null mice, compared with WT mice (Figure 6E).
Figure 6.

BMP-6 deficiency is associated with up-regulation of profibrotic genes. Gene expression analysis was performed on renal cortical tissue with quantitative PCR. A: BMP-7 expression, although significantly down-regulated in obstructed kidneys, showed no difference between BMP-6 null mice and WT mice. B: BMP-6 expression was significantly down-regulated in obstructed kidneys of WT mice. C: TGF-β1 expression was up-regulated in BMP-6 KO mice, compared with WT mice. D: PAI-1 was up-regulated in obstructed kidneys of BMP-6 null mice, compared with WT animals. E: CTGF expression was significantly up-regulated in BMP-6 null mice, compared with WT animals. CLK, contralateral kidneys from mice undergoing UUO; OBK, obstructed kidneys from mice undergoing UUO; SHM, sham-operated control mice. *P < 0.05 vs WT mice; **P < 0.05 vs SHM; ***P < 0.05 vs CLK.
BMP-6 Deficiency Is Associated with Increased Numbers of MFPCs
The number of mononuclear cells isolated from the spleen at t = 0 was not significantly different in BMP-6 null mice, compared with WT mice. After 4 days of culture, however, the number of MFPCs (as determined by αSMA staining) was significantly higher in BMP-6 null mice than in WT mice, both in sham-operated (% of adherent cells 46 ± 7%, vs 19 ± 4% in WT; P = 0.008) and in UUO mice (% of adherent cells 49 ± 7%, vs 37 ± 5% in WT; P = 0.024) (Figure 6A). Although UUO resulted in higher numbers of MFPCs in WT mice (19 ± 4%, vs 37 ± 5% in UUO; P = 0.015), this was not the case in BMP-6 null mice, for which numbers of MFPCs found were similar to those under control conditions (46 ± 7%, vs 49 ± 7 in UUO; P = 0.74) (Figure 7A).
Figure 7.

BMP-6 deficiency is associated with increased numbers of circulating MFPCs, which do not, however, seem to incorporate into the kidney. Mononuclear cells were isolated from the spleen, and equal amounts were cultured on fibronectin-coated dishes to promote MFPC differentiation. The MFPCs were stained for αSMA and subjected to fluorescence-activated cell sorting. A: Percentage of outgrowth of αSMA+ cells, showing significantly higher outgrowth in BMP-6 null mice, compared with WT mice. UUO resulted in higher outgrowth levels of MFPCs in WT mice, but not in BMP-6 null mice. B: Immunofluorescence from representative sections of obstructive kidneys, showing that CD45+ and αSMA+ cells are found in close proximity to each other; however, only rarely could double-positive cells be found. Scale bar = 50 μm. C: Number of fluorescent cells per square millimeter in obstructive kidneys from WT and BMP-6 null mice, compared with the number of αSMA+ and CD45+ cells; only minimal quantities of CD45+/αSMA+ (double-positive) cells can be detected. *P < 0.05 vs WT mice; **P < 0.05 vs sham-operated control mice.
Incorporation of MFPCs in Obstructed Kidneys Seems Extremely Limited
Myofibroblast progenitor cells in renal tissue were assessed by double staining for CD45 and αSMA. In sham-operated kidneys and contralateral kidneys from WT and BMP-6 null mice, no double-positive cells were observed. In obstructed kidneys of BMP-6 null, as well as WT mice, infiltration of CD45+ cells was often associated with presence of αSMA+ cells (Figure 7B), but only very rarely could these be identified with certainty as MFPCs by membranous CD45 staining surrounding cytoplasmic αSMA staining together with a nucleus, and there was no difference in frequency between the two genotypes (Figure 7C).
BMP-6 Deficiency Results in Increased Tubular Iron Deposition and HO-1 Expression
Prussian Blue staining showed heavy iron deposition in the liver of BMP-6 null mice, and slight iron deposition in the heart, compared with WT mice (see Supplemental Figure S2 at http://ajp.amjpathol.org). There was no significant iron deposition in the endocrine system (adrenals and endocrine pancreas) (see Supplemental Figure S2 at http://ajp.amjpathol.org).
No iron deposits were seen in renal tissue from sham-operated or contralateral kidneys of BMP-6 null and WT mice. Obstructed kidneys contained focal iron accumulations in tubular cells, more abundantly in BMP-6 null mice than in WT mice (P = 0.048; Figure 8, A and B). In addition, heme oxygenase-1 (HO-1) mRNA was increased 3.3-fold in obstructed kidneys of BMP-6 null mice (P = 0.0043; Figure 8C).
Figure 8.

BMP-6 deficiency results in increased tubular iron deposition and HO-1 expression. Prussian Blue staining was performed to evaluate for iron deposition. A: In sham-operated and contralateral kidneys, iron is not present; in obstructed kidneys, however, some staining can be seen (asterisk in Wild-type OBK). Considerable tubular iron deposits are seen in obstructed kidneys of BMP-6 null mice (asterisks in BMP-6 null OBK). Scale bar = 50 μm. B: Digital quantification of Prussian Blue staining confirms a significantly increased deposition in renal cortex of obstructed kidneys from BMP-6 null mice, compared with WT mice. C: Gene expression analysis for HO-1 shows a significant down-regulation in BMP-6 null sham-operated control animals, compared with WT mice. In obstructed kidneys, however, BMP-6 deficiency results in significantly higher mRNA expression for HO-1. CLK, contralateral kidneys from mice undergoing UUO; OBK, obstructed kidneys from mice undergoing UUO; SHM, sham-operated control mice. *P < 0.05 vs WT mice; **P < 0.05 vs SHM; ***P < 0.05 vs CLK.
Discussion
Unilateral ureteral obstruction is characterized by hydronephrosis and tubular dilation, which cause tubular cell damage and interstitial inflammatory infiltration, ultimately leading to fibrosis.26 All these manifestations were aggravated in the obstructed kidney of BMP-6-deficient mice. Thus, normal endogenous BMP-6 expression, which is present mainly in the cortex, significantly attenuated the adverse effects of ureteral obstruction. This protective effect of BMP-6 appeared to involve increased BMP-signaling, as well as concomitantly decreased TGF-β1 signaling and reduction of downstream profibrotic gene expression. BMP-6 expression also reduced inflammatory activity and diminished iron deposition and oxidative stress. Although BMP-6 deficiency was associated with an increase of MFPCs in the circulation, this was not reflected by higher numbers of CD45+ (blood-borne) myofibroblasts in the damaged kidney.
Despite similar BMP-7 mRNA expression and increased BMP-2, BMP-4, and BMP-5 expression, pSmad1/5/8 was decreased in BMP-6 null mice. Consistently, these mice had lower expression levels of prototypical BMP target genes, suggesting complementary functions (rather than redundancy of BMP-6 and other BMPs) in regulating BMP transcriptional activity in the adult kidney.
The parallel down-regulation of BMP-6 and BMP-7 that we observed in obstructed WT kidneys is consistent with previous observations in experimental diabetic nephropathy.16 Like BMP-7, BMP-6 has anti-inflammatory activity,12 it can reverse TGF-β1-induced changes in tubular cells,27 and it inhibits TGF-β1-induced expression of the profibrotic genes CTGF and PAI-I with a potency at least equal to that of BMP-7.20 TGF-β1 is known to induce its own expression.28 This feed-forward effect might be dampened by the inhibitory activity of BMP-6 on transcriptional activity downstream of TGF-β1.20 BMP-6 deficiency could thus lead to release of the TGF-β1 autoinductive loop—although it should also be kept in mind that TGF-β1 is highly regulated posttranscriptionally.29 In addition, the increased iron deposition and HO-1 expression in obstructed kidneys of BMP-6 null mice suggest that oxidative stress might have contributed to the elevated expression levels of TGF-β1, and of its downstream target genes encoding CTGF, PAI-1, procollagen1α2, FN, and αSMA.30 Most likely, the increased iron accumulation itself is a direct result of decreased hepcidin expression in BMP-6-deficient mice.18,19 CTGF, as an oxidative stress- and TGF-β1-responsive gene, might have further aggravated the imbalance between TGF-β1 and BMP activity in BMP-6-deficient mice, because CTGF has a well-established inhibitory effect on both BMP-4 and BMP-7,31,32 and an enhancing effect on TGF-β1 signaling.31,33
E-cadherin loss is a hallmark of epithelial-to-mesenchymal transition accompanying renal fibrosis.34 However, we did not observe loss of E-cadherin staining in obstructed kidneys, but rather a shift in its localization toward lateral junctions. BMP-6 null mice showed no difference in E-cadherin staining, compared with WT mice, suggesting that epithelial-to-mesenchymal transition is not a major element in the increased renal damage associated with loss of BMP-6.
Mononuclear cell infiltration is an important factor in the pathogenesis of renal obstructive remodeling.26,35 We observed a strong increase of infiltration by CD45+ cells in the obstructed kidney of BMP-6-deficient mice, compared with WT mice, although there was only a small, nonsignificant trend toward higher MCP-1 and IL-6 expression. Direct inhibition by BMP-6 of pro-inflammatory gene expression in tubular epithelial cells,12 as well as direct anti-proliferative effects on macrophages36 and on T- and B-lymphocytes,37,38 might account for at least part of the observed increase of inflammatory activity in BMP-6-deficient mice. In the present study, increased oxidative stress due to iron accumulation might also have played a role.
We have previously observed that mononuclear cells of patients with diabetes contain more MFPCs, in association with lower BMP-6 mRNA expression by these cells.20 In the present study, BMP-6 null mice had higher numbers of circulating MFPCs. In WT mice, UUO induced an increase of circulating MFPCs to numbers near those in sham-operated BMP-6 null mice. In BMP-6 null mice, the already elevated number of MFPCs did not increase further after UUO, suggesting an overriding effect of BMP-6. Alternatively, increased homing of MFPCs in BMP-6 null mice could have reduced their number in the circulation. Nonetheless, irrespective of BMP-6 genotype, only very few interstitial tissue myofibroblasts could be positively identified as being derived from circulating MFPCs. Differentiation of MFPCs to tissue myofibroblasts and loss of hematopoietic markers might have hampered their detection by immunohistochemistry,39,40 and in another study with Y-chromosome tracking in bone marrow transplanted mice only few MFPCs were identified in kidneys damaged by UUO or ischemia-reperfusion.41 These findings should be interpreted with caution, and at this point we have insufficient arguments to state that circulating MFPCs participate in renal fibrogenesis. Nevertheless, it cannot be ruled out completely that, through paracrine effects of secreted cytokines and growth factors, even small numbers of BMP-6-deficient MFPCs might favor profibrotic changes.42
Finally, we observed increased iron deposition in obstructed but not in unobstructed kidneys of BMP-6 null mice, suggesting that BMP-6 deficiency aggravates iron deposition in the tubulointerstitium secondary to renal tissue damage. Although the exact pathophysiological significance of tubular iron accumulation is unknown, it has been shown by specialized techniques to be present at higher levels in tubules of animals and of human patients with chronic kidney disease, compared with controls.43 In diabetic nephropathy, iron accumulation does seem to correlate with tubular damage.44
Iron provokes oxidative stress, which is an important factor in progressive renal injury.45 As we have mentioned above, oxidative stress might have been responsible in part for the expression of profibrotic genes, including TGF-β1 and CTGF, as well as of HO-1, which serves to protect the kidney and other tissues against oxidant injury.46 HO-1 is a potent marker of oxidative stress.47 Both UUO48,49 and iron overload50 have independently been shown to induce HO-1 overexpression. Control kidneys of BMP-6-deficient mice had lower HO-1 expression than those of WT mice, consistent with previous cell culture studies showing induction of HO-1 by BMP-6 stimulation of proximal tubular cells.14 However, the obstructed kidneys of BMP-6-deficient mice had much higher HO-1 expression than those of WT mice, most likely due to an overriding effect of other inducers of this stress-responsive gene, including oxidative injury.
Altogether, we have shown that BMP-6 null mice subjected to UUO have an increased susceptibility to development of tubular damage and renal interstitial fibrosis. Rather than an increase of circulating MFPCs per se, the loss of direct BMP-6 effects on signaling and gene expression in resident kidney cells, as well as altered iron metabolism and concomitant increase in oxidative stress, are likely key factors responsible for increased inflammatory and fibrotic activity in obstructed BMP-6-deficient kidneys. The observation that expression levels of prototypical BMP target genes in BMP-6 null mice are lower than in WT mice, despite similar BMP-7 expression, suggests that BMP-6 and BMP-7 may have complementary functions.
Acknowledgments
We thank Martijn Haagen, Kim van Dorenmalen, Christine van Altena, and Vera Verhage for excellent technical assistance.
Footnotes
Supported by the Netherlands Organization for Scientific Research (Mosaic grant no. 017.003.037) and by the Dutch Kidney Foundation (grant no. C05.2144).
Supplemental material for this article can be found at http://ajp.amjpathol.org or at doi: 10.1016/j.ajpath.2010.12.005.
Supplementary data
BMP-6 deficiency has no effect on E-cadherin expression. A: Immunohistochemistry shows equal E-cadherin expression between WT and BMP-6 null mice. E-cadherin expression was prominent mainly in distal tubules in the cortex. Obstruction resulted in a shift from basal toward more prominent lateral staining of E-cadherin. B: Gene expression for E-cadherin was not different between sham-operated, contralateral, and obstructed kidneys from either WT or BMP-6 null mice. CLK, contralateral kidneys from mice undergoing unilateral ureteral obstruction (UUO); OBK, obstructed kidneys from mice undergoing UUO; SHM, sham-operated control mice.
Iron deposition in extrarenal organs of BMP-6 null mice. A: Liver tissue of BMP-6 null mice with massive iron accumulation, compared with WT mice. B: Pancreatic tissue of BMP-6 null mice showing rare iron deposition in the exocrine acini (wedge), but not in the endocrine pancreas (islets of Langerhans). C: Adrenal of a BMP-6 null mouse with no evidence of iron accumulation. D: Myocardium of BMP-6 null mice shows very focal and slight iron deposition (wedge). In myocardium of WT mice, no iron depositions whatsoever were detected (not shown). Original magnification, ×200 (all images).
References
- 1.Kingsley D.M. The TGF-beta superfamily: new members, new receptors, and new genetic tests of function in different organisms. Genes Dev. 1994;8:133–146. doi: 10.1101/gad.8.2.133. [DOI] [PubMed] [Google Scholar]
- 2.ten Dijke P., Yamashita H., Sampath T.K., Reddi A.H., Estevez M., Riddle D.L., Ichijo H., Heldin C.H., Miyazono K. Identification of type I receptors for osteogenic protein-1 and bone morphogenetic protein-4. J Biol Chem. 1994;269:16985–16988. [PubMed] [Google Scholar]
- 3.Ebisawa T., Tada K., Kitajima I., Tojo K., Sampath T.K., Kawabata M., Miyazono K., Imamura T. Characterization of bone morphogenetic protein-6 signaling pathways in osteoblast differentiation. J Cell Sci. 1999;112:3519–3527. doi: 10.1242/jcs.112.20.3519. [DOI] [PubMed] [Google Scholar]
- 4.Dudley A.T., Robertson E.J. Overlapping expression domains of bone morphogenetic protein family members potentially account for limited tissue defects in BMP7 deficient embryos. Dev Dyn. 1997;208:349–362. doi: 10.1002/(SICI)1097-0177(199703)208:3<349::AID-AJA6>3.0.CO;2-I. [DOI] [PubMed] [Google Scholar]
- 5.Godin R.E., Takaesu N.T., Robertson E.J., Dudley A.T. Regulation of BMP7 expression during kidney development. Development. 1998;125:3473–3482. doi: 10.1242/dev.125.17.3473. [DOI] [PubMed] [Google Scholar]
- 6.Vukicevic S., Kopp J.B., Luyten F.P., Sampath T.K. Induction of nephrogenic mesenchyme by osteogenic protein 1 (bone morphogenetic protein 7) Proc Natl Acad Sci USA. 1996;93:9021–9026. doi: 10.1073/pnas.93.17.9021. [DOI] [PMC free article] [PubMed] [Google Scholar]
- 7.Oxburgh L., Dudley A.T., Godin R.E., Koonce C.H., Islam A., Anderson D.C., Bikoff E.K., Robertson E.J. BMP4 substitutes for loss of BMP7 during kidney development. Dev Biol. 2005;286:637–646. doi: 10.1016/j.ydbio.2005.08.024. [DOI] [PubMed] [Google Scholar]
- 8.Wetzel P., Haag J., Câmpean V., Goldschmeding R., Atalla A., Amann K., Aigner T. Bone morphogenetic protein-7 expression and activity in the human adult normal kidney is predominantly localized to the distal nephron. Kidney Int. 2006;70:717–723. doi: 10.1038/sj.ki.5001653. [DOI] [PubMed] [Google Scholar]
- 9.Zeisberg M., Bottiglio C., Kumar N., Maeshima Y., Strutz F., Müller G.A., Kalluri R. Bone morphogenic protein-7 inhibits progression of chronic renal fibrosis associated with two genetic mouse models. Am J Physiol Renal Physiol. 2003;285:F1060–F1067. doi: 10.1152/ajprenal.00191.2002. [DOI] [PubMed] [Google Scholar]
- 10.Zeisberg M., Hanai J., Sugimoto H., Mammoto T., Charytan D., Strutz F., Kalluri R. BMP-7 counteracts TGF-beta1-induced epithelial-to-mesenchymal transition and reverses chronic renal injury. Nat Med. 2003;9:964–968. doi: 10.1038/nm888. [DOI] [PubMed] [Google Scholar]
- 11.Sugimoto H., Grahovac G., Zeisberg M., Kalluri R. Renal fibrosis and glomerulosclerosis in a new mouse model of diabetic nephropathy and its regression by bone morphogenic protein-7 and advanced glycation end product inhibitors. Diabetes. 2007;56:1825–1833. doi: 10.2337/db06-1226. [DOI] [PubMed] [Google Scholar]
- 12.Gould S.E., Day M., Jones S.S., Dorai H. BMP-7 regulates chemokine, cytokine, and hemodynamic gene expression in proximal tubule cells. Kidney Int. 2002;61:51–60. doi: 10.1046/j.1523-1755.2002.00103.x. [DOI] [PubMed] [Google Scholar]
- 13.Lyons K., Graycar J.L., Lee A., Hashmi S., Lindquist P.B., Chen E.Y., Hogan B.L., Derynck R. Vgr-1, a mammalian gene related to Xenopus Vg-1, is a member of the transforming growth factor beta gene superfamily. Proc Natl Acad Sci USA. 1989;86:4554–4558. doi: 10.1073/pnas.86.12.4554. [DOI] [PMC free article] [PubMed] [Google Scholar]
- 14.Yan J., Yang S., Zhang J., Zhai C., Zhu T. BMP6 attenuates oxidant injury in HK-2 cells via Smad-dependent HO-1 induction. Free Radic Biol Med. 2009;46:1275–1282. doi: 10.1016/j.freeradbiomed.2009.02.007. [DOI] [PubMed] [Google Scholar]
- 15.Bursztyn M., Gross M.L., Goltser-Dubner T., Koleganova N., Birman T., Smith Y., Ariel I. Adult hypertension in intrauterine growth-restricted offspring of hyperinsulinemic rats: evidence of subtle renal damage. Hypertension. 2006;48:717–723. doi: 10.1161/01.HYP.0000237973.64711.e2. [DOI] [PubMed] [Google Scholar]
- 16.Nguyen T.Q., Goldschmeding R. Bone morphogenetic protein-7 and connective tissue growth factor: novel targets for treatment of renal fibrosis? Pharm Res. 2008;25:2416–2426. doi: 10.1007/s11095-008-9548-9. [DOI] [PubMed] [Google Scholar]
- 17.Solloway M.J., Dudley A.T., Bikoff E.K., Lyons K.M., Hogan B.L., Robertson E.J. Mice lacking Bmp6 function. Dev Genet. 1998;22:321–339. doi: 10.1002/(SICI)1520-6408(1998)22:4<321::AID-DVG3>3.0.CO;2-8. [DOI] [PubMed] [Google Scholar]
- 18.Meynard D., Kautz L., Darnaud V., Canonne-Hergaux F., Coppin H., Roth M. Lack of the bone morphogenetic protein BMP6 induces massive iron overload. Nat Genet. 2009;41:478–481. doi: 10.1038/ng.320. [DOI] [PubMed] [Google Scholar]
- 19.Andriopoulos B., Jr, Corradini E., Xia Y., Faasse S.A., Chen S., Grgurevic L., Knutson M.D., Pietrangelo A., Vukicevic S., Lin H.Y., Babitt J.L. BMP6 is a key endogenous regulator of hepcidin expression and iron metabolism. Nat Genet. 2009;41:482–487. doi: 10.1038/ng.335. [DOI] [PMC free article] [PubMed] [Google Scholar]
- 20.Nguyen T.Q., Chon H., van Nieuwenhoven F.A., Braam B., Verhaar M.C., Goldschmeding R. Myofibroblast progenitor cells are increased in number in patients with type 1 diabetes and express less bone morphogenetic protein 6: a novel clue to adverse tissue remodelling? Diabetologia. 2006;49:1039–1048. doi: 10.1007/s00125-006-0172-0. [DOI] [PubMed] [Google Scholar]
- 21.Bellini A., Mattoli S. The role of the fibrocyte, a bone marrow-derived mesenchymal progenitor, in reactive and reparative fibroses. Lab Invest. 2007;87:858–870. doi: 10.1038/labinvest.3700654. [DOI] [PubMed] [Google Scholar]
- 22.Sakai N., Wada T., Yokoyama H., Lipp M., Ueha S., Matsushima K., Kaneko S. Secondary lymphoid tissue chemokine (SLC/CCL21)/CCR7 signaling regulates fibrocytes in renal fibrosis. Proc Natl Acad Sci USA. 2006;103:14098–14103. doi: 10.1073/pnas.0511200103. [DOI] [PMC free article] [PubMed] [Google Scholar]
- 23.Stokman G., Leemans J.C., Claessen N., Weening J.J., Florquin S. Hematopoietic stem cell mobilization therapy accelerates recovery of renal function independent of stem cell contribution. J Am Soc Nephrol. 2005;16:1684–1692. doi: 10.1681/ASN.2004080678. [DOI] [PubMed] [Google Scholar]
- 24.Bucala R., Spiegel L.A., Chesney J., Hogan M., Cerami A. Circulating fibrocytes define a new leukocyte subpopulation that mediates tissue repair. Mol Med. 1994;1:71–81. [PMC free article] [PubMed] [Google Scholar]
- 25.Chesney J., Bacher M., Bender A., Bucala R. The peripheral blood fibrocyte is a potent antigen-presenting cell capable of priming naive T cells in situ. Proc Natl Acad Sci USA. 1997;94:6307–6312. doi: 10.1073/pnas.94.12.6307. [DOI] [PMC free article] [PubMed] [Google Scholar]
- 26.Chevalier R.L., Forbes M.S., Thornhill B.A. Ureteral obstruction as a model of renal interstitial fibrosis and obstructive nephropathy. Kidney Int. 2009;75:1145–1152. doi: 10.1038/ki.2009.86. [DOI] [PubMed] [Google Scholar]
- 27.Yan J.D., Yang S., Zhang J., Zhu T.H. BMP6 reverses TGF-beta1-induced changes in HK-2 cells: implications for the treatment of renal fibrosis. Acta Pharmacol Sin. 2009;30:994–1000. doi: 10.1038/aps.2009.56. [DOI] [PMC free article] [PubMed] [Google Scholar]
- 28.Dockrell M.E., Phanish M.K., Hendry B.M. TGF-beta auto-induction and connective tissue growth factor expression in human renal tubule epithelial cells requires N-Ras. Nephron Exp Nephrol. 2009;112:e71–e79. doi: 10.1159/000221834. [DOI] [PubMed] [Google Scholar]
- 29.Piek E., Heldin C.H., Ten Dijke P. Specificity, diversity, and regulation in TGF-beta superfamily signaling. FASEB J. 1999;13:2105–2124. [PubMed] [Google Scholar]
- 30.Zhao W., Chen S.S., Chen Y., Ahokas R.A., Sun Y. Kidney fibrosis in hypertensive rats: role of oxidative stress. Am J Nephrol. 2008;28:548–554. doi: 10.1159/000115289. [DOI] [PMC free article] [PubMed] [Google Scholar]
- 31.Abreu J.G., Ketpura N.I., Reversade B., De Robertis E.M. Connective-tissue growth factor (CTGF) modulates cell signalling by BMP and TGF-beta. Nat Cell Biol. 2002;4:599–604. doi: 10.1038/ncb826. [DOI] [PMC free article] [PubMed] [Google Scholar]
- 32.Nguyen T.Q., Roestenberg P., van Nieuwenhoven F.A., Bovenschen N., Li Z., Xu L., Oliver N., Aten J., Joles J.A., Vial C., Brandan E., Lyons K.M., Goldschmeding R. CTGF inhibits BMP-7 signaling in diabetic nephropathy. J Am Soc Nephrol. 2008;19:2098–2107. doi: 10.1681/ASN.2007111261. [DOI] [PMC free article] [PubMed] [Google Scholar]
- 33.Kothapalli D., Frazier K.S., Welply A., Segarini P.R., Grotendorst G.R. Transforming growth factor beta induces anchorage-independent growth of NRK fibroblasts via a connective tissue growth factor-dependent signaling pathway. Cell Growth Differ. 1997;8:61–68. [PubMed] [Google Scholar]
- 34.Sato M., Muragaki Y., Saika S., Roberts A.B., Ooshima A. Targeted disruption of TGF-beta1/Smad3 signaling protects against renal tubulointerstitial fibrosis induced by unilateral ureteral obstruction. J Clin Invest. 2003;112:1486–1494. doi: 10.1172/JCI19270. [DOI] [PMC free article] [PubMed] [Google Scholar]
- 35.Dong X., Bachman L., Miller M., Nath K., Griffin M. Dendritic cells facilitate accumulation of IL-17 T cells in the kidney following acute renal obstruction. Kidney Int. 2008;74:1294–1309. doi: 10.1038/ki.2008.394. [DOI] [PMC free article] [PubMed] [Google Scholar]
- 36.Hong J.H., Lee G.T., Lee J.H., Kwon S.J., Park S.H., Kim S.J., Kim I.Y. Effect of bone morphogenetic protein-6 on macrophages. Immunology. 2009;128(1 Suppl):e442–e450. doi: 10.1111/j.1365-2567.2008.02998.x. [DOI] [PMC free article] [PubMed] [Google Scholar]
- 37.Sivertsen E.A., Huse K., Hystad M.E., Kersten C., Smeland E.B., Myklebust J.H. Inhibitory effects and target genes of bone morphogenetic protein 6 in Jurkat TAg cells. Eur J Immunol. 2007;37:2937–2948. doi: 10.1002/eji.200636759. [DOI] [PubMed] [Google Scholar]
- 38.Kersten C., Sivertsen E.A., Hystad M.E., Forfang L., Smeland E.B., Myklebust J.H. BMP-6 inhibits growth of mature human B cells; induction of Smad phosphorylation and upregulation of Id1. BMC Immunol. 2005;6:9. doi: 10.1186/1471-2172-6-9. [DOI] [PMC free article] [PubMed] [Google Scholar]
- 39.Abe R., Donnelly S.C., Peng T., Bucala R., Metz C.N. Peripheral blood fibrocytes: differentiation pathway and migration to wound sites. J Immunol. 2001;166:7556–7562. doi: 10.4049/jimmunol.166.12.7556. [DOI] [PubMed] [Google Scholar]
- 40.Schmidt M., Sun G., Stacey M.A., Mori L., Mattoli S. Identification of circulating fibrocytes as precursors of bronchial myofibroblasts in asthma. J Immunol. 2003;171:380–389. doi: 10.4049/jimmunol.171.1.380. [DOI] [PubMed] [Google Scholar]
- 41.Lin J., Patel S.R., Cheng X., Cho E.A., Levitan I., Ullenbruch M., Phan S.H., Park J.M., Dressler G.R. Kielin/chordin-like protein, a novel enhancer of BMP signaling, attenuates renal fibrotic disease. Nat Med. 2005;11:387–393. doi: 10.1038/nm1217. [DOI] [PubMed] [Google Scholar]
- 42.Wang J.F., Jiao H., Stewart T.L., Shankowsky H.A., Scott P.G., Tredget E.E. Fibrocytes from burn patients regulate the activities of fibroblasts. Wound Repair Regener. 2007;15:113–121. doi: 10.1111/j.1524-475X.2006.00192.x. [DOI] [PubMed] [Google Scholar]
- 43.Nankivell B.J., Chen J., Boadle R.A., Harris D.C. The role of tubular iron accumulation in the remnant kidney. J Am Soc Nephrol. 1994;4:1598–1607. doi: 10.1681/ASN.V481598. [DOI] [PubMed] [Google Scholar]
- 44.Nankivell B.J., Tay Y.C., Boadle R.A., Harris D.C. Lysosomal iron accumulation in diabetic nephropathy. Ren Fail. 1994;16:367–381. doi: 10.3109/08860229409044877. [DOI] [PubMed] [Google Scholar]
- 45.Shah S.V., Baliga R., Rajapurkar M., Fonseca V.A. Oxidants in chronic kidney disease. J Am Soc Nephrol. 2007;18:16–28. doi: 10.1681/ASN.2006050500. [DOI] [PubMed] [Google Scholar]
- 46.Nath K.A. Heme oxygenase-1: a provenance for cytoprotective pathways in the kidney and other tissues. Kidney Int. 2006;70:432–443. doi: 10.1038/sj.ki.5001565. [DOI] [PubMed] [Google Scholar]
- 47.Applegate L.A., Luscher P., Tyrrell R.M. Induction of heme oxygenase: a general response to oxidant stress in cultured mammalian cells. Cancer Res. 1991;51:974–978. [PubMed] [Google Scholar]
- 48.Kawada N., Moriyama T., Ando A., Fukunaga M., Miyata T., Kurokawa K., Imai E., Hori M. Increased oxidative stress in mouse kidneys with unilateral ureteral obstruction. Kidney Int. 1999;56:1004–1013. doi: 10.1046/j.1523-1755.1999.00612.x. [DOI] [PubMed] [Google Scholar]
- 49.Kamijo-Ikemori A., Sugaya T., Obama A., Hiroi J., Miura H., Watanabe M., Kumai T., Ohtani-Kaneko R., Hirata K., Kimura K. Liver-type fatty acid-binding protein attenuates renal injury induced by unilateral ureteral obstruction. Am J Pathol. 2006;169:1107–1117. doi: 10.2353/ajpath.2006.060131. [DOI] [PMC free article] [PubMed] [Google Scholar]
- 50.Zager R.A., Johnson A.C., Hanson S.Y. Parenteral iron nephrotoxicity: potential mechanisms and consequences. Kidney Int. 2004;66:144–156. doi: 10.1111/j.1523-1755.2004.00716.x. [DOI] [PubMed] [Google Scholar]
Associated Data
This section collects any data citations, data availability statements, or supplementary materials included in this article.
Supplementary Materials
BMP-6 deficiency has no effect on E-cadherin expression. A: Immunohistochemistry shows equal E-cadherin expression between WT and BMP-6 null mice. E-cadherin expression was prominent mainly in distal tubules in the cortex. Obstruction resulted in a shift from basal toward more prominent lateral staining of E-cadherin. B: Gene expression for E-cadherin was not different between sham-operated, contralateral, and obstructed kidneys from either WT or BMP-6 null mice. CLK, contralateral kidneys from mice undergoing unilateral ureteral obstruction (UUO); OBK, obstructed kidneys from mice undergoing UUO; SHM, sham-operated control mice.
Iron deposition in extrarenal organs of BMP-6 null mice. A: Liver tissue of BMP-6 null mice with massive iron accumulation, compared with WT mice. B: Pancreatic tissue of BMP-6 null mice showing rare iron deposition in the exocrine acini (wedge), but not in the endocrine pancreas (islets of Langerhans). C: Adrenal of a BMP-6 null mouse with no evidence of iron accumulation. D: Myocardium of BMP-6 null mice shows very focal and slight iron deposition (wedge). In myocardium of WT mice, no iron depositions whatsoever were detected (not shown). Original magnification, ×200 (all images).