

Abstract
Molecular targeted therapy represents a promising new strategy for treating cancers because many small-molecule inhibitors targeting protein kinases have recently become available. Reverse-phase protein microarrays (RPPAs) are a useful platform for identifying dysregulated signaling pathways in tumors and can provide insight into patient-specific differences. In the present study, RPPAs were used to examine 60 protein end points (predominantly phosphoproteins) in matched tumor and nonmalignant biopsy specimens from 23 patients with head and neck squamous cell carcinoma to characterize the cancer phosphoproteome. RPPA identified 18 of 60 analytes globally elevated in tumors versus healthy tissue and 17 of 60 analytes that were decreased. The most significantly elevated analytes in tumor were checkpoint kinase (Chk) 1 serine 345 (S345), Chk 2 S33/35, eukaryotic translation initiation factor 4E-binding protein 1 (4E-BP1) S65, protein kinase C (PKC) ζ/ι threonine 410/412 (T410/T412), LKB1 S334, inhibitor of kappaB alpha (IκB-α) S32, eukaryotic translation initiation factor 4E (eIF4E) S209, Smad2 S465/67, insulin receptor substrate 1 (IRS-1) S612, mitogen-activated ERK kinase 1/2 (MEK1/2) S217/221, and total PKC ι. To our knowledge, this is the first report of elevated PKC ι in head and neck squamous cell carcinoma that may have significance because PKC ι is an oncogene in several other tumor types, including lung cancer. The feasibility of using RPPA for developing theranostic tests to guide personalized therapy is discussed in the context of these data.
Head and neck squamous cell carcinoma (HNSCC) is the seventh leading cause of cancer death worldwide and globally afflicts approximately 500,000 new persons each year.1 In 2009, approximately 48,000 new cases of this devastating and often fatal disease were diagnosed in the United States alone.2 Despite advances in multimodality treatments, the overall 5-year survival rate for patients with HNSCC is only 61% (National Cancer Institute Surveillance, Epidemiology, and End Results database at http://seer.cancer.gov/). The need for new treatment strategies is obvious.
The major challenge in developing new therapies is identifying agents that kill cancer cells but do not harm patients. Recognition that tumors are “addicted” to their aberrant pathways,3 together with prolific discovery of low-molecular-weight inhibitors that interfere with these pathways, has spawned a virtual explosion of new targeted therapies for treating cancer. Protein kinases have emerged as an important class of therapeutic targets partly because of the ease with which small-molecule inhibitors can be designed. More important, many defining characteristics of cancer, including autocrine growth, insensitivity to antigrowth signals, and evasion of programmed cell death, are heavily regulated by protein phosphorylation.4 Because there are 530 different human protein kinases acting in balance with approximately 180 phosphatases, essential questions arise as to which of these kinases (or phosphatases) and their plethora of downstream substrates will be effective cancer targets and in which subset of patients.
Several aberrant signaling pathways, along with their activating mechanisms and downstream substrates, have been previously characterized in HNSCC. Among these pathways, the epidermal growth factor receptor (EGFR) has been the most widely studied. Overexpression of EGFR protein occurs in approximately 70% to 80% of HNSCC tumors,5–7 the gene encoding EGFR is amplified in 17% to 31% of patient tumors,8–10 and high levels of the receptor have been correlated with poor prognosis.8,10,11 Abnormal signaling through the EGFR has been implicated in the activation of downstream pathways [ie, phosphatidylinositol 3-kinase/Akt and Ras/Raf/mitogen-activated ERK kinase (MEK)/extracellular signal-regulated kinase (ERK)] in HNSCC.12
Paradoxically, few patients with HNSCC respond to drugs targeting the EGFR,13–15 raising questions regarding how addicted most of these tumors are to the EGFR signaling pathway. Indeed, it has been hypothesized that other growth factor receptors, such as insulin-like growth factor 1 receptor,16,17 can serve to activate the same downstream pathways in HNSCC in a redundant fashion.
Aberrant or constitutive activation of transcription factor–signaling molecules [eg, signal transducer and activator of transcription 3 (Stat3)18–20 and nuclear factor (NF)-κB21–23] has also been extensively reported in both established cell lines and tumor specimens derived from patients with HNSCC. Both Stat3 and NF-κB are highly regulated by protein kinases. The activation of Stat3 is associated with increased tumor cell proliferation and anti-apoptotic functions.24–26
The activation of Akt in primary HNSCC tumors is controversial because some groups27,28 have reported cancer-specific increases in Akt phosphorylation and others have found little difference between tumor and normal29 or even elevated phosphorylation of Akt in adjacent nonmalignant mucosa from patients.30 Nevertheless, high levels of phosphorylated Akt protein are commonly observed in many established HNSCC lines in vitro, where it most likely functions to regulate cell growth and survival.31
Given the critical role of abnormal protein expression and activation in malignant transformation, several groups32–34 have attempted global analysis of the HNSCC proteome using high-throughput platforms based on reverse-phase liquid chromatography and mass spectrometry. Although these studies have identified proteins that appear to be differentially expressed in tumors compared with normal tissue, they lacked the capacity to discriminate changes in protein phosphorylation levels. Consequently, we decided to compare and identify differences in phosphoproteins regulating survival or cell death in primary tumors and normal (ie, nonmalignant) specimens from patients with HNSCC using reverse-phase protein microarrays (RPPAs). Phosphorylation and/or expression levels of 60 different protein targets (end points), predominantly phosphoproteins, were simultaneously measured in a cohort of matched laser-capture microdissected (LCM) tumor and nonmalignant samples from 23 patients with HNSCC. The data were analyzed to identify differences in signaling pathways between HNSCC tumors and nonmalignant tissue. In addition, the feasibility of measuring and profiling alterations unique for an individual patient's tumor was examined. Bioinformatics data of this kind could prove pivotal to discovering novel therapeutic targets and developing a personalized medicine approach to treating cancer.
Materials and Methods
Reagents and Cell Lines
Phosphospecific antibodies used in RPPA and Western blot experiments were from Cell Signaling Technology (Danvers, MA). Isoform-specific antibodies to total protein kinase C (PKC) ι were purchased from Cell Signaling Technology (Ab 2998) and Santa Cruz Biotechnology (Santa Cruz, CA) (H-76 and N-20); the PKC ζ-specific antibody was also from Cell Signaling Technology (AB 9372). Purified recombinant PKC ι and ζ made in baculovirus were obtained from Cell Sciences (Canton, MA). Short tandem repeat profiles for all HNSCC and papillary cell lines used in this study were generated from genomic DNA samples submitted to the Johns Hopkins University Core Fragment Analysis Facility (Baltimore, MD). The authenticity and uniqueness of cell lines were confirmed by cross-comparing their short tandem repeat profiles with the database of more than 600 commonly used cell lines deposited at the American Type Tissue Culture Repository (Manassas, VA).
LCM of Human Specimens
Tumor and adjacent nonmalignant mucosa samples excised from patients with HNSCC undergoing surgery as their primary treatment were snap frozen in the operating room immediately after devascularization. Samples obtained from 30 patients were stored in liquid nitrogen before embedding in optimal cutting temperature compound and sectioning onto glass slides with a cryostat. The slides (7 μm) were fixed in 70% ethanol; washed in purified water (Milli-Q); stained with Mayer's hematoxylin, followed by Scott's tap water substitute; and dehydrated by successive washes with increasing concentrations of ethanol, followed by final dehydration in xylene. Proteinase inhibitors (Roche, Indianapolis, IN) were added to the water and 70% ethanol to minimize protein degradation. Approximately 20,000 cells from each sample were captured onto caps (CapSure Macro LCM; Arcturus, Life Technologies, Carlsbad, CA) using a laser capture microscope (PixCell II; Arcturus, Life Technologies), and captured cells were stored at −80°C before extracting protein with a lysis buffer containing a 1:1 dilution of tissue protein extraction reagent (Pierce Biochemicals, Rockford, IL) and ×2 SDS loading buffer (Invitrogen, Carlsbad, CA) supplemented with 2.5% mercaptoethanol. The elapsed time between staining and freezing captured cells did not exceed 35 minutes for any sample, and 25 tumors and 23 matched control specimens had adequate material for LCM. An additional slide from each sample was stained with a modified procedure that included eosin so that a pathologist (M.D.W.) could review the histological features. All human samples were collected and processed in accordance with approved Institutional Review Board tissue banking and use protocols, and all patients gave written informed consent.
Reverse-Phase Protein Microarrays
Printing of lysates onto nitrocellulose arrays was performed as previously described.35 Samples were printed in duplicate, using a four-point dilution scheme. High and low control lysates (A431, with or without EGF and HeLa cells and with or without pervanadate) were printed on every slide as an internal control. Microarrays were immunostained as previously described36 on an automated slide stainer (Dako, Carpinteria, CA) using a biotin-linked catalyzed signal amplification system (Dako). Stained slides were scanned using an illustrating system (Adobe Photoshop 6.0; Adobe, San Jose, CA) on a scanner (UMAX PowerLook III; UMAX, Dallas, TX) as 16-bit tagged information file format images at 600 dpi. Antibodies used in these studies were validated for specificity by immunoblotting before use on arrays. All end points tested in these studies are listed in Supplemental Table S1 at http://ajp.amjpathol.org. Total protein values were determined after staining (SYPRO Ruby; Molecular Probes, Eugene, OR) of two representative slides, printed near the middle and end of the arraying process.
Statistical Analyses of RPPA Data
The TIFF images were analyzed using computer software (MicroVigene; VigeneTech, Boston, MA) to determine the background-corrected intensities for each spot. Differences in sample loading were corrected for by normalizing to total protein values determined from stained slides (SYPRO Ruby). Protein levels for each analyte were calculated using an in-house–developed software package (SuperCurve). Essentially, information provided by the whole dilution series from all samples for a given slide (ie, one analyte at a time) is jointly used to estimate the relative protein concentration for an individual sample. The SuperCurve method takes advantage of the fact that each microarray is probed with a single antibody and, thus, all samples on an array should have similar hybridization behavior and measurements from all spots; and can be used to provide information about baseline and saturation levels and rate of signal increase for each dilution point to construct a SuperCurve. The software package uses a three-parameter logistic model to construct a SuperCurve for each analyte, from which an EC50 in a log2 scale can be calculated individually for each sample on an array. The log2 EC50 is an estimate of the true protein concentration for an individual sample's analyte at some prespecified step within the dilution series (in this case, the median step).
Paired t-tests were used to test against the null hypothesis of no differential expression between tumor and normal samples for any given protein. The Benjamini-Hochberg method was applied to control the false-discovery rate (FDR) of 0.05. Software (JMP 8.0.1 analysis software; SAS, Cary, NC.) was used to perform the unsupervised cluster analysis and to generate a heat map representing log2 EC50 values from all sample end points. Patient-specific alterations in tumor samples were defined for each analyte using an algorithm that accounted for both the magnitude of an end point and the specific ratio when compared with the patient-matched nonmalignant control. For each end point, cutoff values for magnitude were determined by taking the mean log2 EC50 value for all nonmalignant samples ±1.65 SDs (ie, 90% of measurements expected to fall in between). Cutoff values for ratios were determined by taking the mean of all possible ratios between every nonmalignant sample for each end point ±1.28 SDs (ie, 80% of ratios expected to fall in between) after a log2 transformation. Analytes were considered to be truly increased or decreased in a patient's tumor only if both the log2 EC50 and the tumor EC50/matched control EC50 ratio were outside the predetermined cutoff values. However, for analyzing the feasibility of future diagnostic tests in the absence of patient-matched controls, a test result was considered positive based solely on the magnitude of a tumor's end point. False-positive results corresponded to patients whose tumors were positively elevated by magnitude alone but failed to exceed the cutoff ratio for activation. The positive predictive value for markers was then defined as follows: true positives/(true positives plus false positives). The sensitivity for each analyte was defined as follows: true negatives/(true negatives plus false positives).
Potential correlations between sample clusters and various clinicopathological end points for patient samples were examined with a Fisher's exact test. End points significantly associated with tumor and nonmalignant subsets were identified by class comparison using computer software (BRB Array tools software version 3.8.0) developed by Richard Simon, Ph.D., and the BRB-ArrayTools Development Team. Pearson correlation coefficients derived from every possible pair of end points were obtained using software (JMP 8.0.1). Potential signaling modules were identified after performing an unsupervised cluster analysis with the correlation coefficients and generating a heat map using ArrayTools. Correlation values greater than 0.41 (ie, P < 0.005 for ν = 46) were considered statistically significant. Pathway analysis was performed by searching scientific publications using MEDLINE, the Internet (ie, Google), and software (Ingenuity Pathways Analysis v8.5; Ingenuity Systems, Redwood City, CA).
Ultrasensitive Western Blots
Protein from approximately 10,000 cells collected by LCM was solubilized in sample lysis buffer containing 87-mmol/L Tris (pH 6.8), 75-mmol/L sodium chloride, 1-mmol/L EDTA, 0.5% NP40, 2% SDS, 0.25% deoxycholate, 10% glycerol, 2.5% mercaptoethanol, 10-mmol/L sodium fluoride, 1-mmol/L orthovanadate, 2-mmol/L pyrophosphate, and proteinase inhibitors. Sample protein concentrations were estimated by dot blotting serial dilutions onto nitrocellulose, staining protein (SYPRO Ruby) for blots, and comparing the fluorescent intensity of spots under UV transillumination with a dilution series made of bovine serum albumin standards. Fluorescent spot intensities were quantitated with a gel documentation system (Bio-Rad, Hercules, CA) running software (Quantity One). Equal amounts of protein (1 to 3 μg/lane) were heat denatured, resolved by SDS–polyacrylamide gel electrophoresis, and electrotransferred overnight to nitrocellulose membranes. Membranes were blocked for 30 minutes at room temperature with casein (Vector Laboratories, Burlingame, CA); incubated with primary antibodies (diluted 1:1000 in casein) overnight at 4°C; washed with casein the next day; incubated for 45 minutes at room temperature with horseradish peroxidase conjugated goat anti-rabbit (Cell Signaling Technology) (diluted 1:2000 in casein); washed in PBS/0.05% TW-20; incubated for 15 minutes at room temperature with biotinylated tyramide (Perkin Elmer, Waltham, MA); washed with PBS/TW-20/20% dimethyl sulfoxide and then casein; incubated at room temperature with alkaline phosphatase reagent (Vectastain ABC; Vector Laboratories); diluted 1:250 in casein for 10 minutes; and washed, incubated for 5 minutes with 0.1-mol/L Tris (9.5), and incubated for 5 minutes with substrate (DuoLux AP; Vector Laboratories) before rinsing in 0.1-mol/L Tris and exposing to X-ray film.
Immunohistochemistry
Sections (5 μm) cut from formalin-fixed archival specimens were deparaffinized and hydrated by successive incubations in xylene, 100% ethanol, and 95% ethanol, followed by rinsing in water. After antigen retrieval, immunohistochemistry (IHC) was performed with an autostainer (Lab Vison autostainer 360). Essentially, slides were blocked, incubated with primary antibodies (60 minutes at room temperature, except for phosphorylated PKC ζ/ι T410/T412, which was at 4°C overnight), and signal detected with a detection system (UltraVision LP) using a horseradish peroxidase polymer and diaminobenzidine substrate, followed by counterstaining with hematoxylin. The following antibodies, dilutions, and antigen retrievals from Cell Signaling Technology were used for IHC: anti-checkpoint kinase (Chk) 2 T68 2661 (1:100/EDTA, pH 8), anti-EGFR Y1173 4407 (1:100/Tris-EDTA, pH 9), anti-MEK1/2 S217/221 2338 (1:50/citrate, pH 6), anti-ERK1/2 T202/Y204 4376 (1:150/citrate, pH 6), anti-ErbB3 Y1289 4791 (1:100/EDTA, pH 8), and anti-PKC ζ/ι T410/T412 9378 (1:50/citrate, pH 6). The anti-Chk1 S345 Ab47318 (1:100/citrate, pH 6) was obtained from Abcam (Cambridge, MA); anti-total PKC ι 610175 (1:100/citrate, pH 6), Becton Dickinson laboratories; and anti-total EGFR sc-03 (1:100/citrate, pH 6), Santa Cruz Biotechnology (San Jose, CA). Staining was scored according to the German semiquantitative system,37 in which numbers are assigned based on the percentage of positively staining cells (0 indicates 0%; 1, 1% to 10%; 2, 11% to 50%; 3, 51% to 80%; and 4, 81% to 100%) and their intensity (0 indicates no staining; 1, weak staining; 2, moderate staining; and 3, strong staining). The IHC score is then calculated by multiplying the percentage score by the intensity score to yield values ranging from 0 (no expression) to 12 (strongest possible expression). A one-sided nonparametric Mann-Whitney U-test was used to compare scores between tumor and nonmalignant samples for each marker.
Copy Number Analysis by Fluorescence in Situ Hybridization and Real-Time PCR
Fluorescence in situ hybridization was performed on sections (5 μm) from formalin-fixed archival specimens using a color probe set (Vysis LSI EGFR Dual color probe set; No. 32–191053; Abbott Molecular, Des Plaines, IL) hybridizing to band region 7p12 in spectrum orange and to the centromere of chromosome 7 (7p11.1-q11.1) in spectrum green. Essentially, slides were baked overnight at 60°C, deparaffinized in xylene and 100% ethanol, air dried, and then pretreated for 12 minutes at 80°C in a sodium thiocyanate solution, followed by digestion with pepsin (3.8 mg/ml) for 15 to 18 minutes at 37°C. After proteinase treatment, slides were rinsed in water and dried before application of the probe under a coverslip sealed with rubber cement. The probe and DNA were denatured for 5 minutes at 73°C, followed by overnight hybridization at 37°C. The next day, coverslips were removed and slides were washed twice with standard saline citrate (SSC)/0.3% NP-40 before counterstaining with DAPI. Nuclei were examined.
Fluorescence was performed with a microscope (Olympus BX61) and image analysis software (Genetix Cytovision, San Jose, CA). Real-time PCR to measure the number of PKC ι (PRKCi) gene copies was performed with an assay [TaqMan Copy number; ABI, Carlsbad, CA (HS06679465)] that has primers and a probe (TaqMan) spanning from exon 10 to intron 11. Reactions were multiplexed with the primers and probe from the copy number reference RNaseP (No. 4403326) assay (ABI), which served as an internal control for normalization. PCR was performed with 20 ng DNA in 20-μL reaction volumes on a cycler (Bio-Rad C1000 Thermal cycler) for 40 cycles. Copy number was analyzed with software (CopyCaller v1.0 software; ABI).
Small Interfering RNA–Mediated Knockdown
Commercially available small interfering RNAs (siRNAs) specific for PRKCi, targeting regions with reduced homology to PKC ζ, were purchased from Qiagen (siRNA 1, SI02660098; Valencia, CA) and Ambion (siRNA2, AM51331, id 311; Austin, TX), along with a nonsilencing siRNA control (Ambion 4390846). The target sequence of the siRNA from Qiagen was 5′-CAGATTGTTCTTTGTTATAGA-3′, which spans exons 10 and 11. The siRNA from Ambion targets a region from exon 2. Established HNSCC lines HN5, SCC61, and OSC19 were electroporated with 1.5 μg siRNA using a nucleofector II apparatus (Amaxa, Walkersville, MD); and proteins harvested 48 hours later were resolved by SDS–polyacrylamide gel electrophoresis and analyzed by Western blotting. The integrated optical density of bands was determined from scanned images of the films using software (Photoshop CS4), which can be used to measure pixel intensities and areas of bands.
Results
Protein Activation Profiles Differ Between HNSCC Tumors and Matched Nonmalignant Mucosa
Reverse-phase protein microarrays allow a quantitative and simultaneous comparison of multiple protein analytes (ie, end points) across many samples. Surgical specimens were obtained from 25 previously untreated patients with primary HNSCC, derived from various sites within the upper aerodigestive tract. Laser-capture microdissection was used to enrich for cancerous or “normal” squamous epithelial cells from frozen tumor and matched nonmalignant mucosa samples, respectively. The clinicopathological features of these patient samples are listed in Table 1. Approximately 85% of the tumors studied were from the oral cavity, with the most frequent site being the oral tongue (ie, 7 of 25). Slightly less than half of the tumors were poorly differentiated, and approximately 50% of the patients presented with lymph node metastasis, as confirmed by pathological features.
Table 1.
Clinicopathological Features of Patient Samples
| Patient no./sex | Site | Grade | TNM stage | PNI | Hyperplasia in nonmalignant samples⁎ | Dysplasia in nonmalignant samples† |
|---|---|---|---|---|---|---|
| 1/M | FOM | Mod | T4N2B | Yes | Yes | No |
| 2/M | Gingiva | Poor | T4N2C | ND | Yes | Yes |
| 3/M | Subglottic | Mod | T3N0 | Yes | Yes | Yes |
| 4/M | FOM | Mod | T2N0 | No | No | No |
| 5/M | Oral tongue | Mod | T3N2B | Yes | Yes | No |
| 6/F | Oral tongue | Poor | T1N0 | No | Yes | No |
| 7/M | FOM | Mod | T2N0 | Yes | No | No |
| 8/M | Gingiva | Poor | T4N1 | Yes | Yes | No |
| 9/M | Epiglottis | Poor | T4N2 | Yes | Yes | No |
| 10/F | FOM | Poor | T3N0 | No | No | No |
| 11/F | Hypopharynx | Poor | T4N2B | No | Yes | Yes |
| 12/M | Gingiva | Mod | T4N0 | No | Yes | No |
| 13/F | Buccal | Mod | T4N0 | No | Yes | Yes |
| 14/M | Gingiva | Mod | T4N2B | No | Yes | Yes |
| 15/F | FOM | Poor | T4N1 | Yes | Yes | No |
| 16/M | Retromolar trigone | Mod | T4N0 | No | No | No |
| 17/M | Buccal | Mod | T3N0 | No | No | No |
| 18/F | Retromolar trigone | Poor | T4N2B | Yes | Yes | No |
| 19/F | Oral tongue | Poor | T1N0 | No | Yes | No |
| 20/M | Buccal | Well | T3N0 | ND | ND | ND |
| 21/M | Oral tongue | Poor | T4N2B | Yes | No | No |
| 22/F | Oral tongue | Mod | T2N2 | No | No | No |
| 23/M | Oral tongue | Mod | T2N2B | Yes | No | Yes |
| 24/M | Epiglottis | Mod | T3N2A | No | NA | NA |
| 25/M | Oral tongue | Mod | T3N0 | Yes | NA | NA |
M, male; F, female; FOM, floor of mouth; PNI, perineural invasion present; Mod, moderate; ND, not determined; NA, not applicable.
Hyperplasia present in 30% or more of the nonmalignant sample.
Dysplasia present in 10% or more of the nonmalignant sample.
Initially, arrays were stained for 58 different protein end points (predominantly phosphoproteins) using phosphospecific antibodies, with the exception of caspases 3 and 9, which were detected with antibodies specific for their cleaved (ie, activated) forms. During preliminary inspection of arrays, signals from the phosphospecific PKC ζ/ι (T410/T412) antibody were dramatically higher in tumors as a class. However, this phosphospecific antibody does not discriminate between the two phosphorylated isoforms of atypical PKC (ie, ζ and ι) because of their high homology. Therefore, additional arrays were stained with isoform-specific antibodies to either total PKC ζ or total PKC ι to examine which isoform's expression pattern would correlate best with the phosphospecific staining detected with the PKC ζ/ι T410/T412 antibody. Recombinant proteins were used to validate the specificity and sensitivity of the PKC isoform-specific antibodies in both Western blots (see Supplemental Figure S1 at http://ajp.amjpathol.org) and RPPA experiments (data not shown). In all, 60 protein end points (see Supplemental Table S1 at http://ajp.amjpathol.org), including total PKC ζ and ι, were analyzed by RPPA in tumor and nonmalignant samples. All 25 tumors were analyzed by RPPA; however, only 23 patients had adequate adjacent nonmalignant mucosa for comparison.
To normalize for differences in the amount of protein present in each sample, arrays near the middle and end of the printing process were stained with the fluorescent dye (SYPRO Ruby) that reacts with total protein (see Supplemental Figure S2 at http://ajp.amjpathol.org). For each RPPA analyte, data from multiple dilutions and replicates were analyzed and measured to generate a SuperCurve, from which the EC50 could be determined and compared across samples (see Supplemental Table S2 and Supplemental Table S3 at http://ajp.amjpathol.org). The EC50 is a measure of the abundance of an analyte derived by using RPPA data from all of the dilutions for that specific analyte. An unsupervised two-way hierarchical clustering of patient samples and the log2-transformed EC50 values for protein end points was performed to generate the heat map and dendogram in Figure 1. Tumor and nonmalignant samples segregated perfectly into two main clusters (Figure 1), suggesting that the protein expression profiles of tumors resembled each other more than their matched nonmalignant controls. Nonmalignant samples could be further clustered into two subgroups, N1 and N2 (Figure 1), based on their expression profiles. Although tumor samples clustered into four subgroups, most tumors belonged to either cluster T1 or cluster T4 (Figure 1).
Figure 1.
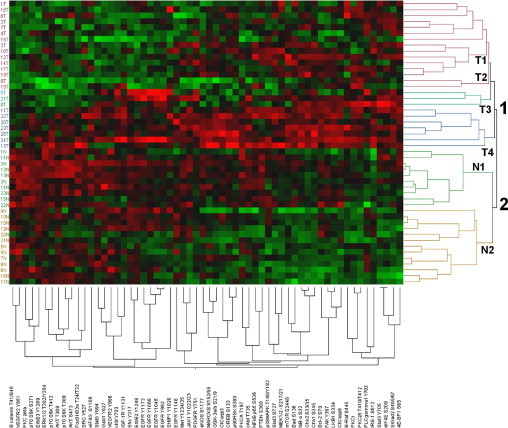
Unsupervised 2-way hierarchical clustering of patient samples and protein end points. Patient sample numbers appear on the left vertical axis, whereas clusters are designated on the right vertical axis. Protein end points appear along the bottom. Tumor samples clustered into four groups (T1-T4), whereas nonmalignant samples clustered into two main groups (N1 and N2). Groups are also indicated by colors in the dendogram. Red boxes indicate higher expression, and green boxes indicate lower expression, in the heat map.
Protein End Points Significantly Differ Between HNSCC Tumors and Nonmalignant Mucosa
Differences in the EC50 values from tumor and normal samples for all 60 analytes were examined with a paired t-test, applying the Benjamini-Hochberg procedure to control the FDR (α = 0.05). Of the 60 end points, 18 were significantly elevated (Table 2) and 17 were significantly decreased (Table 3) in tumors as a group, compared with matching nonmalignant mucosa. Among the most significantly elevated analytes in tumors (P < 0.0003) were Chk1 serine 345 (S345), Chk2 S33/35, 4E-BP1 (S65), PKC ζ/ι threonine 410/412 (T410/T412), LKB1 S334, IκB-α S32, eIF4E S209, Smad2 S465/67, IRS-1 S612, MEK1/2 S217/21, and total PKC ι. The most significantly decreased analytes (P < 0.0001) in HNSCC tumors were β-catenin (T41/S45), vascular endothelial growth factor receptor 2 (VEGFR2) tyrosine (Y951), ErbB3 (Y1289), and total PKC ζ. Reverse-phase protein microarrays for some of these end points that were significantly different between tumors and matching nonmalignant mucosa, along with a graphical representation of corresponding EC50 values determined from the arrays, are shown in Figure 2.
Table 2.
Values for End Points Significantly Higher in HNSCC Tumor Cells Compared with Matched Nonmalignant Mucosa
| End points higher in tumors | P value | FDR value |
|---|---|---|
| Chk1 S345 | <0.0001 | <0.0001 |
| Chk2 S33/35 | <0.0001 | <0.0001 |
| 4E-BP1 (S65) | <0.0001 | <0.0001 |
| PKC ζ/ι T410/T412 | <0.0001 | <0.0001 |
| LKB1 S334 | <0.0001 | <0.0001 |
| IκB-α S32 | <0.0001 | <0.0001 |
| eIF4E S209 | <0.0001 | <0.0001 |
| Smad2 S465/67 | <0.0001 | <0.0001 |
| IRS-1 S612 | <0.0001 | <0.0001 |
| MEK1/2-S217/221 | <0.0001 | <0.0001 |
| PKC ι | <0.0001 | 0.00016 |
| Stat3 Y705 | <0.0001 | 0.00029 |
| Bad S136 | <0.001 | 0.00224 |
| PLCγ1 Y783 | <0.002 | 0.00292 |
| mTOR S2448 | <0.003 | 0.00571 |
| Stat3 S727 | <0.004 | 0.00684 |
| B-Raf S445 | <0.007 | 0.01313 |
| p90RSK S380 | <0.02 | 0.02170 |
Differences between tumor and nonmalignant samples were examined with a paired t-test (α = 0.05), applying the Benjamini-Hochberg procedure to control the FDR.
Table 3.
Data for End Points Significantly Lower in HNSCC Tumor Cells Compared with Matched Nonmalignant Mucosa
| End points higher in tumors | P value | FDR value |
|---|---|---|
| β-Catenin T41/S45 | <0.0001 | <0.0001 |
| VEGFR2 Y951 | <0.0001 | <0.0001 |
| PKC ζ | <0.0001 | <0.0001 |
| ErbB3 (Y1289) | <0.0001 | <0.0001 |
| ERK1/2 T202/Y204 | <0.0001 | 0.00033 |
| Stat5 Y694 | <0.0002 | 0.00038 |
| Akt T308 | <0.0003 | 0.000818 |
| p70 S6K T389 | <0.0005 | 0.001258 |
| p70 S6K S371 | <0.002 | 0.00292 |
| VEGFR2 Y996 | <0.002 | 0.00394 |
| Fox01/03a T24/T32 | <0.002 | 0.00400 |
| Gab1 Y627 | <0.003 | 0.00627 |
| Akt S473 | <0.005 | 0.00914 |
| Shc Y317 | <0.007 | 0.01253 |
| ErbB2 Y1248 | <0.007 | 0.01253 |
| p70 S6K T412 | <0.008 | 0.01340 |
| EGFR Y1148 | <0.03 | 0.03806 |
Differences between tumor and nonmalignant samples were examined with a paired t-test (α = 0.05), applying the Benjamini-Hochberg procedure to control the FDR.
Figure 2.
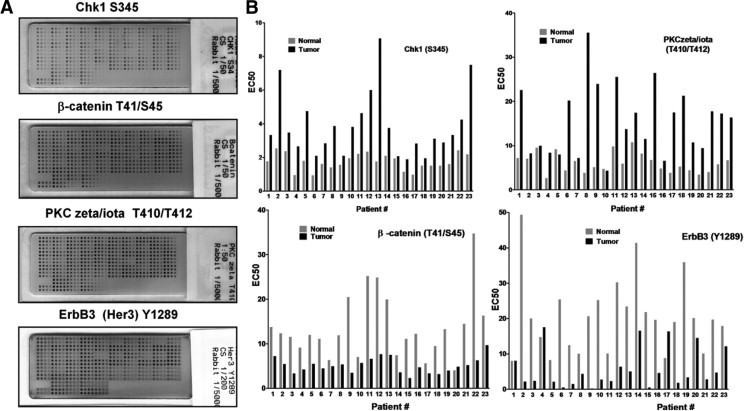
Reverse-phase protein arrays stained for various end points showing differences between patient-matched tumor and nonmalignant samples. Lysates from LCM-procured tumor or nonmalignant mucosa were arrayed in four-point series dilution, and each array stained with an antibody to a unique signaling end point. A: Four such arrays stained for Chk1 S345, PKC ζ/ι T410/T412, β-catenin T41/S35, and Erb B3 (Her3) Y1289 are shown as examples. Arrays were imaged on a flat bed scanner. B: Comparison of EC50 values for analytes measured in matched tumor and normal specimens from the RPPA experiments shown.
Correlation Between Sample Subsets and Clinicopathological Parameters
Although tumor samples can be divided into four clusters or subgroups based on their phosphoprotein profiles (Figure 1), tumor clusters T2 and T3 each contain too few samples for any meaningful analysis with clinicopathological parameters. Consequently, potential correlations were first examined using samples grouped into cluster T1 (ie, 12 samples) and cluster T4 (ie, 8 samples). No significant correlation (Fisher's exact test) existed between the tumor sample cluster and any of the clinicopathological or demographic parameters examined, including lymph node status, tumor stage, perineural invasion, histological grade, and sex. Similarly, if the few samples from clusters T2 and T3 were included in the analysis by regrouping them into clusters T1 and T4, respectively, there still were no significant correlations with any clinicopathological or demographic parameters.
The nonmalignant samples grouped into two clusters (Figure 1) that were examined for correlation with either hyperplasia or dysplasia. By using a Fisher's exact test, no significant correlation was found between clustering of nonmalignant samples and the presence of hyperplasia (Table 4). However, all six nonmalignant samples containing dysplasia grouped into cluster N1 (Table 5), which was statistically significant (P < 0.003).
Table 4.
Presence of Hyperplasia in Nonmalignant Clusters
| Cluster | Hyperplasia⁎ | No hyperplasia | Total |
|---|---|---|---|
| N1 | 8 | 2 | 10 |
| N2 | 6 | 6 | 12 |
| Total | 14 | 8 | 22 |
P = 0.2 by Fisher's exact test.
Samples with nonmalignant squamous epithelium containing 30% or more hyperplasia.
Table 5.
Presence of Dysplasia in Nonmalignant Clusters
Present in 10% or more of cells.
P < 0.003 by Fisher's exact test.
End Points Significantly Associated with Clinicopathological Parameters
Although most patient parameters did not correlate well with sample subsets generated from unsupervised cluster analysis (Figure 1), it was possible that clinicopathological parameters were still associated with certain end points. Therefore, a two-sample t-test was applied to compare the log2 EC50 values among various subsets of patient samples defined by the presence or absence of clinicopathological parameters (Table 6). The FDRs for each t-test were estimated with the Benjamini-Hochberg method, and only significant end points with an FDR of less than 0.2 were considered. Primary tumors from patients presenting with lymph node–positive disease had significantly greater expression of PKC ζ/ι T410/T412 (P < 0.006) and cKit Y703 (P < 0.009) but lower levels of p70 S6K T412 (P < 0.02), p90 ribosomal S6 kinase (RSK) S380 (P < 0.03), and ERK 1/2 T202/Y204 (P < 0.03). The antibody reacting with PKC ζ/ι T410-T412 does not discriminate between phosphorylated ζ and ι isoforms. However, neither PKC ζ nor PKC ι total proteins were statistically different in tumors from patients with or without lymph node metastasis (ie, P = 0.5 and P = 0.28). Nevertheless, there was an intermediate degree of correlation between levels of PKC ζ/ι T410-T412 and total PKC ι (r = 0.64) in tumors from patients who had lymph node metastasis. However, in the same set of patients, correlation between the phosphorylated end point and total PKC ζ was considerably weaker (r = 0.33). Tumors from patients exhibiting perineural invasion had significantly lower levels of p38MAPK T180/Y182 (P < 0.0003), ERK1/2 T202/Y204 (P < 0. 003), Stat3 S727 (P < 0. 003), and Akt T308 (P < 0.007). Furthermore, poorly differentiated tumors expressed significantly lower levels of ErbB3 Y1289 (P < 0. 0005).
Table 6.
End Points Significantly Correlated with Clinicopathological Parameters
| End point | −Median EC50⁎ | +Median EC50⁎ | Change | t-test EC50P value | FDR value |
|---|---|---|---|---|---|
| Data for LN | |||||
| PKC ζ/ι T410/T412 | 10.33 | 21.22 | ↑ | <0.006 | 0.18424 |
| cKit Y703 | 1.59 | 3.76 | ↑ | 0.008 | 0.18424 |
| p70 S6K T412 | 32.34 | 16.64 | ↓ | 0.01 | 0.18424 |
| P90 RSK S380 | 5.76 | 3.52 | ↓ | 0.02 | 0.18424 |
| ERK1/2 T202/T204 | 44.40 | 15.12 | ↓ | 0.023 | 0.18424 |
| Data for PNI | |||||
| p38MAPK T180-Y182 | 49.05 | 15.20 | ↓ | <0.0003 | 0.01516 |
| ERK1/2 T202-Y204 | 43.84 | 12.88 | ↓ | <0.003 | 0.05337 |
| Stat3 S727 | 23.06 | 12.35 | ↓ | <0.0038 | 0.05337 |
| Akt T308 | 11.74 | 6.50 | ↓ | <0.007 | 0.10055 |
| Data for differentiation | |||||
| ErbB3 Y1289 | 2.24 | 8.05 | ↑ | <0.0005 | 0.02628 |
| Data for dysplasia | |||||
| PKC ζ/ι T410-T412 | 4.94 | 8.85 | ↑ | <0.0008 | 0.04529 |
| PTEN S380 | 4.22 | 10.50 | ↑ | <0.004 | 0.08544 |
| cAbl T735 | 11.42 | 19.66 | ↑ | <0.005 | 0.08544 |
| IκB-α S32 | 1.96 | 2.47 | ↑ | <0.008 | 0.08544 |
| p70 S6K T412 | 28.11 | 48.32 | ↑ | <0.01 | 0.08544 |
| eNOS S1177 | 7.91 | 14.43 | ↑ | <0.01 | 0.08544 |
| Chk1 S345 | 1.58 | 2.20 | ↑ | <0.02 | 0.08544 |
| Met Y1234-35 | 6.38 | 13.13 | ↑ | <0.02 | 0.08544 |
| Gab1 Y627 | 3.20 | 3.93 | ↑ | <0.02 | 0.08544 |
| CREB S133 | 3.21 | 5.39 | ↑ | <0.02 | 0.08544 |
| Fox01-03a T24-T32 | 4.20 | 9.31 | ↑ | <0.03 | 0.08884 |
| MEK1-2 -S217-21 | 10.45 | 13.93 | ↑ | <0.03 | 0.08884 |
| Stat3 Y705 | 1.01 | 1.54 | ↑ | <0.03 | 0.08884 |
| p70 S6K T389 | 5.62 | 10.87 | ↑ | <0.03 | 0.08884 |
| eIF4E S209 | 1.04 | 1.41 | ↑ | <0.03 | 0.08884 |
| EGFR Y992 | 1.37 | 2.00 | ↑ | <0.03 | 0.08884 |
| Smad2 S465-67 | 1.08 | 1.50 | ↑ | <0.03 | 0.08884 |
| eIF4G S1108 | 3.88 | 9.03 | ↑ | <0.03 | 0.08884 |
| PKCA T197 | 7.24 | 9.98 | ↑ | <0.03 | 0.08884 |
| NF-κB p65 S536 | 3.27 | 4.56 | ↑ | <0.03 | 0.09713 |
| MARCKS S152-56 | 1.68 | 2.56 | ↑ | <0.04 | 0.10379 |
| FAK Y397 | 1.50 | 2.07 | ↑ | <0.04 | 0.10883 |
| EGFR Y1173 | 6.42 | 10.86 | ↑ | <0.05 | 0.10933 |
| SRC Y527 | 34.40 | 45.62 | ↑ | <0.052 | 0.11282 |
| VEGFR2 Y951 | 3.14 | 4.84 | ↑ | <0.05 | 0.11282 |
| 4E-BP1 S65 | 8.16 | 11.45 | ↑ | <0.05 | 0.11282 |
Statistical analyses were performed with a two-sample t-test after log2 transformation of EC50 values, and the FDRs were estimated by the Benjamini-Hochberg method. Dysplasia and no dysplasia refer to nonmalignant samples.
For LN, data are given as LN−median EC50 and LN+median EC50; for PNI, data are given as PN−median EC50 and PNI+median EC50; for differentiation, data are given as moderate- to well-differentiated EC50 and poorly differentiated EC50; and for dysplasia, data are given as dysplasia present and dysplasia absent. (All information is for the second and third columns, respectively.)
End points in nonmalignant samples were examined for correlation with the presence of either hyperplasia or dysplasia. No analytes were significantly different (with an acceptable FDR) between nonmalignant samples that had hyperplasia and those that did not have hyperplasia. In sharp contrast, dysplasia was associated with alteration of 26 analytes (Table 6). Among the end points most significantly elevated in nonmalignant samples with dysplasia were PKC ζ/ι T410-T412, phosphatase and tensin homolog (PTEN) S380, c-Abl T735, and IκB-α S32. Although levels of total PKC ι and ζ both tended to be elevated in the six nonmalignant dysplastic samples, this did not reach statistical significance (ie, P = 0.054 and P = 0.058, respectively), possibly because of the few samples with dysplasia. However, there was a moderately strong correlation between PKC ζ/ι T410-T412 and total PKC ι (r = 0.63) and total PKC ζ (r = 0.60) in the nonmalignant dysplastic samples. Furthermore, there was a high correlation between total PKC ζ and ι (r = 0.74) when only the dysplastic samples were considered, suggesting the possibility that both isoforms could contribute to the phosphorylated signal in dysplasia.
Patient-Specific Differences in Proteomic Profiles
A major rationale for performing RPPA analysis on patient samples is that molecular alterations present in tumors from different individuals may be heterogeneous, even when the tumors share common histological features. End points activated in a few samples or a single patient would be overlooked by global analysis alone. However, the design of the current study allows direct comparisons to be made between end points from a single tumor and values from the patient-matched nonmalignant control. Therefore, specific criteria were developed to classify analytes as either elevated or reduced in individual tumor specimens relative to the patient's nonmalignant sample. The number of cases for which an analyte was considered elevated or reduced relative to the patient-matched control is represented by the histogram in Figure 3.
Figure 3.
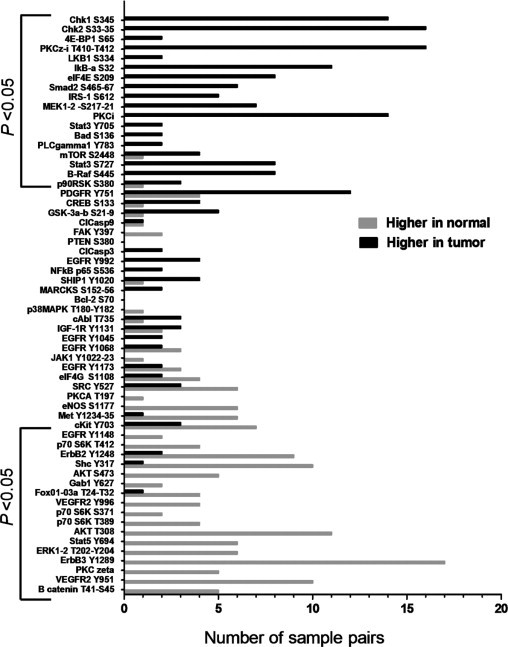
Histogram of pathways activated in individual samples. Bars correspond to the number of cases for which an analyte was considered to be higher (black) or lower (gray) in a tumor relative to the patient-matched control. The criterion used incorporated both the absolute magnitude of an end point and the ratio between tumor and normal samples, as explained in the text. Brackets indicate those end points that were significantly different between tumor and nonmalignant samples when a global group comparison was made (Tables 2 and 3).
A conservative approach was used to classify an end point as altered in a tumor specimen, which accounted for the variability of measurements observed for each analyte among the nonmalignant samples (patient differences were assumed to be biologically insignificant). For an end point to be activated in a patient tumor, the activation ratio (ie, EC50 tumor/EC50 matched control) should be outside the range or distribution of ratios observed for any random nonmalignant samples compared with each other. This approach is similar to the tactic commonly used for analysis of cDNA microarrays, for which differentially expressed genes between two samples are identified as having ratios that are outside thresholds defined by the distribution of unchanged genes. Benschop et al38 applied a similar strategy to quantitatively compare phosphoprotein changes by mass spectrometry using the ratios of unphosphorylated proteins to define a normal distribution and set threshold values.
In the present study, data from nonmalignant samples for each analyte were used to conservatively estimate what the distribution of values and ratios among patients should look like when changes are not expected. For each end point, a matrix was constructed in which all possible EC50 ratios between nonmalignant samples were calculated. A log2 transformation was applied to these ratios to normalize their distribution. An example of such a matrix for the PKC ζ/ι T410-T412 analyte appears in Supplemental Table S4 at http://ajp.amjpathol.org. Nonmalignant dysplastic samples were excluded from the normal ratios because many end points were significantly elevated in dysplastic nonmalignant specimens, which would have biased the ratios from the normal population. Upper and lower ratio thresholds were then set individually for each analyte so that 80% of ratios observed for normal samples would be in between (ie, mean of normal ratios ±1.28 SDs). A specimen with a tumor EC50/matched control EC50 outside that range would then be considered potentially abnormal for an analyte.
The tumor EC50/matched control EC50 ratios for all patients and analytes are listed in Supplemental Table 5 at http://ajp.amjpathol.org, along with the upper and lower thresholds calculated individually from the nonmalignant sample ratios. For all end points, the average upper threshold for activation corresponded to a 2.1-fold difference between tumor and normal; and the average lower threshold to consider an analyte decreased in tumor corresponded to a 2.2-fold difference (see Supplemental Table S5 at http://ajp.amjpathol.org).
Possibly, some patient specimens had high activation ratios in tumors because the corresponding matched normal for comparison may have been abnormally low because of sampling error. In such cases, it is difficult to discern whether the low value measured for an end point in the control tissue is an accurate reflection of normal for that patient or just happened to reflect sampling variation. To strengthen the likelihood that end points identified as activated in tumor specimens using the “ratio method” were truly activated, an additional criterion was added that also accounted for the absolute magnitude of an observed EC50 value for an analyte. Nonmalignant control samples for each analyte were analyzed to construct a distribution of magnitudes such that 90% of values were expected to fall within a range of upper and lower thresholds (ie, 1.65 SDs above and below the average). Thus, for an end point to be considered elevated in a patient's tumors, both the tumor/normal activation ratio and the magnitude of the tumor EC50 value had to be above the defined thresholds. Analogous criteria were applied to define end points lower in a specific patient's tumor, except that the activation ratio and magnitude had to be lower than the defined thresholds.
Overall, there was fairly good agreement between those end points activated or reduced in multiple patients using the combined ratio and magnitudes method (Figure 3) and end points globally altered between tumor and nonmalignant specimens by t-tests (ie, Tables 2 and 3). For example, increased eI4FE S209 and B-Raf S445 were found in 8 of 23 individual patients and were also significantly elevated in tumors as a group compared with nonmalignant controls. However, there were notable exceptions. For example, platelet-derived growth factor receptor (PDGFR) Y751 was activated in 12 patients but was not significantly different between tumor and normal as a group by t-test (P = 0.09). This discrepancy may be because values for this end point were unusually low in just four tumor samples because rerunning the analysis excluding those four patients yielded P < 0.0004. This illustrates an important limitation using global analysis as a means to identify potentially interesting pathway differences between tumor and nonmalignant samples. Several other end points (eg, IGF-1R Y1131, c-Abl T735, and cAMP response element-binding protein S133) were also elevated in individual patient tumors yet were not globally significant (see Supplemental Figure S3 at http://ajp.amjpathol.org).
Although patient heterogeneity in end points can disguise the potential importance of markers in a global analysis, individual patient analysis has limitations. There were end points significantly different in the global comparison of tumor versus normal, for which an analysis by individual patients did not suggest much importance. Examples of this are the analytes Stat3 Y705 and Bad S136, which were significantly elevated in tumors as a whole (P < 0.0001 and P < 0.001, respectively) but activated in only two patients. For Bad S136, an unusually large range in EC50 values observed among the nonmalignant samples meant too high of a threshold or cutoff value (ie, 2.81) was chosen to classify tumors as activated, compared with the average ratio threshold of 2.1 for all of the markers. Therefore, it is possible that the number of patients for which Bad S136 was activated was greatly underestimated by individual analysis. One solution is to greatly increase the number of nonmalignant controls for which measurements are made. This would increase confidence in threshold values set for future testing.
For Stat3 Y705, the tumor EC50/nonmalignant EC50 ratio was high enough in four patients to be considered activated but the absolute magnitudes of the tumor EC50 values were not higher than the cutoff threshold. This disparity occurred because the magnitude of the EC50 values for the paired nonmalignant samples of these patients was unusually low compared with the rest of the nonmalignant samples. Consequently, it is unclear if Stat3 Y705 was truly activated in these four patients or if the tumor activation ratio was artificially increased because of sampling errors in the matched control specimens.
Potential to Develop Biomarkers in HNSCC Tumors Using RPPA
In theory, RPPA could be used to develop a theranostic or clinical laboratory test capable of distinguishing whether an analyte is altered in an individual patient's tumor to personalize treatment. When measurements exist for matched nonmalignant specimens, a combination of information regarding the activation ratio and magnitude could be used, as previously discussed. However, matching nonmalignant tissue of the appropriate type may not always be available for every patient or be of sufficient quantity and quality for routine theranostic tests. An important question is whether it would be possible to make correct conclusions regarding the status of an end point, in the absence of a nonmalignant control, based solely on the absolute magnitude measured in the tumor sample. In other words, could the magnitude of the tumor end point be an accurate surrogate for the activation ratio? An obvious prerequisite for such a scenario would be that the tumor activation ratio (ie, tumor EC50/matched nonmalignant EC50) for an end point correlates highly with the EC50 magnitude measured for tumor alone. Consequently, the correlation between the log2 tumor activation ratios and the log2 EC50 values for tumor alone was examined for each end point (see Supplemental Table S6 at http://ajp.amjpathol.org).
A total of 33 of 60 end points showed strong correlation (ie, r ≥ 0.7) between EC50 for tumor and the tumor/normal activation ratio. These 33 end points were then examined further to determine whether a meaningful threshold or absolute value could be set that would negate the need for the matched nonmalignant control altogether. An upper threshold was set individually for each marker at 1.69 SDs higher than the average EC50 value obtained for all of the nonmalignant samples pooled (ie, 95% of nonmalignant samples are expected to occur below this value). Consequently, tumor specimens with log2 EC50 values greater than 1.69 SDs higher than the normal average would be considered “positive” for the theranostic test; and those less than this threshold would be considered “negative” for the test.
The diagnostic value for each of the 33 markers was then evaluated using the previously defined criteria that markers be elevated in both “ratio” and “magnitude” simultaneously, to be considered truly activated. By default, there were no possible false negatives, because the definition of truly activated shares the same magnitude cutoff value as the theranostic test. Therefore, the sensitivity and negative predictive value of the putative diagnostic test are automatically 100%. However, the specificity of the test (ie, if an end point is truly not activated, the odds of the test result being negative) and the positive predictive value (ie, the probability of an end point being truly activated if the theranostic test result is positive) are inversely related to the number of false positives. The number of false positives, true positives (positive by the test, and both the ratio and magnitude method), and true negatives for each of the 33 end points is listed in Supplemental Table S6 at http://ajp.amjpathol.org. The distribution of patient values for some of these markers is depicted graphically in Figure 4; some patient tumors had high activation ratios but were considered negative on the basis of absolute magnitude. Many of these negative specimens had high activation ratios because their corresponding matched nonmalignant controls had EC50 values well below the group averages. For 18 of the 33 markers evaluated, including the Chks, PKC ζ/ι T410-T412, PKC ι, IκB-α S32, B-Raf S445, PDGFR Y751, and several phosphorylated EGFR end points, the positive predictive value was greater than 84%.
Figure 4.
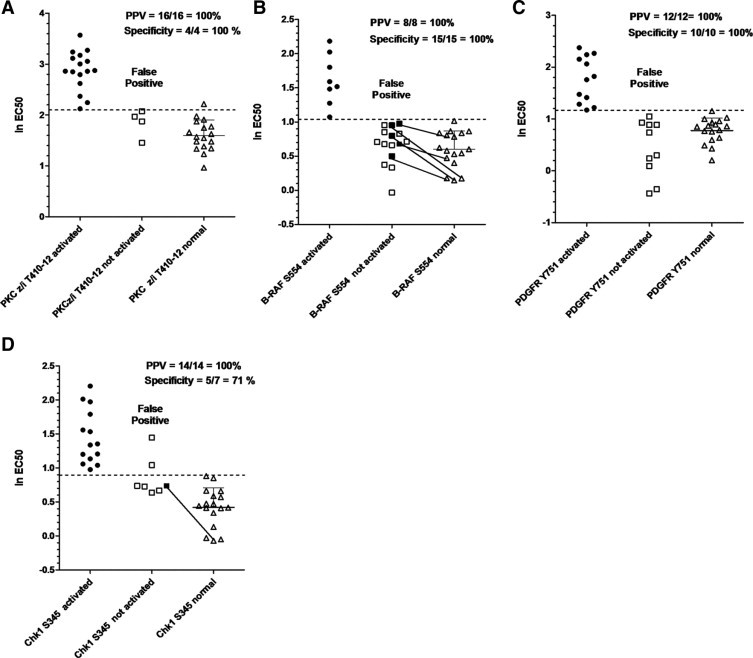
Distribution of log2 EC50 values for potential biomarkers. Log2 EC50 values for PKC ζ/ι T410/12 (A), B-Raf S554 (B), PDGFR Y751 (C), or Chk1 S345 (D) from individual patients were plotted to examine their distribution and the feasibility of developing a test based solely on magnitude. A marker was considered truly activated (circles) if the tumor/matching nonmalignant EC50 ratio was at threshold values or greater, calculated individually for each end point (see text and Supplemental Table S5 at http://ajp.amjpathol.org) and the absolute magnitude of the EC50 value was higher than the dotted line. Dotted lines represent 1.65 SDs higher than the mean log2 EC50 value for nonmalignant samples. Shaded circles or squares represent patient samples for which the tumor/matching nonmalignant ratio was higher than the predetermined threshold. Tumor samples with an EC50 higher than the dotted line, but lacking a tumor to normal ratio above the threshold, are considered false positives. Positive predictive values and specificity were calculated as explained in the text. Solid lines connect end points of insufficient magnitude (but a high tumor to normal EC50 ratio) with their corresponding nonmalignant control to illustrate how ratio alone can be misleading.
Validation of End Points Significantly Different in Tumors by Western Blotting
Reverse-phase protein microarrays are an established platform to quantitatively compare protein levels among samples and have been used in many publications.39 Antibodies to the 60 protein end points used in this study were previously tested by Western blotting to confirm minimal cross-reactivity with other proteins. As a proof in principal that the technique does indeed generate meaningful results, two end points of interest (ie, Chk1 S345 and PDGFR Y751) were compared by RPPA and traditional Western blotting using lysates that were experimentally generated. The HNSCC lines HN5 and HN31 were treated with UV radiation to activate Chk1 S345, and two additional HNSCC lines with a mesenchymal phenotype (MDA1386 and UMSCC25) were stimulated with PDGF-BB to induce phosphorylation of the PDGFR on Y751. Lysates from stimulated cells were mixed in various decreasing ratios with lysates from control unstimulated cells and then analyzed by both Western blotting and RPPA (see Supplemental Figure S4 at http://ajp.amjpathol.org). Bands on Western blots were quantitated by densitometry, and the concentration of analyte in each sample was estimated from the SuperCurve method after image analysis of the RPPA. For both Chk1 S345 and PDGFR Y751, the correlation between values for the two techniques was 0.9 or greater.
In all, we found 35 of 60 end points (Tables 2 and 3) to be significantly different in tumors compared with matched nonmalignant mucosa. The RPPA findings were validated by Western blotting experiments using protein extracts made from residual samples. However, because of the relatively large number of end points and limiting amounts of material remaining after RPPA experiments, it was not feasible to validate most end points. Consequently, a few end points that were of particular interest for potential therapeutic application were chosen for validation.
Because the yields of protein available after LCM are often too little for detection of targets by conventional means, we developed an ultrasensitive Western blotting protocol that used the same double enzymatic amplification scheme used for signal detection in RPPA. By using this protocol, phosphoproteins could typically be detected on Western blots when just 1 to 3 μg total protein was loaded per lane.
Among end points more highly expressed in tumors compared with nonmalignant specimens, PKC ζ/ι T410/T412 was of particular interest because the ι isoform is an oncogene in lung cancer.40 The increased signal intensity observed in RPPA was validated in LCM protein extracted from four patients by Western blotting with the phosphospecific antibody. As expected, increased band intensity for PKC ζ/ι T410/T412 was observed in tumor samples compared with matched nonmalignant mucosa from patients 13, 18, and 21 but not from patient 2 (see Supplemental Figure S5 at http://ajp.amjpathol.org). These results correlated well with those of the earlier RPPA (Figure 2). The phosphospecific antibody cannot distinguish between PKC ζ phosphorylated on T410 and PKC ι phosphorylated on T412 because these isoforms are highly homologous (ie, 72% identity and 92% similarity). Furthermore, they have nearly identical molecular weights and isoelectric points, making them difficult to distinguish the proteins even by two-dimensional electrophoresis. Consequently, isoform-specific antibodies were used to examine whether the amount of total protein for either of these proteins would correlate with increased phosphorylation. The differential expression pattern in Western blots for total PKC ι, but not ζ, was strikingly similar to the pattern observed for the phosphoprotein (see Supplemental Figure S5 at http://ajp.amjpathol.org). Both the phosphoprotein and total PKC ι levels were elevated in tumors from patients 13, 18, and 21 but not in patient 2. Although levels of total PKC ζ were also elevated in the tumor from patient 13, the signal in patient 21 was only marginally elevated; in patient 18, there appeared to be no difference between tumor and normal by Western blotting.
Although the Western blot experiments with total protein suggested that the signal detected by the phosphospecific PKC ζ/ι antibody was likely from the ι isoform, more evidence was sought. Levels of protein detected in RPPA by the phosphospecific antibody were correlated with levels detected by the isoform-specific antibodies to either PKC ι or PKC ζ for the entire sample set and just for tumors. The correlations are depicted graphically in Supplemental Figure S6 at http://ajp.amjpathol.org. There was a strong correlation between levels of PKC ι and PKC ζ/ι T410/T412 detected by RPPA for all samples (r = 0.84) and just tumor samples alone (r = 0.73). For total PKC ζ, on the other hand, there was no correlation with levels of PKC ζ/ι T410/T412 when all samples were considered (r = −0.1). However, there was a moderate correlation when just tumor samples were analyzed (r = 0.45).
The finding that both Chk1 S345 and Chk2 S33/35 were higher in tumors was of interest in light of recent efforts by pharmaceutical companies to target these and other enzymes involved in DNA repair. By Western blotting (see Supplemental Figure S5B at http://ajp.amjpathol.org), Chk1 S345 was increased in tumors for patients 2 and 13 and not by much in patient 19, which was the same pattern observed by RPPA (Figure 2). Similarly, a pattern of increased Chk2 S33/35 was observed for tumors from patients 13 and 19 by Western blotting, which was in agreement with results from the RPPA (see Supplemental Figure S5E at http://ajp.amjpathol.org). The signal for Chk2 S33/35 for patient 21 was too faint to be seen by Western blot, but this was consistent with the observation that patient 21 had less Chk2 S33/35 on the RPPA compared with either patient 13 or patient 19 (see Supplemental Figure S5E at http://ajp.amjpathol.org).
Finally, because the finding of increased Akt S473 in nonmalignant samples compared with matched tumors was somewhat unexpected, this end point was also validated by Western blot. As with the other end points, there was good agreement between relative intensities observed by Western blot and those found by RPPA (see Supplemental Figure S5 at http://ajp.amjpathol.org). The amount of non–malignant-associated Akt S473 was greater compared with that of matched tumor samples for patients 2 and 8 by both Western blot and RPPA. For patients 18 and 19, levels were similar between nonmalignant and tumor specimens for both techniques.
Validation of RPPA Findings by IHC
Because the amount of residual samples limited the ability to validate markers by ultrasensitive Western blotting in most cases, IHC performed on archival formalin-fixed specimens from the cohort was used as an alternative to confirm RPPA findings. However, this approach has limitations of its own. For example, archival specimens collected routinely for histopathological diagnosis are not collected in a fashion ideally suited to preserve phosphoproteins, which can be labile after tissue devascularization.41 In addition, archival specimens represent a different region of the actual samples used by RPPA and, in particular, the nonmalignant mucosal tissue present is, by necessity, in closer proximity to the tumor margin. A total of 8 end points were examined by IHC in select cases (eg, 7 to 10 patients for each marker) from the original cohort. The expression of phosphorylated atypical PKC detected with anti-phosphorylated PKC ζ/ι T410/T412 is shown for two patients in Figure 5. In agreement with RPPA findings, phosphorylated levels were considerably higher in the tumors from these patients compared with their matched nonmalignant mucosa. Indeed, there was copious staining (predominantly cytoplasmic, but some nuclear) for phosphorylated PKC ζ/ι present in nearly 100% of tumor cells from seven different patients examined. However, there was significant variability in expression levels observed in the nonmalignant mucosa across patients; many of these samples expressed high levels as well.
Figure 5.
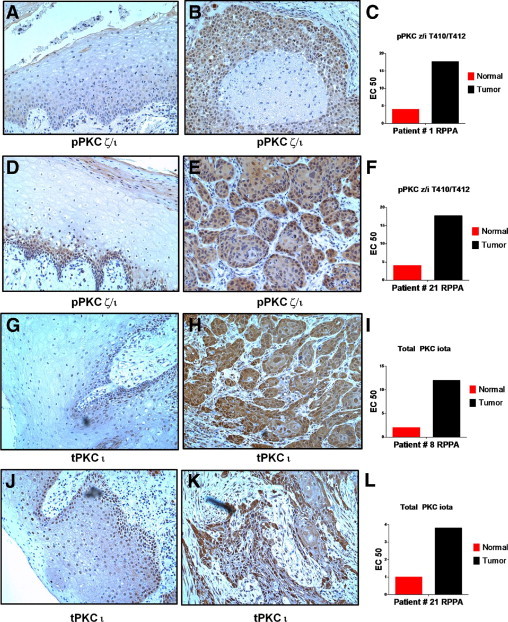
The IHC analysis of phopshorylated PKC ζ/ι T410/12 and total PKC ι. Nonmalignant (A, D, G, and J) and tumor (B, E, H, and K) tissues were stained with anti-phosphorylated PKC ζ/ι T410/12 (A, B, D, and E) or anti-total PKC ι (G, H, J, and K). Cohort numbers for the cases, along with RPPA measurements for each marker in the individual patients, are indicated in panels C, F, I, and L. Images were photographed under a ×10 objective.
The amount of cytoplasmic/membrane or nuclear staining for phosphorylated PKC ζ/ι and other markers examined by IHC was accessed according to the German semiquantitative scale, which scores staining based on both intensity and proportion of positive cells. The IHC scores for tumor and nonmalignant tissue for all cases and markers studied are reported in Supplemental Table S7 at http://ajp.amjpathol.org. By using these IHC scores, it was possible to examine whether differences in expression levels by IHC were statistically significant between tumor and healthy groups using a nonparametric Mann-Whitney U-test (P values listed in Supplemental Table S7 at http://ajp.amjpathol.org). Although there was a trend toward elevated cytoplasmic phosphorylated PKC ζ/ι in tumors, it did not reach statistical significance (P = 0.06).
The expression of total PKC ι was examined with an antibody from Becton Dickinson that was distinct from the one used for RPPA analysis because it has previously been validated to work on formalin-fixed specimens. This antibody was also specific for the ι isoform and did not cross-react with recombinant PKC ζ on Western blots (data not shown). Strong cytoplasmic and nuclear expression of total PKC ι was apparent in nearly all tumor cells from all samples examined (see Supplemental Table S7 at http://ajp.amjpathol.org). For some of the cases examined, there was considerably more expression of total PKC ι in tumor cells compared with matched nonmalignant mucosa (Figure 5, H and K), consistent with RPPA findings. However, there was considerable patient variability among nonmalignant specimens; some of these also had high levels of total PKC ι (both nuclear and cytoplasmic). Nevertheless, levels of total cytoplasmic PKC ι scored by IHC were higher in tumors compared with nonmalignant cells (P < 0.025).
Phosphorylation of the Chks was also examined by IHC. Because several commercially available antibodies used to detect Chk2 S33/35 did not work on formalin-fixed specimens, an antibody recognizing phosphorylation on T68 was used instead. Phosphorylation on T68 accompanies S33/35 phosphorylation during Chk2 activation and is, therefore, a reasonable surrogate. In many of the tumor cases examined, there was frequent and intense nuclear staining for phosphorylated Chk2 in tumors, which was rarely observed in nonmalignant mucosa (Figure 6). Nuclear staining for phosphorylated Chk2 was significantly higher in tumors (P < 0.025). Similarly, tumors were frequently positive for Chk1 S345 by IHC, but staining in nonmalignant mucosa was often weak (Figure 6). Interestingly, staining of Chk1 S345 was predominately cytoplasmic in tumors compared with the nuclear localization observed for phosphorylated Chk2. Phosphorylation of Chk1 on S345 has been associated with shunting from the nucleus to the cytoplasm,42 which is highly consistent with the pattern of staining observed in tumors.
Figure 6.
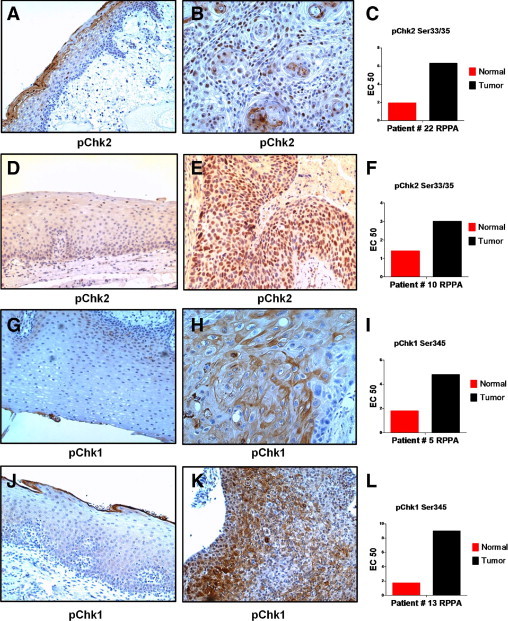
The IHC analysis of phosphorylated Chk2 T68 and phosphorylated Chk1 S345. Nonmalignant (A, D, G, and J) and tumor (B, E, H, and K) tissues were stained with anti-phosphorylated Chk2 T68 (A, B, D, and E) or anti-phosphorylated Chk1 S345 (G, H, J, and K). Cohort numbers for the cases, along with RPPA measurements for each marker in the individual patients, are indicated in panels C, F, I, and L. Images were photographed under a ×10 objective.
By RPPA analysis (Figure 3), levels of phosphorylated ERK and phosphorylated MEK did not correlate and appeared to have opposite expression patterns that suggested elevated phosphorylated ERK in nonmalignant cells compared with tumor. This same pattern of expression was observed by IHC (Figure 7). Intense nuclear staining accompanied by moderate cytoplasmic expression of phosphorylated ERK was present in most nonmalignant mucosa cells, whereas expression in tumors was often weak or only focally positive (Figure 7 and Supplemental Table S7 at http://ajp.amjpathol.org). Both nuclear and cytoplasmic levels of phosphorylated ERK were significantly higher in nonmalignant mucosa compared with tumor (P < 0.004). Phosphorylated MEK, on the other hand, was abundant in the cytoplasm of tumors by IHC (Figure 7) but was much weaker in nonmalignant cells (P < 0.005). Often, the same area of tumors that stained strongly for phosphorylated MEK was weak for phosphorylated ERK.
Figure 7.
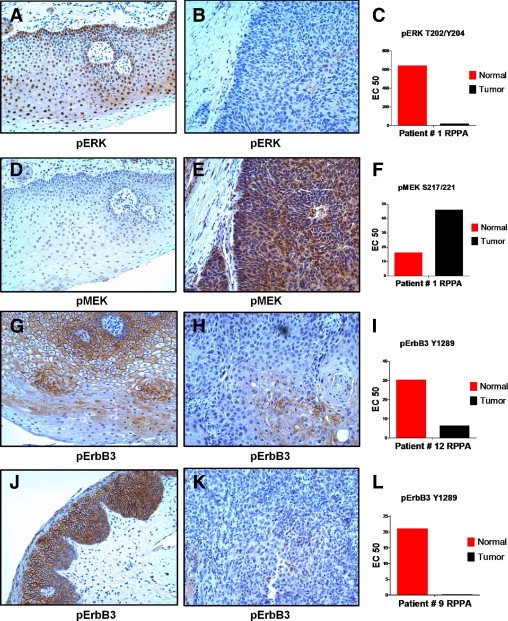
The IHC analysis of phosphorylated ERK, MEK, and ErbB3. Nonmalignant (A, D, G, and J) and tumor (B, E, H, and K) tissues were stained with anti-phosphorylated ERK T202/Y204 (A and B), anti-phosphorylated MEK S217/221 (D and E), or anti-phosphorylated ErbB3 Y1289 (G, H, J, and K). Cohort numbers for the cases, along with RPPA measurements for each marker in the individual patients, are indicated in panels C, F, I, and L. Images were photographed under a ×10 objective.
In agreement with RPPA findings, phosphorylation of ErbB3 was also much higher in nonmalignant mucosa than tumor (P < 0.009) by IHC (Figure 7 and Supplemental Table S7 at http://ajp.amjpathol.org). Large continuous areas of membranous and cytoplasmic staining for ErbB3 Y1289 were observed in nonmalignant mucosa from many cases, whereas tumors were only focally positive. Regions of tumor that were focally positive for ErbB3 Y1289 tended to occur in areas that were more differentiated.
In the RPPA analysis, little difference was found among tumor and nonmalignant samples for EGFR phosphorylated on multiple tyrosine residues for most patients. However, three patients (ie, patients 5, 21, and 24) were of notable exception because their tumors had high levels of phosphorylated EGFR. Therefore, the levels of phosphorylated and total EGFR by IHC in these same patients was compared with those of the rest of the cohort. In most tumors, total EGFR expression was increased compared with matched nonmalignant control mucosa (Figure 8 and see Supplemental Table S7 at http://ajp.amjpathol.org). Among tumors, total EGFR staining by IHC was extraordinarily high in patients 5 (Figure 8), 21, and 24 (data not shown) compared with remaining patients, who had modest overexpression (ie, patient 1 in Figure 8). Not surprisingly, these were the same three patients who had highly elevated phosphorylation of EGFR by RPPA. Although phosphorylation of EGFR on Y1173 was generally weak for most tumors and nonmalignant mucosa by IHC, expression was again uniquely elevated in tumor from patient 5 (Figure 8) and patients 21 and 24 (data not shown). The IHC results for EGFR Y1173 were in exact agreement with the RPPA findings.
Figure 8.
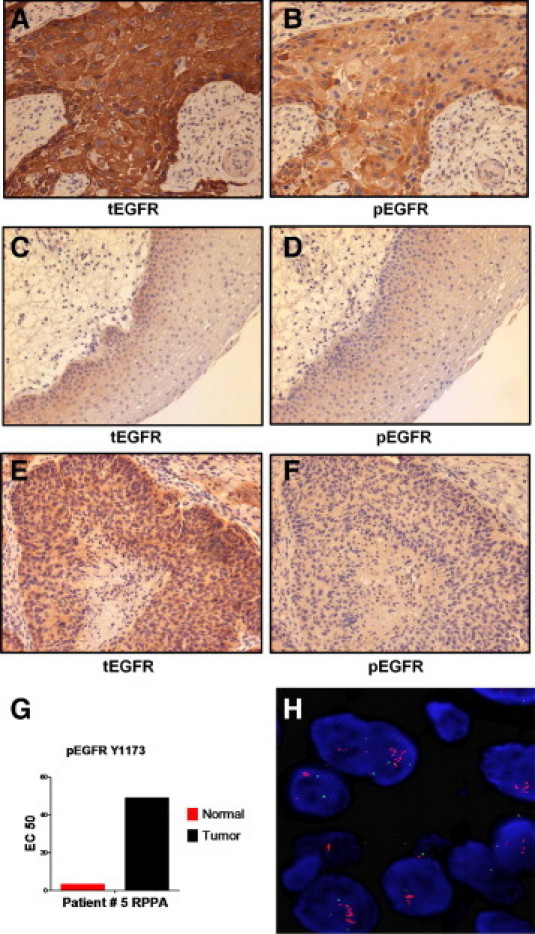
Analysis of phosphorylated and total EGFR. Tumor (A, B, E, and F) and nonmalignant (C and D) tissues were stained with antibody recognizing total EGFR (A, C, and E) or anti-phosphorylated EGFR Y1173 (B, D, and F). Tissue in the first four panels (A–D) was from patient 5 and had high levels of phosphorylated EGFR Y1173 by RPPA (G) and high phosphorylation levels on other tyrosine residues of EGFR (see text). The sample in E and F was from patient 1 and lacked high levels of phosphorylated EGFR proteins by RPPA. Amplification of the EGFR gene was demonstrated in patient 5 by fluorescence in situ hybridization (FISH) (H). The IHC images were photographed under a ×10 objective, whereas the FISH image was produced under a ×100 objective.
Because total EGFR was only modestly overexpressed in most of the tumors, the intense overexpression observed for three of the patients by IHC, along with the elevated levels of phosphorylated EGFR observed in the same patients by IHC and RPPA, prompted us to investigate whether EGFR gene amplification had occurred. Analysis of tumors by fluorescence in situ hybridization revealed a high copy number (ie, >20 copies) of the EGFR gene in all three patients (Figure 8 and see Supplemental Figure S7 at http://ajp.amjpathol.org).
PKC ι Copiously Expressed and Phosphorylated in Established HNSCC Lines
Genetic aberrations and signaling abnormalities found in primary cancers are often replicated in established cell lines from the same origin. If PKC ι phosphorylation was important in the biological features of primary tumors, then it might also be present in established HNSCC lines. Protein lysates from 11 different HNSCC lines and 1 papillary thyroid cancer (PTC) line were first examined for reactivity with the phosphospecific PKC ζ/ι T410/T412 antibody (Figure 9). The phosphospecific antibody detected a strong band migrating at the predicted molecular weight of approximately 78 kDa in eight of the HNSCC lines and in the PTC line. Weak expression was observed in the three remaining HNSCC lines. The antibody also detected recombinant isoforms ι and ζ, made in insect cells as glutathione S-transferase fusion proteins (approximately 92 kDa each) demonstrating that the phosphospecific antibody is capable of detecting either isoform. Presumably, the recombinant proteins became phosphorylated during production because posttranslational modifications, including phosphorylation, commonly occur in insect cells.
Figure 9.
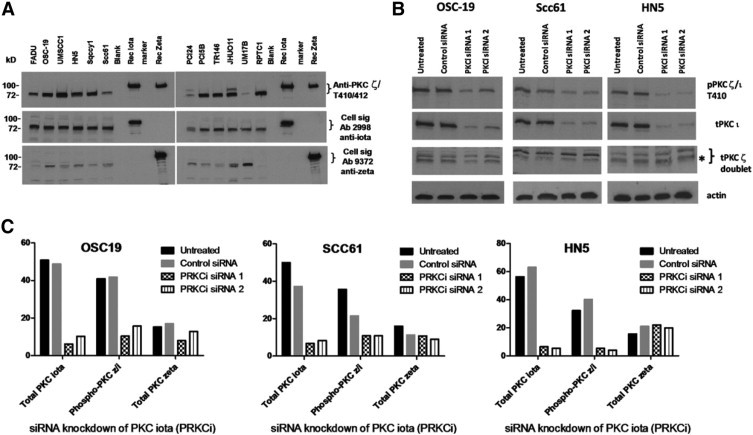
Expression of PKC ζ and ι isoforms in HNSCC lines. A: Both PKC ζ and ι, and a phosphorylated form, are easily detected in a panel of HNSCC lines by Western blotting. B: Knockdown of total PKC ι by two different siRNAs decreased expression of both PKC ζ/ι T410/12 and total PKC ι. Three HNSCC lines (ie, OSC-19, SCC61, and HN5) were electroporated with PKC ι-specific siRNAs (PKCi siRNA1 or siRNA2) or a nonsilencing control siRNA; and proteins harvested 48 hours later were analyzed by Western blot. Blots were first incubated with anti-PKC ζ/ι T410/12 (upper gel), then sequentially stripped and reprobed with anti-PKC ι, followed by anti-PKC ζ. The gel was cut to allow detection of actin in the lower blot. The bands detected by anti-PKC ι and the lower band in the doublet detected by anti-PKC ζ (indicated by an asterisk) aligned perfectly with the phosphoprotein detected by anti-PKC ζ/ι T410/12. C: Quantitation of blots from the siRNA experiment is represented by bar graphs.
The PKC ι-specific antibody (Ab 2998) detected a relatively strong band migrating at the correct molecular weight in 10 of the HNSCC lines and the PTC line, and there was weak to moderate expression in the remaining HNSCC line (PCI24). Interestingly, the phosphospecific band in PCI24 was also relatively weak, matching the relative intensity of total PKC ι. The PKC ζ was also detectable in all of the HNSCC lines but with much more variability in levels, which did not seem to correlate with the intensity of the phosphorylated species. The PTC line that exhibited strong phosphorylation did not express the ζ isoform, suggesting that in the thyroid cancer cell line the phosphoprotein was most likely attributable to the ι isoform.
Having established that HNSCC lines commonly express copious PKC ι and a protein of the same molecular weight reacting with the phosphospecific antibody, the next question was about how much of the phosphorylated signal on Western blots was due to the ι isoform. To address this question, total PKC ι was knocked down in three different HNSCC lines using two different commercially available siRNAs specific for the ι isoform gene (PRKCi), which had minimal homology to PKC ζ. Western blot analysis demonstrated that the two PKC ι-specific siRNAs reduced levels of total PKC ι by more than 80% in all three HNSCC lines (Figure 9). In contrast, no reduction of total PKC ζ was found in HN5 and SCC61 compared with treatment with control siRNA, although there was a modest nonspecific reduction when compared with untreated SCC61. The knockdown appeared less specific in OSC19 because there was a 30% to 50% reduction in the ζ isoform after electroporation with PRKCi siRNA1 and siRNA2, respectively. Quantitatively, levels of phosphorylated protein detected by the anti-PKC ζ/ι T410/T412 mirrored the decrease in levels of total PKC ι, with a greater than 80% decrease in phosphorylated protein observed in both HN5 and SCC61 after silencing with the PRKCi-specific siRNAs. A decrease in phosphorylated protein was also seen in OSC19 silenced with the PRKCi-specific siRNA, but the results were harder to interpret because the total ζ isoform levels were also reduced by treatments. Thus, for at least two cell lines, HN5 and SCC61, siRNA experiments demonstrated that a considerable amount of phosphorylated protein is the result of the ι isoform. The fact that PKC ι is substantially phosphorylated in these cell lines was also demonstrated by immunoprecipitation and immunodepletion experiments (data not shown).
The gene encoding PKC ι has been amplified in non-small cell lung cancer tumors and cell lines. Therefore, the PKC ι gene copy number was examined in some of the HNSCC lines by real-time PCR. Seven HNSCC lines had at least four copies of the PRKCi gene (see Supplemental Figure S8 at http://ajp.amjpathol.org), including HN5. Interestingly, PCI24, which had the lowest levels of phosphorylated protein and total PKC ι, had normal copy levels.
Correlational Analysis of End Points Identifies Multiple Signaling Modules
Simultaneous measurement of 60 end points across 48 different samples (ie, 23 tumor and normal pairs plus two unmatched tumors) allowed examination of potential relationships between analytes through correlational analysis. Pearson correlation coefficients were calculated individually for every possible pair of end points (see Supplemental Table S8 at http://ajp.amjpathol.org). Almost half of the analytes studied had a high correlation (ie, r ≥ 0.7) with two or more other end points, suggesting they may be linked in the same biological pathway. Correlations between EGFR Y1173, Y1068, Y1045, and Y992 were high. ErbB2 Y1248 had a strong correlation with EGFR Y1173 and Y1068 and moderately strong correlations with other EGFR end points, including EGFR Y1045 and EGFR Y992. Furthermore, in the three patients whose tumors were elevated for EGFR Y1068 (Figure 3), increased phosphorylation of EGFRY992, EGFRY1045, EGFRY1173, EGFRY1248, and ErbB2 was also observed (see Supplemental Figure S7 at http://ajp.amjpathol.org), illustrating the correlation between these end points and providing some internal validation that the pathway was activated. As previously noted, the correlation between PKC ζ/ι T410/T412 and total PKC ι was also high.
To analyze the relationships between analytes in a global and systematic fashion, unsupervised one-way clustering was performed using the correlation coefficients from Supplemental Table S7 (at http://ajp.amjpathol.org) to group together end points that may be part of the same pathway. The cluster analysis and a visual heat map of the correlation coefficients is shown in Figure 10, where r values greater than 0.41 (ie, P < 0.005 for ν = 46) appear as small dark red squares and r values of 1 (eg, end points correlated with themselves along the diagonal) are bright red. A cutoff of r = 0.41 was chosen because it is highly statistically significant and still represents an intermediate strength of correlation. In this manner, clusters of significant correlations between multiple end points take the shape of a larger red square or rectangle, corresponding to end points presumably connected in the same signaling module.
Figure 10.
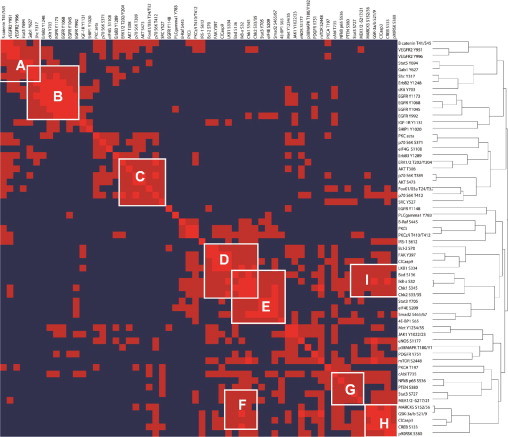
Heat map of correlation values. Cross correlations were determined for every combination of end points among all samples, including 23 pairs of tumor and nonmalignant specimens and two unpaired tumors. Bright red, r = 1; dark red, r > 0.41 (ie, P < 0.005 for n = 46). Clusters of red form signaling modules labeled with white letters, corresponding to pathways shown schematically in Figure 11.
At least nine signaling modules can be visually identified from the heat map in Figure 10. Because the connection between different end points within the same signaling module is an implied one based on RPPA data from the current study, confirmation of these relationships was sought from the existing scientific literature. Connections between end points within identifiable signaling modules were validated by searching scientific publications using MEDLINE, the Internet (ie, Google), and a computer software program (Ingenuity Pathways Analysis). This information was incorporated into a schematic diagram constructed for each of the signaling modules (Figure 11). Because of significant overlap in common end points, the two signaling modules (I and F) in Figure 10 were consolidated into a single pathway in Figure 11F.
Figure 11.

Signaling modules identified by correlational analysis of end points. A–F: Schematic diagram of modules identified in Figure 10. End points in boxes were identified as part of the modules from RPPA end point correlational analysis, whereas proteins with ellipses were either not studied or did not cluster together with the rest of the module but are implicated in the pathway. Analytes in green or red text were globally reduced or elevated in tumors, respectively. Light blue arrows indicate that an end point directly or indirectly causes phosphorylation of another; and dark blue arrows, stimulation (direct or indirect). Solid black lines connect proteins that are known to complex with each other. A red perpendicular line represents inhibition. Because of overlap in common end points, the two signaling modules (I and F) from Figure 10 were consolidated into a single pathway (F).
The two signaling modules, A and B (Figure 11), represent growth factor signaling through VEGFR and EGFR, respectively. Interestingly, there was also a high correlation between phosphorylation of cKit and the EGFR end points and downstream adapters (Shc and Gab1), which led to grouping cKit with these molecules. Signaling through these two growth factor pathways appears to be more highly elevated in nonmalignant samples compared with tumors. Similarly, signaling module C, which regulates a component of cell growth, is more activated in nonmalignant samples. Signaling modules D through F, on the other hand, are more activated in HNSCC tumors and all appear to promote cell survival and response to stress.
Discussion
In this study, RPPA analysis was used to quantitatively compare a relatively large number of protein end points in microdissected tumor specimens derived from patients with head and neck cancer. A unique component of this work is that comparisons were made with patient-matched nonmalignant specimens to control for normal biological variation in protein expression levels between individuals. Cluster analysis of specimens using expression levels from all 60 end points revealed a clear separation of tumors from nonmalignant specimens, highlighting the fact that tumors from different individuals were more similar to each other than to their matched normal control. This paired analysis approach identified 18 of 60 analytes globally elevated in tumors and 17 of 60 analytes that were decreased.
There is no standard method to define whether an analyte measured by RPPA is more highly elevated in an individual sample. In this study, criteria were developed to evaluate whether end points were elevated or reduced in each patient's tumor specimen, based on both the magnitude of an analyte's EC50 value and the ratio when the matched nonmalignant control was considered. Eleven end points that were globally elevated in tumors as a group (P < 0.05 by t-test) were also elevated in five or more individual patient tumors (ie, >20% of samples), including Chk1 S345, Chk2 S33-35, PKC ζ/ι T410-T412, IκB-α S32, eIF4E S209, Smad2 S465-67, IRS-1 S612, MEK1-2 S217/221, PKC ι, Stat3 S727, and B-Raf S445. Although the importance of some of these molecules has yet to be tested in HNSCC, their known biological functions warrant further investigation into their possible uses as therapeutic targets.
Eight protein markers deemed interesting from the RPPA study were also validated by IHC using formalin-fixed archival specimens from the same cohort. Despite the fact that archival tissue was not collected in a manner to best preserve protein phosphorylation, there was excellent agreement between the RPPA findings and IHC results. However, IHC added some additional information with respect to the localization of proteins. In both platforms, phosphorylated Chk1 and Chk2 levels were elevated in tumors compared with nonmalignant mucosa, but phosphorylated Chk1 was predominantly cytoplasmic when assessed by IHC. Niida et al42 have demonstrated that phosphorylation of Chk1 specifically on S345 shifts its localization to the cytoplasm, which may facilitate the association between Chk1 and centrosomes. This would position Chk1 in the vicinity of the many cell cycle regulatory proteins anchored to the centrosomes, possibly preventing activation of cyclin B-Cdk1. Strong expression levels of phosphorylated PKC ζ/ι and total PKC ι were observed in most tumor cells by IHC, but high expression in nonmalignant mucosa for some cases was also found. It may be difficult to detect quantitative differences in protein levels by IHC when a protein is highly expressed in both tumor and normal samples. In such cases, RPPA analysis may be more reliable because it is quantitative by nature.
Elevated PKC ζ/ι T410-T412 was among the most frequent alterations found in tumors by RPPA and occurred in 70% of patients; levels were on average 3.7-fold higher in tumors than matched nonmalignant specimens. The ι isoform most likely accounted for this increase because total PKC ι was also elevated by an average of 2.9-fold in 60% of tumors and was highly correlated with levels of PKC ζ/ι T410-T412. This was in sharp contrast to PKC ζ, which was not elevated in any tumors but actually reduced in five patient tumors and had virtually no correlation with PKC ζ/ι T410-T412. Phosphorylation of the ι isoform contributed significantly to the phosphorylated signal detectable in established HNSCC lines, although both isoforms were expressed in a panel of cells. Moreover, direct examination of patient samples by an ultrasensitive Western blot confirmed elevated PKC ι in 3 of 3 tumor specimens with elevated PKC ζ/ι T410-T412. Collectively, the evidence suggests that the ι isoform, not the ζ isoform, accounts for the increased phosphorylation frequently observed in tumors.
Few studies, if any, have directly examined the molecular regulation of PKC ι. However, it can be inferred that phosphorylation on T412 is most likely associated with kinase activation. This threonine amino acid in the activation loop is highly conserved among more than nine different PKC family members, and phosphorylation of the residue appears to be critical for kinase activation of both conventional and atypical PKC enzymes.43 For example, phosphorylation of the analogous threonine residue (T410) by PDK1 leads to activation of the highly homologous PKC ζ isoform.44,45
Increased activity and overexpression of PKC ι in HNSCC could have profound significance because this molecule is an oncogene overexpressed in 70% of primary non-small cell lung cancers.40 Furthermore, PKC ι is genetically amplified in 70% of non-small cell lung cancers with a squamous subtype. Similarly, amplification of the 3q26 locus, which harbors the PKC ι gene and the phosphatidylinositol 3-kinase p110α gene, frequently occurs in HNSCC, where it has been associated with tumor progression and poor prognosis.46 Possibly, the two coamplified genes function together as an oncogenic cassette in HNSCC. Furthermore, it is likely that phosphatidylinositol 3-kinase itself stimulates PKC ι activity through the intermediate PDK1, which directly binds PKC ι43 and probably phosphorylates the highly conserved threonine residue in a manner analogous to what has been observed for the PKC ζ isoform.44,45
Levels of PKC ζ/ι T410-T412 were moderately correlated with two other end points, MEK1/2 S217 and BRAF S445 (ie, r > 0.55 for both), which were both elevated in approximately 30% of patient tumors. Possibly, all three analytes are connected in the same pathway in HNSCC because they all can be activated downstream of Ras signaling. Moreover, PKC ι activation can lead to MEK1/2 phosphorylation47 that facilitates association with other kinases (ie, Raf) that phosphorylate MEK on S217. Unexpectedly, there was no correlation between MEK1/2 S217/221 and its phosphorylated downstream target ERK when all samples were considered together, although the correlation was statistically significant in nonmalignant samples alone (ie, r = 0.43, P < 0.025). A lack of correlation between MEK and ERK activation has also been reported in approximately 50% of acute leukemia samples,48 in which dephosphorylation of ERK by PAC1 (phosphatase of activated cells 1) under the effect of still-activated MEK may explain the discrepancy. The IHC results confirmed the lack of correlation between ERK and MEK phosphorylation in our cohort of primary HNSCC samples. The overexpression of Ras protein is frequent in primary HNSCC,49,50 despite an absence of Ras point mutations from HNSCC tumors in the western hemisphere. The tumor-associated increase in phosphorylation of BRAF, PKC ι, and MEK we observed in HNSCC tumor samples could be a signature of Ras overexpression or activation, independent of mutational status.
The PKC ζ/ι T410-T412 levels were also highly correlated (r = 0.64) with IκB-α S32, which was elevated in 48% of HNSCC tumor samples. Phosphorylation of IκB-α on serine 32 leads to proteosomal degradation and is a major step in positively regulating NF-κB. The PKC ι can activate the canonical NF-κB pathway through interaction with the IκB-α kinase.51 Regardless of upstream signaling events, the increased IκB-α S32 detected in tumor samples suggests that NF-κB is activated with high frequency in primary tumors and is in good agreement with much literature indicating that NF-κB activation is prevalent in HNSCC.12,52 As expected, there was good correlation between levels of IκB-α S32 and NF-κB S536 in all samples, although NF-κB was not globally elevated in tumors. However, S536 phosphorylation is not essential for NF-κB transcriptional activity in the canonical pathway.53 The activation of NF-κB contributes to the malignant phenotype of cancers by regulating key genes involved in proliferation, cell survival, inflammation, angiogenesis, invasion, metastasis, and resistance to chemotherapy and radiation.52 Consequently, drugs targeting NF-κB activation are in human clinical trials for HNSCC and other cancers. Because IκB-α S32 was increased in only approximately half of the tumor samples, a theranostic test using RPPA would be helpful to identify HNSCC patients likely to benefit from drugs targeting this pathway.
Increased phosphorylation of the Chks was one of the most frequent findings in HNSCC specimens, occurring in 60% to 70% of samples with an average of more than 2.6-fold higher levels of Chk1 S345 or Chk2S33-35 in tumors. Serine phosphorylation of these residues has been associated with activation of the Chks,54,55 usually in response to DNA damage. Our results in primary HNSCC are consistent with previous reports describing constitutive activation of Chk2 and Chk1 in several other cancer types.56,57 Because cell cycle checkpoints generally represent a barrier to carcinogenesis, tumors commonly evolve with defects in certain components of their DNA damage response (eg, mutations in p53).56,58 Tumors with p53 mutations become more dependent on remaining checkpoints, such as Chk1 or Chk2, to arrest and repair after exposure to DNA-damaging agents. Thus, tumors with loss of p53 can be sensitized to chemotherapy or radiation by Chk inhibitors in a synthetic lethal fashion.59 Consequently, constitutive elevation of Chk1 S345 or Chk2S33-35 may be potential biomarkers for patients that would respond to drugs targeting these pathways in combination with chemotherapy or radiation.
Increased eIF4E S209 occurred in approximately one-third of HNSCC tumor samples, consistent with the role that eIF4E has in tumorigenesis.60 Overexpression and amplification of eIF4E have been reported to occur in a variety of human cancers, in which it correlates with poor prognosis,61 including HNSCC.62 The rate-limiting step in protein translation is controlled by eIF4E, which recruits capped mRNA to ribosomes. Protein translation is deregulated in cancer and proteins encoded by mRNAs with a long 5′ UTR or complex secondary structure, such as VEGF and cyclin D1, are more dependent on excess pools of activated eIF4E for translation.63 Phosphorylation on S209 activates the protein's ability to bind capped mRNA and initiate translation. Because eIF4E is considered an attractive drug target for cancer therapy, S209 phosphorylation may prove to be a useful biomarker in patients with HNSCC.
Although overexpression of total EGFR protein is a common finding in HNSCC,5 increased phosphorylation of EGFR in tumors relative to nonmalignant specimens was not observed for most cases in this study by either RPPA or IHC. Few studies, if any, have reported increased phosphorylation of EGFR in primary HNSCC. Possibly, basal phosphorylation of EGFR may not be a good indicator of the receptor's use in tumors because of the dynamics of dephosphorylation. For example, many established HNSCC lines in vitro have low basal EGFR phosphorylation when grown in the continued presence of serum, yet the same cell lines are susceptible to drugs inhibiting the EGFR (unpublished observation, M. Frederick, Ph.D., 2009). Nevertheless, three patients (ie, approximately 10%) did show concomitant elevation of EGFR Y992, Y1045, Y1068, Y1173, and ErbB2, strongly suggesting activation of the EGFR pathway. Interestingly, all three of these tumors had large copy number gains of the EGFR gene. It is tempting to speculate that, in the absence of point mutations and gene amplifications, the otherwise modest levels of EGFR overexpression may have limited biological significance in HNSCC.
Several analytes were significantly diminished in HNSCC tumors compared with nonmalignant samples. Reduced Akt T308 and Akt S473 levels were apparent in patient tumors. Although this finding was unpredicted, it is not unprecedented. Tosi et al30 also found both Akt S473 and T308 levels to be higher for nonmalignant mucosa samples when compared with matching HNSCC in Western blots prepared from snap-frozen specimens. In another study29 using lysates prepared from snap-frozen biopsy specimens, levels of Akt S473 were fairly comparable between nonmalignant and HNSCC tumor specimens. Higher levels of Akt S473 in HNSCC tumors have been reported after IHC of formalin-fixed specimens.27 However, dephosphorylation of Akt is known to occur rapidly in tissues after devascularization; and it is unclear what effects this would have on normal and tumor specimens collected and formalin fixed in a clinical setting. It is also possible that important differences do exist between HNSCC tumors and nonmalignant epithelium with respect to the nuclear and cytoplasmic localization of phosphorylated Akt because our studies were not designed to make these distinctions. Nevertheless, there was good agreement between the Akt T308 and S473 end points among all samples (r = 0.65), suggesting that measurements for these analytes accurately reflected activation of the Akt pathway. Although hyperplasia was prevalent in the nonmalignant samples, it is unlikely to account for elevated Akt phosphorylation because none of the analytes (including Akt) was significantly associated with hyperplasia.
Unlike hyperplasia, dysplasia was associated with elevation of more than 20 analytes. The many statistically significant end points were not an artifact arising from analysis performed on a small set of samples because a parallel analysis using a different group of six nonmalignant samples chosen at random failed to find any significant differences (data not shown). Moreover, an unsupervised cluster analysis performed with all 48 samples (including both tumor and nonmalignant specimens) placed all six dysplastic samples into the same cluster (cluster N1, Figure 1), suggesting a possible signature for dysplasia.
Many end points elevated in dysplastic specimens were also increased in tumors as a group, suggesting the early involvement of these pathways in tumorigenesis. However, there were also analytes increased in dysplasia that were reduced in tumors, suggesting that additional changes were occurring during the progression to invasive HNSCC. Possibly, the increased expression of some of these end points in dysplastic samples could have inflated the group average of nonmalignant samples, making the tumors appear decreased by comparison. However, this was not the case because all of the end points globally elevated in the nonmalignant controls were still statistically increased compared with tumor specimens, even when dysplastic samples were excluded from the analysis.
Although PKC ζ/ι T410-T412 was one of the end points most significantly increased in dysplasia, it is unclear which of the atypical PKC isoforms contributed to the signal. Both PKC ι and ζ levels were higher in dysplastic samples, although the differences were just short of being statistically significant for each. Consistent with our results, Cohen et al64 found increased protein expression of PKC ζ and PKC ζ/ι T410-T412 by IHC in specimens with oral dysplasia. However, the antibodies used in their study were incapable of distinguishing between the two atypical PKC isoforms, thereby raising the question of whether the ι isoform could have accounted for their findings.
Because of the many end points analyzed in this study and limiting amounts of tissue, it was only possible to validate a few findings by Western analysis and IHC. However, multiple correlations between end points presumed to be part of the same pathways did provide additional internal validation. In general, high correlations were observed for analytes that corresponded to the same protein but differed solely by the residue phosphorylated. For example, correlations between EGFR Y1173, Y1068, Y1045, and Y992 all ranged from 0.74 to 0.87. Strong correlations were similarly observed for VEGFR Y951 and Y996, Akt S473 and T308, and p70S6K T389, S371, and T412. In many instances, these relationships extended to different proteins part of the same activation pathways, as exemplified by signaling modules (found through correlational analysis; Figure 10) that were confirmed in the scientific literature.
The feasibility of using RPPA analysis as a potential theranostic platform for HNSCC samples was also examined. Considering that a matched nonmalignant specimen from the same tissue may not always be available for comparison, it was important to address whether measurements made on tumor specimens alone could theoretically be used to infer whether an end point is abnormally elevated. By using cutoff values based on a group average for nonmalignant specimens, it was possible to define an upper threshold for each end point at which tumor specimens would be considered positive by the RPPA test result. For 18 end points, the positive predictive value was greater than 84%; and for 17 end points, both the positive predictive value and the specificity were greater than 75%. Because PKC ζ/ι T410-412, PKC ι, IκB-α S32, B-RAF S445, PDGFR Y751, and several phosphorylated EGFR analytes were among those that worked well, it may be feasible and clinically useful to develop an RPPA test examining these and other markers in patient tumors.
Acknowledgments
We thank Carol Johnston, M.S., for her considerable help performing IHC.
Footnotes
Supported by the Thyroid, Head, and Neck Cancer Foundation Junior Investigator Award (M.J.F.); the University of Texas M.D. Anderson Cancer Center PANTHEON Program (J.N.M.); the NIH Specialized Program of Research Excellence (grant P50CA097007 to J.N.M.); the Ballantyne Distinguished Chair Fund (G.L.C.); various Head and Neck Departmental Research donor funds from patients and the community (R.S.W.); and NIH Cancer Center Support grant CA016672.
Supplemental material for this article can be found at http://ajp.amjpathol.org or at doi: 10.1016/j.ajpath.2010.10.044.
Supplementary data
Specificity of antibodies to total PKC ζ and ι. A: Schematic diagram of PKC ζ and ι molecules, including recognition sites of various isoform-specific antibodies. Solid blue regions represent highly homologous domains between the isozymes. Green and red regions have the lowest homology and are, therefore, the site of epitopes recognized by the isoform-specific antibodies. B: Western blots validating the specificity of anti–PKC ζ (Ab 9372) and anti–PKC ι (N-20, H-76, and Ab 2998). Recombinant PKC ζ, PKC ι, or bovine serum albumin control (50 μg) was loaded onto SDS gels before blotting.
Fluorescent staining (Sypro Ruby) of arrayed samples for protein normalization. The LCM procured lysates from tumor (T) or matching nonmalignant mucosa (N) were arrayed in horizontal four-point dilution and vertical duplicate. Nonmalignant samples were arrayed directly underneath tumor samples from the same patient. The area outlined in red corresponds to matched samples from patients 1 to 23. Samples outside the outlined region were from unmatched patients, control cell lines, or irrelevant cell lines.
End points elevated for specific patient tumors only. Four examples are shown, for which the group differences between tumor and normal were not statistically significant; however, there was considerable elevation in tumors from specific patients. *End point is elevated in patient tumor compared with matched control using the magnitude and ratio criteria described in the text. For each end point, there is a different cutoff for magnitude and ratio derived from averaging measurements taken from the nonmalignant samples.
Technical validation of RPPA by Western blotting. Two protein end points, Chk1 S345 and PDGFR Y751, were compared in lysates by Western blotting and RPPA detection. A: The HNSCC lines HN5 or HN31 were exposed to 75-mJ UV radiation and protein harvested 1 hour later. Lysates from UV-treated cells were mixed at varying ratios with lysates from untreated cells to form a calibration series that was examined for Chk1 S345 expression by both Western blotting and RPPA. A scatterplot to the right of the blots compares values obtained by RPPA versus integrated optical densities (IODs) obtained by densitometry of the bands from the blots. B: The HNSCC lines UMSCC25 or MDA1386 were incubated with PDGF-BB ligand (7 ng/ml) for 10 minutes to stimulate phosphorylation of PDGFR. Lysates from PDGF-treated cells were mixed at varying ratios with lysates from untreated cells to form a calibration series that was examined for PDGFR Y751 expression by both Western blotting and RPPA. A scatterplot to the right of the blots compares values obtained by RPPA versus IODs obtained by densitometry of the bands from the blots.
Validation of select end points by ultrasensitive Western blotting. A through D: Protein from LCM specimens (1 to 3 μg) was resolved by SDS–polyacrylamide gel electrophoresis and probed with antibodies indicated, using an ultrasensitive technique described in the Materials and Methods section. Blots were either stripped or reprobed for actin; when the molecular weights were different enough, the blots were cut before incubating with antibodies. E and F: Bar graphs depicting RPPA data from patients for ChK2 S33/35 and AKTS473 for comparison with Western blots.
Correlation between end points detected by phosphospecific PKC antibody and isoform-specific antibodies. A: Circles depict the log2 EC50 values for total PKC ι (y axis) and phosphospecific PKC ζ/ι (x axis) from each patient for all samples. B: Circles depict the log2 EC50 values for total PKC ι (y axis) and phosphospecific PKC ζ/ι (x axis) for just tumor samples. C: Triangles depict the log2 EC50 values for total PKC ζ (y axis) and phosphospecific PKC ζ/ι (x axis) from each patient for all samples. D: Triangles depict the log2 EC50 values for total PKC ζ (y axis) and phosphospecific PKC ζ/ι (x axis) for just tumor samples.
Activation of the EGFR pathway in three tumors from select patients. Comparison of the EC50 values for six end points associated with the EGFR signaling pathway from patients 5 (A), 21 (B), and 24 (C). For reference, the average EC50 value for nonmalignant samples and tumors (excluding patients 5, 21, and 24) from all patients is represented by the stippled and checkered bars, respectively. *End points elevated in tumor compared with matched control using the magnitude and ratio method described in the text. Amplification of the EGFR gene was demonstrated in patients 21 and 24 by fluorescence in situ hybridization (D).
Real-time PCR quantitation of PKC ι gene copy number in HNSCC lines. The level of PKC ι gene present in 17 HNSCC lines and 2 non–small cell lung cancer (H520 and H1703) lines was measured by real-time PCR using a copy number assay (TaqMan) and normalized to the RNase P gene that served as an internal control. Copy numbers greater than two represent amplification.
References
- 1.Parkin D.M., Bray F., Ferlay J., Pisani P. Estimating the world cancer burden: globocan 2000. Int J Cancer. 2001;94:153–156. doi: 10.1002/ijc.1440. [DOI] [PubMed] [Google Scholar]
- 2.Jemal A., Siegel R., Ward E., Hao Y., Xu J., Thun M.J. Cancer statistics, 2009. CA Cancer J Clin. 2009;59:225–249. doi: 10.3322/caac.20006. [DOI] [PubMed] [Google Scholar]
- 3.Sharma S.V., Settleman J. Oncogene addiction: setting the stage for molecularly targeted cancer therapy. Genes Dev. 2007;21:3214–3231. doi: 10.1101/gad.1609907. [DOI] [PubMed] [Google Scholar]
- 4.Dancey J., Sausville E.A. Issues and progress with protein kinase inhibitors for cancer treatment. Nat Rev Drug Discov. 2003;2:296–313. doi: 10.1038/nrd1066. [DOI] [PubMed] [Google Scholar]
- 5.Rubin G.J., Melhem M.F., Barnes E.L., Tweardy D.J. Quantitative immunohistochemical analysis of transforming growth factor-alpha and epidermal growth factor receptor in patients with squamous cell carcinoma of the head and neck. Cancer. 1996;78:1284–1292. doi: 10.1002/(SICI)1097-0142(19960915)78:6<1284::AID-CNCR17>3.0.CO;2-X. [DOI] [PubMed] [Google Scholar]
- 6.Putti T.C., To K.F., Hsu H.C., Chan A.T., Lai G.M., Tse G., Lee Y.S., Whang-Peng J., Millward M., Lin L., Lin X., Lee C.S. Expression of epidermal growth factor receptor in head and neck cancers correlates with clinical progression: a multicentre immunohistochemical study in the Asia-Pacific region. Histopathology. 2002;41:144–151. doi: 10.1046/j.1365-2559.2002.01436.x. [DOI] [PubMed] [Google Scholar]
- 7.Sheikh Ali M.A., Gunduz M., Nagatsuka H., Gunduz E., Cengiz B., Fukushima K., Beder L.B., Demircan K., Fujii M., Yamanaka N., Shimizu K., Grenman R., Nagai N. Expression and mutation analysis of epidermal growth factor receptor in head and neck squamous cell carcinoma. Cancer Sci. 2008;99:1589–1594. doi: 10.1111/j.1349-7006.2008.00861.x. [DOI] [PMC free article] [PubMed] [Google Scholar]
- 8.Temam S., Kawaguchi H., El-Naggar A.K., Jelinek J., Tang H., Liu D.D., Lang W., Issa J.P., Lee J.J., Mao L. Epidermal growth factor receptor copy number alterations correlate with poor clinical outcome in patients with head and neck squamous cancer. J Clin Oncol. 2007;25:2164–2170. doi: 10.1200/JCO.2006.06.6605. [DOI] [PubMed] [Google Scholar]
- 9.Mrhalova M., Plzak J., Betka J., Kodet R. Epidermal growth factor receptor: its expression and copy numbers of EGFR gene in patients with head and neck squamous cell carcinomas. Neoplasma. 2005;52:338–343. [PubMed] [Google Scholar]
- 10.Chung C.H., Ely K., McGavran L., Varella-Garcia M., Parker J., Parker N., Jarrett C., Carter J., Murphy B.A., Netterville J., Burkey B.B., Sinard R., Cmelak A., Levy S., Yarbrough W.G., Slebos R.J., Hirsch F.R. Increased epidermal growth factor receptor gene copy number is associated with poor prognosis in head and neck squamous cell carcinomas. J Clin Oncol. 2006;24:4170–4176. doi: 10.1200/JCO.2006.07.2587. [DOI] [PubMed] [Google Scholar]
- 11.Pomerantz R.G., Grandis J.R. The role of epidermal growth factor receptor in head and neck squamous cell carcinoma. Curr Oncol Rep. 2003;5:140–146. doi: 10.1007/s11912-003-0101-z. [DOI] [PubMed] [Google Scholar]
- 12.Molinolo A.A., Amornphimoltham P., Squarize C.H., Castilho R.M., Patel V., Gutkind J.S. Dysregulated molecular networks in head and neck carcinogenesis. Oral Oncol. 2009;45:324–334. doi: 10.1016/j.oraloncology.2008.07.011. [DOI] [PMC free article] [PubMed] [Google Scholar]
- 13.Brockstein B., Lacouture M., Agulnik M. The role of inhibitors of the epidermal growth factor in management of head and neck cancer. J Natl Compr Canc Netw. 2008;6:696–706. doi: 10.6004/jnccn.2008.0052. [DOI] [PubMed] [Google Scholar]
- 14.Mehra R., Cohen R.B., Burtness B.A. The role of cetuximab for the treatment of squamous cell carcinoma of the head and neck. Clin Adv Hematol Oncol. 2008;6:742–750. [PMC free article] [PubMed] [Google Scholar]
- 15.Loeffler-Ragg J., Schwentner I., Sprinzl G.M., Zwierzina H. EGFR inhibition as a therapy for head and neck squamous cell carcinoma. Expert Opin Investig Drugs. 2008;17:1517–1531. doi: 10.1517/13543784.17.10.1517. [DOI] [PubMed] [Google Scholar]
- 16.Slomiany M.G., Black L.A., Kibbey M.M., Tingler M.A., Day T.A., Rosenzweig S.A. Insulin-like growth factor-1 receptor and ligand targeting in head and neck squamous cell carcinoma. Cancer Lett. 2007;248:269–279. doi: 10.1016/j.canlet.2006.08.004. [DOI] [PubMed] [Google Scholar]
- 17.Brady G., Crean S.J., Naik P., Kapas S. Upregulation of IGF-2 and IGF-1 receptor expression in oral cancer cell lines. Int J Oncol. 2007;31:875–881. [PubMed] [Google Scholar]
- 18.Grandis J.R., Drenning S.D., Zeng Q., Watkins S.C., Melhem M.F., Endo S., Johnson D.E., Huang L., He Y., Kim J.D. Constitutive activation of Stat3 signaling abrogates apoptosis in squamous cell carcinogenesis in vivo. Proc Natl Acad Sci U S A. 2000;97:4227–4232. doi: 10.1073/pnas.97.8.4227. [DOI] [PMC free article] [PubMed] [Google Scholar]
- 19.Nagpal J.K., Mishra R., Das B.R. Activation of Stat-3 as one of the early events in tobacco chewing-mediated oral carcinogenesis. Cancer. 2002;94:2393–2400. doi: 10.1002/cncr.10499. [DOI] [PubMed] [Google Scholar]
- 20.Masuda M., Suzui M., Yasumatu R., Nakashima T., Kuratomi Y., Azuma K., Tomita K., Komiyama S., Weinstein I.B. Constitutive activation of signal transducers and activators of transcription 3 correlates with cyclin D1 overexpression and may provide a novel prognostic marker in head and neck squamous cell carcinoma. Cancer Res. 2002;62:3351–3355. [PubMed] [Google Scholar]
- 21.Ondrey F.G., Dong G., Sunwoo J., Chen Z., Wolf J.S., Crowl-Bancroft C.V., Mukaida N., Van Waes C. Constitutive activation of transcription factors NF-(kappa)B, AP-1, and NF-IL6 in human head and neck squamous cell carcinoma cell lines that express pro-inflammatory and pro-angiogenic cytokines. Mol Carcinog. 1999;26:119–129. doi: 10.1002/(sici)1098-2744(199910)26:2<119::aid-mc6>3.0.co;2-n. [DOI] [PubMed] [Google Scholar]
- 22.Tamatani T., Azuma M., Aota K., Yamashita T., Bando T., Sato M. Enhanced IkappaB kinase activity is responsible for the augmented activity of NF-kappaB in human head and neck carcinoma cells. Cancer Lett. 2001;171:165–172. doi: 10.1016/s0304-3835(01)00611-5. [DOI] [PubMed] [Google Scholar]
- 23.Nakayama H., Ikebe T., Beppu M., Shirasuna K. High expression levels of nuclear factor kappaB: IkappaB kinase alpha and Akt kinase in squamous cell carcinoma of the oral cavity. Cancer. 2001;92:3037–3044. doi: 10.1002/1097-0142(20011215)92:12<3037::aid-cncr10171>3.0.co;2-#. [DOI] [PubMed] [Google Scholar]
- 24.Leeman R.J., Lui V.W., Grandis J.R. STAT3 as a therapeutic target in head and neck cancer. Expert Opin Biol Ther. 2006;6:231–241. doi: 10.1517/14712598.6.3.231. [DOI] [PubMed] [Google Scholar]
- 25.Lun M., Zhang P.L., Pellitteri P.K., Law A., Kennedy T.L., Brown R.E. Nuclear factor-kappaB pathway as a therapeutic target in head and neck squamous cell carcinoma: pharmaceutical and molecular validation in human cell lines using Velcade and siRNA/NF-kappaB. Ann Clin Lab Sci. 2005;35:251–258. [PubMed] [Google Scholar]
- 26.Aggarwal S., Takada Y., Singh S., Myers J.N., Aggarwal B.B. Inhibition of growth and survival of human head and neck squamous cell carcinoma cells by curcumin via modulation of nuclear factor-kappaB signaling. Int J Cancer. 2004;111:679–692. doi: 10.1002/ijc.20333. [DOI] [PubMed] [Google Scholar]
- 27.Amornphimoltham P., Sriuranpong V., Patel V., Benavides F., Conti C.J., Sauk J., Sausville E.A., Molinolo A.A., Gutkind J.S. Persistent activation of the Akt pathway in head and neck squamous cell carcinoma: a potential target for UCN-01. Clin Cancer Res. 2004;10:4029–4037. doi: 10.1158/1078-0432.CCR-03-0249. [DOI] [PubMed] [Google Scholar]
- 28.Mandal M., Younes M., Swan E.A., Jasser S.A., Doan D., Yigitbasi O., McMurphey A., Ludwick J., El-Naggar A.K., Bucana C., Mills G.B., Myers J.N. The Akt inhibitor KP372-1 inhibits proliferation and induces apoptosis and anoikis in squamous cell carcinoma of the head and neck. Oral Oncol. 2006;42:430–439. doi: 10.1016/j.oraloncology.2005.09.011. [DOI] [PMC free article] [PubMed] [Google Scholar]
- 29.Pedrero J.M., Carracedo D.G., Pinto C.M., Zapatero A.H., Rodrigo J.P., Nieto C.S., Gonzalez M.V. Frequent genetic and biochemical alterations of the PI 3-K/AKT/PTEN pathway in head and neck squamous cell carcinoma. Int J Cancer. 2005;114:242–248. doi: 10.1002/ijc.20711. [DOI] [PubMed] [Google Scholar]
- 30.Tosi L., Rinaldi E., Carinci F., Farina A., Pastore A., Pelucchi S., Cassano L., Evangelisti R., Carinci P., Volinia S. Akt, protein kinase C, and mitogen-activated protein kinase phosphorylation status in head and neck squamous cell carcinoma. Head Neck. 2005;27:130–137. doi: 10.1002/hed.20120. [DOI] [PubMed] [Google Scholar]
- 31.Moral M., Paramio J.M. Akt pathway as a target for therapeutic intervention in HNSCC. Histol Histopathol. 2008;23:1269–1278. doi: 10.14670/HH-23.1269. [DOI] [PubMed] [Google Scholar]
- 32.Roesch-Ely M., Nees M., Karsai S., Ruess A., Bogumil R., Warnken U., Schnolzer M., Dietz A., Plinkert P.K., Hofele C., Bosch F.X. Proteomic analysis reveals successive aberrations in protein expression from healthy mucosa to invasive head and neck cancer. Oncogene. 2007;26:54–64. doi: 10.1038/sj.onc.1209770. [DOI] [PubMed] [Google Scholar]
- 33.Baker H., Patel V., Molinolo A.A., Shillitoe E.J., Ensley J.F., Yoo G.H., Meneses-Garcia A., Myers J.N., El-Naggar A.K., Gutkind J.S., Hancock W.S. Proteome-wide analysis of head and neck squamous cell carcinomas using laser-capture microdissection and tandem mass spectrometry. Oral Oncol. 2005;41:183–199. doi: 10.1016/j.oraloncology.2004.08.009. [DOI] [PubMed] [Google Scholar]
- 34.Patel V., Hood B.L., Molinolo A.A., Lee N.H., Conrads T.P., Braisted J.C., Krizman D.B., Veenstra T.D., Gutkind J.S. Proteomic analysis of laser-captured paraffin-embedded tissues: a molecular portrait of head and neck cancer progression. Clin Cancer Res. 2008;14:1002–1014. doi: 10.1158/1078-0432.CCR-07-1497. [DOI] [PubMed] [Google Scholar]
- 35.Sheehan K.M., Gulmann C., Eichler G.S., Weinstein J.N., Barrett H.L., Kay E.W., Conroy R.M., Liotta L.A., Petricoin E.F., III, Sheehan K.M., Gulmann C., Eichler G.S., Weinstein J.N., Barrett H.L., Kay E.W., Conroy R.M., Liotta L.A., Petricoin E.F. Signal pathway profiling of epithelial and stromal compartments of colonic carcinoma reveals epithelial-mesenchymal transition. Oncogene. 2008;27:323–331. doi: 10.1038/sj.onc.1210647. [DOI] [PubMed] [Google Scholar]
- 36.Wulfkuhle J.D., Speer R., Pierobon M., Laird J., Espina V., Deng J., Mammano E., Yang S.X., Swain S.M., Nitti D., Esserman L.J., Belluco C., Liotta L.A., Petricoin E.F., III Multiplexed cell signaling analysis of human breast cancer applications for personalized therapy. J Proteome Res. 2008;7:1508–1517. doi: 10.1021/pr7008127. [DOI] [PubMed] [Google Scholar]
- 37.Remmele W., Schicketanz K.H. Immunohistochemical determination of estrogen and progesterone receptor content in human breast cancer: computer-assisted image analysis (QIC score) vs. subjective grading (IRS) Pathol Res Pract. 1993;189:862–866. doi: 10.1016/S0344-0338(11)81095-2. [DOI] [PubMed] [Google Scholar]
- 38.Benschop J.J., Mohammed S., O'Flaherty M., Heck A.J., Slijper M., Menke F.L., Benschop J.J., Mohammed S., O'Flaherty M., Heck A.J.R., Slijper M., Menke F.L.H. Quantitative phosphoproteomics of early elicitor signaling in Arabidopsis. Mol Cell Proteomics. 2007;6:1198–1214. doi: 10.1074/mcp.M600429-MCP200. [DOI] [PubMed] [Google Scholar]
- 39.Calvo K.R., Liotta L.A., Petricoin E.F. Clinical proteomics: from biomarker discovery and cell signaling profiles to individualized personal therapy. Biosci Rep. 2005;25:107–125. doi: 10.1007/s10540-005-2851-3. [DOI] [PubMed] [Google Scholar]
- 40.Regala R.P., Weems C., Jamieson L., Khoor A., Edell E.S., Lohse C.M., Fields A.P., Regala R.P., Weems C., Jamieson L., Khoor A., Edell E.S., Lohse C.M., Fields A.P. Atypical protein kinase C iota is an oncogene in human non-small cell lung cancer. Cancer Res. 2005;65:8905–8911. doi: 10.1158/0008-5472.CAN-05-2372. [DOI] [PubMed] [Google Scholar]
- 41.Baker A.F., Dragovich T., Ihle N.T., Williams R., Fenoglio-Preiser C., Powis G., Baker A.F., Dragovich T., Ihle N.T., Williams R., Fenoglio-Preiser C., Powis G. Stability of phosphoprotein as a biological marker of tumor signaling. Clin Cancer Res. 2005;11:4338–4340. doi: 10.1158/1078-0432.CCR-05-0422. [DOI] [PubMed] [Google Scholar]
- 42.Niida H., Katsuno Y., Banerjee B., Hande M.P., Nakanishi M. Specific role of Chk1 phosphorylations in cell survival and checkpoint activation. Mol Cell Biol. 2007;27:2572–2581. doi: 10.1128/MCB.01611-06. [DOI] [PMC free article] [PubMed] [Google Scholar]
- 43.Balendran A., Biondi R.M., Cheung P.C., Casamayor A., Deak M., Alessi D.R., Balendran A., Biondi R.M., Cheung P.C., Casamayor A., Deak M., Alessi D.R. A 3-phosphoinositide-dependent protein kinase-1 (PDK1) docking site is required for the phosphorylation of protein kinase Czeta (PKCzeta) and PKC-related kinase 2 by PDK1. J Biol Chem. 2000;275:20806–20813. doi: 10.1074/jbc.M000421200. [DOI] [PubMed] [Google Scholar]
- 44.Chou M.M., Hou W., Johnson J., Graham L.K., Lee M.H., Chen C.S., Newton A.C., Schaffhausen B.S., Toker A. Regulation of protein kinase C zeta by PI 3-kinase and PDK-1. Curr Biol. 1998;8:1069–1077. doi: 10.1016/s0960-9822(98)70444-0. [DOI] [PubMed] [Google Scholar]
- 45.Le Good J.A., Ziegler W.H., Parekh D.B., Alessi D.R., Cohen P., Parker P.J., Le Good J.A., Ziegler W.H., Parekh D.B., Alessi D.R., Cohen P., Parker P.J. Protein kinase C isotypes controlled by phosphoinositide 3-kinase through the protein kinase PDK1. Science. 1998;281:2042–2045. doi: 10.1126/science.281.5385.2042. [DOI] [PubMed] [Google Scholar]
- 46.Singh B., Stoffel A., Gogineni S., Poluri A., Pfister D.G., Shaha A.R., Pathak A., Bosl G., Cordon-Cardo C., Shah J.P., Rao P.H., Singh B., Stoffel A., Gogineni S., Poluri A., Pfister D.G., Shaha A.R., Pathak A., Bosl G., Cordon-Cardo C., Shah J.P., Rao P.H. Amplification of the 3q26.3 locus is associated with progression to invasive cancer and is a negative prognostic factor in head and neck squamous cell carcinomas. Am J Pathol. 2002;161:365–371. doi: 10.1016/S0002-9440(10)64191-0. [DOI] [PMC free article] [PubMed] [Google Scholar]
- 47.Justilien V., Fields A.P. Ect2 links the PKCiota-Par6alpha complex to Rac1 activation and cellular transformation. Oncogene. 2009;28:3597–3607. doi: 10.1038/onc.2009.217. [DOI] [PMC free article] [PubMed] [Google Scholar]
- 48.Kim S.C., Hahn J.S., Min Y.H., Yoo N.C., Ko Y.W., Lee W.J. Constitutive activation of extracellular signal-regulated kinase in human acute leukemias: combined role of activation of MEK, hyperexpression of extracellular signal-regulated kinase, and downregulation of a phosphatase. PAC1 Blood. 1999;93:3893–3899. [PubMed] [Google Scholar]
- 49.Yarbrough W.G., Shores C., Witsell D.L., Weissler M.C., Fidler M.E., Gilmer T.M. ras mutations and expression in head and neck squamous cell carcinomas. Laryngoscope. 1994;104(pt 1):1337–1347. doi: 10.1288/00005537-199411000-00005. [DOI] [PubMed] [Google Scholar]
- 50.McDonald J.S., Jones H., Pavelic Z.P., Pavelic L.J., Stambrook P.J., Gluckman J.L. Immunohistochemical detection of the H-ras, K-ras, and N-ras oncogenes in squamous cell carcinoma of the head and neck. J Oral Pathol Med. 1994;23:342–346. doi: 10.1111/j.1600-0714.1994.tb00073.x. [DOI] [PubMed] [Google Scholar]
- 51.Suzuki A., Akimoto K., Ohno S. Protein kinase C lambda/iota (PKClambda/iota): a PKC isotype essential for the development of multicellular organisms. J Biochem. 2003;133:9–16. doi: 10.1093/jb/mvg018. [DOI] [PubMed] [Google Scholar]
- 52.Allen C.T., Ricker J.L., Chen Z., Van Waes C. Role of activated nuclear factor-kappaB in the pathogenesis and therapy of squamous cell carcinoma of the head and neck. Head Neck. 2007;29:959–971. doi: 10.1002/hed.20615. [DOI] [PubMed] [Google Scholar]
- 53.Sasaki C.Y., Barberi T.J., Ghosh P., Longo D.L. Phosphorylation of RelA/p65 on serine 536 defines an I{kappa}B{alpha}-independent NF-{kappa}B pathway. J Biol Chem. 2005;280:34538–34547. doi: 10.1074/jbc.M504943200. [DOI] [PubMed] [Google Scholar]
- 54.Tian H., Faje A.T., Lee S.L., Jorgensen T.J. Radiation-induced phosphorylation of Chk1 at S345 is associated with p53-dependent cell cycle arrest pathways. Neoplasia. 2002;4:171–180. doi: 10.1038/sj.neo.7900219. [DOI] [PMC free article] [PubMed] [Google Scholar]
- 55.Buscemi G., Carlessi L., Zannini L., Lisanti S., Fontanella E., Canevari S., Delia D. DNA damage-induced cell cycle regulation and function of novel Chk2 phosphoresidues. Mol Cell Biol. 2006;26:7832–7845. doi: 10.1128/MCB.00534-06. [DOI] [PMC free article] [PubMed] [Google Scholar]
- 56.Bartkova J., Horejsi Z., Koed K., Kramer A., Tort F., Zieger K., Guldberg P., Sehested M., Nesland J.M., Lukas C., Orntoft T., Lukas J., Bartek J. DNA damage response as a candidate anti-cancer barrier in early human tumorigenesis. Nature. 2005;434:864–870. doi: 10.1038/nature03482. [DOI] [PubMed] [Google Scholar]
- 57.Martin S.A., Lord C.J., Ashworth A. DNA repair deficiency as a therapeutic target in cancer. Curr Opin Genet Dev. 2008;18:80–86. doi: 10.1016/j.gde.2008.01.016. [DOI] [PubMed] [Google Scholar]
- 58.Halazonetis T.D. Constitutively active DNA damage checkpoint pathways as the driving force for the high frequency of p53 mutations in human cancer [review] DNA Repair. 2004;3:1057–1062. doi: 10.1016/j.dnarep.2004.03.036. [DOI] [PubMed] [Google Scholar]
- 59.Tse A.N., Carvajal R., Schwartz G.K. Targeting checkpoint kinase 1 in cancer therapeutics. Clin Cancer Res. 2007;13:1955–1960. doi: 10.1158/1078-0432.CCR-06-2793. [DOI] [PubMed] [Google Scholar]
- 60.De Benedetti A., Graff J.R. eIF-4E expression and its role in malignancies and metastases. Oncogene. 2004;23:3189–3199. doi: 10.1038/sj.onc.1207545. [DOI] [PubMed] [Google Scholar]
- 61.Topisirovic I., Siddiqui N., Orolicki S., Skrabanek L.A., Tremblay M., Hoang T., Borden K.L. Stability of eukaryotic translation initiation factor 4E mRNA is regulated by HuR, and this activity is dysregulated in cancer. Mol Cell Biol. 2009;29:1152–1162. doi: 10.1128/MCB.01532-08. [DOI] [PMC free article] [PubMed] [Google Scholar]
- 62.Culjkovic B., Borden K.L. Understanding and targeting the eukaryotic translation initiation factor eIF4E in head and neck cancer. J Oncol. 2009;2009:981679. doi: 10.1155/2009/981679. [DOI] [PMC free article] [PubMed] [Google Scholar]
- 63.Mamane Y., Petroulakis E., Martineau Y., Sato T.A., Larsson O., Rajasekhar V.K., Sonenberg N. Epigenetic activation of a subset of mRNAs by eIF4E explains its effects on cell proliferation. PLoS One. 2007;2:e242. doi: 10.1371/journal.pone.0000242. [DOI] [PMC free article] [PubMed] [Google Scholar]
- 64.Cohen E.E., Lingen M.W., Zhu B., Zhu H., Straza M.W., Pierce C., Martin L.E., Rosner M.R. Protein kinase C zeta mediates epidermal growth factor-induced growth of head and neck tumor cells by regulating mitogen-activated protein kinase. Cancer Res. 2006;66:6296–6303. doi: 10.1158/0008-5472.CAN-05-3139. [DOI] [PubMed] [Google Scholar]
Associated Data
This section collects any data citations, data availability statements, or supplementary materials included in this article.
Supplementary Materials
Specificity of antibodies to total PKC ζ and ι. A: Schematic diagram of PKC ζ and ι molecules, including recognition sites of various isoform-specific antibodies. Solid blue regions represent highly homologous domains between the isozymes. Green and red regions have the lowest homology and are, therefore, the site of epitopes recognized by the isoform-specific antibodies. B: Western blots validating the specificity of anti–PKC ζ (Ab 9372) and anti–PKC ι (N-20, H-76, and Ab 2998). Recombinant PKC ζ, PKC ι, or bovine serum albumin control (50 μg) was loaded onto SDS gels before blotting.
Fluorescent staining (Sypro Ruby) of arrayed samples for protein normalization. The LCM procured lysates from tumor (T) or matching nonmalignant mucosa (N) were arrayed in horizontal four-point dilution and vertical duplicate. Nonmalignant samples were arrayed directly underneath tumor samples from the same patient. The area outlined in red corresponds to matched samples from patients 1 to 23. Samples outside the outlined region were from unmatched patients, control cell lines, or irrelevant cell lines.
End points elevated for specific patient tumors only. Four examples are shown, for which the group differences between tumor and normal were not statistically significant; however, there was considerable elevation in tumors from specific patients. *End point is elevated in patient tumor compared with matched control using the magnitude and ratio criteria described in the text. For each end point, there is a different cutoff for magnitude and ratio derived from averaging measurements taken from the nonmalignant samples.
Technical validation of RPPA by Western blotting. Two protein end points, Chk1 S345 and PDGFR Y751, were compared in lysates by Western blotting and RPPA detection. A: The HNSCC lines HN5 or HN31 were exposed to 75-mJ UV radiation and protein harvested 1 hour later. Lysates from UV-treated cells were mixed at varying ratios with lysates from untreated cells to form a calibration series that was examined for Chk1 S345 expression by both Western blotting and RPPA. A scatterplot to the right of the blots compares values obtained by RPPA versus integrated optical densities (IODs) obtained by densitometry of the bands from the blots. B: The HNSCC lines UMSCC25 or MDA1386 were incubated with PDGF-BB ligand (7 ng/ml) for 10 minutes to stimulate phosphorylation of PDGFR. Lysates from PDGF-treated cells were mixed at varying ratios with lysates from untreated cells to form a calibration series that was examined for PDGFR Y751 expression by both Western blotting and RPPA. A scatterplot to the right of the blots compares values obtained by RPPA versus IODs obtained by densitometry of the bands from the blots.
Validation of select end points by ultrasensitive Western blotting. A through D: Protein from LCM specimens (1 to 3 μg) was resolved by SDS–polyacrylamide gel electrophoresis and probed with antibodies indicated, using an ultrasensitive technique described in the Materials and Methods section. Blots were either stripped or reprobed for actin; when the molecular weights were different enough, the blots were cut before incubating with antibodies. E and F: Bar graphs depicting RPPA data from patients for ChK2 S33/35 and AKTS473 for comparison with Western blots.
Correlation between end points detected by phosphospecific PKC antibody and isoform-specific antibodies. A: Circles depict the log2 EC50 values for total PKC ι (y axis) and phosphospecific PKC ζ/ι (x axis) from each patient for all samples. B: Circles depict the log2 EC50 values for total PKC ι (y axis) and phosphospecific PKC ζ/ι (x axis) for just tumor samples. C: Triangles depict the log2 EC50 values for total PKC ζ (y axis) and phosphospecific PKC ζ/ι (x axis) from each patient for all samples. D: Triangles depict the log2 EC50 values for total PKC ζ (y axis) and phosphospecific PKC ζ/ι (x axis) for just tumor samples.
Activation of the EGFR pathway in three tumors from select patients. Comparison of the EC50 values for six end points associated with the EGFR signaling pathway from patients 5 (A), 21 (B), and 24 (C). For reference, the average EC50 value for nonmalignant samples and tumors (excluding patients 5, 21, and 24) from all patients is represented by the stippled and checkered bars, respectively. *End points elevated in tumor compared with matched control using the magnitude and ratio method described in the text. Amplification of the EGFR gene was demonstrated in patients 21 and 24 by fluorescence in situ hybridization (D).
Real-time PCR quantitation of PKC ι gene copy number in HNSCC lines. The level of PKC ι gene present in 17 HNSCC lines and 2 non–small cell lung cancer (H520 and H1703) lines was measured by real-time PCR using a copy number assay (TaqMan) and normalized to the RNase P gene that served as an internal control. Copy numbers greater than two represent amplification.