

Abstract
Recent studies using animal models suggest that expression of FABP5 drives the stimulation of cell growth observed in estrogen receptor (ER)-negative breast cancer cells on exposure to retinoic acid (RA). The purpose of this study was to investigate the clinicopathological significance of FABP5 in breast cancer and to evaluate FABP5 as a prognostic marker and a possible novel therapeutic target in breast cancer. Gene expression microarray analysis revealed a significant correlation between elevated FABP5 RNA levels and ER/progesterone receptor (PR)-negative status, high tumor grade, and poor prognosis. Tissue microarray analysis demonstrated similar correlations with cytoplasmic FABP5 protein. Based on multivariate proportional regression analysis, cytoplasmic FABP5 is a significant and independent prognostic marker of overall survival and recurrence-free survival in breast cancer. The effects of FABP5 on tumor growth appear to be mediated primarily through cytoplasmic FABP, because no correlation was found between nuclear FABP5 and ER/PR-negative status, recurrence, and survival. FABP5 knockdown in breast cancer cell lines demonstrates a correlation between FABP5 levels and growth response to RA. We propose a model whereby growth-promoting FABP5 competes with growth-inhibiting CRABP2 for RA, with retention of RA in the cytoplasm by FABP5 preventing the inhibition of tumor growth.
Breast cancer is the most commonly diagnosed invasive cancer among women and is a leading cause of cancer-related deaths worldwide. During the last few decades, efforts have focused on identifying and understanding the critical molecular pathways and mechanisms governing breast carcinogenesis and progression. Although these studies have revealed marked biological heterogeneity in breast cancers, they have also led to improved management of breast cancer through identification of specific and effective systemic therapies targeting distinct molecular biological subtypes.1,2 Most notably, treatments targeting the estrogen receptor/progesterone receptor (ER/PR) or epidermal growth factor receptor 2 (HER2) have dramatically improved clinical outcomes of the ER/PR-positive and HER2-amplified breast cancer patients, respectively.3,4 However, there are still no validated molecular therapeutic targets for breast cancers lacking these receptors.4
Long-chain polyunsaturated fatty acids (PUFAs) and retinoic acid (RA) are regulators of gene expression that play critical roles in modulating various biological processes, including cell proliferation and differentiation. Accumulating evidence supports a role for these compounds in controlling or inhibiting the growth of human cancer including breast cancer,5–9 but trials of PUFAs and RA in the prevention and treatment of breast cancer have not demonstrated benefit to the patient. Use of RA in cancer therapy, for example, is hampered by both the toxicity of RA and the development of resistance to RA-mediated growth-inhibitory effects during tumorigenesis.10 In fact, RA has been shown to stimulate the growth of a subset of breast cancers.11,12 More recently, RA was found to inhibit proliferation of ER-positive human breast cancer cells, but had no effect on most ER-negative breast cancer cells.13,14 In-depth understanding of the various PUFAs and RA molecular signaling networks in breast cancer cells would facilitate rational evaluation for breast cancer prevention and treatment.15
PUFAs and RA play important roles in gene regulation in both normal and cancer cells by binding and activating their corresponding nuclear receptors, peroxisome proliferator-activated receptors (PPARs), retinoic acid receptors (RARs), or retinoid X receptors (RXRs).16,17 Because PUFAs and RA are hydrophobic molecules, their cellular uptake, transportation, metabolism, and nuclear translocation (as well as interaction with their nuclear receptors) must be facilitated by their corresponding intracellular lipid-binding proteins. To date, at least 17 intracellular lipid-binding proteins, including fatty acid-binding proteins (FABPs), cellular retinol-binding proteins (CRBPs), and cellular retinoic acid-binding proteins (CRABPs) have been identified in vertebrates.18,19 In recent years, some intracellular lipid-binding proteins have emerged as potentially important factors implicated in a variety of human cancers.20,21 In particular, FABP7 and FABP4 have been shown to be associated with the basal phenotype/patient outcome in breast cancer and as a novel prognostic factor in obese breast cancer patients, respectively.22,23 Using a mouse mammary tumor model, alternative activation of different nuclear receptors (RAR and PPARβ) by RA was shown to be mediated by different intracellular lipid-binding proteins (CRABP2 in the case of RAR and FABP5 in the case of PPARβ).11,12 This RA dichotomy may help to explain the opposing effects of RA on different subsets of breast cancer.
Studies with cell lines and animal models support an adverse role for FABP5 in breast cancer biology. In the present study, we used gene profiling and tissue microarray (TMA) analysis to investigate FABP5 expression in a well-characterized cohort of human breast cancers. We demonstrated that FABP5 (RNA and cytoplasmic protein) is preferentially expressed in ER/PR-negative breast cancers and correlates with high histological grade and a poor prognosis. Our results suggest that FABP5 may be an important therapeutic target for ER/PR-negative breast cancer.
Materials and Methods
Patients and Tissue Samples
A total of 176 treatment-naïve primary breast cancer samples and 10 normal breast tissue samples (from reduction mammoplasties) were obtained through the Canadian Breast Cancer Foundation Tumor Bank and were used for gene expression microarray analysis, as previously described.24 Patient material and clinical information was collected under Research Ethics Board Protocol ETH-02-86-17. All tumor tissue samples were frozen in liquid nitrogen within 20 minutes of devitalization. At least 70% of the cells present were invasive tumor cells, based on histological analysis of tissue adjacent to the frozen samples.
Patients received standardized guideline-based chemotherapy and hormone therapy, which include hormone therapy for all patients with ER-positive tumors, trastuzumab for those with HER2-positive tumors, anthracycline chemotherapy for high-risk node-negative disease, and anthracycline plus taxane chemotherapy for node-positive disease. The 176 patients selected for this study comprised 88 patients who experienced early relapse (<5 years after the initial treatment) and 88 patients who had not relapsed (as of September 30, 2009). ER, PR, and HER2 status, stage, and time of follow-up were balanced between the two groups. The median follow-up time for surviving patients was 4.5 years.
Gene Expression Microarray Analysis
Total RNA was isolated from frozen human breast tumor biopsies using TRI reagent (Sigma-Aldrich, Oakville, ON, Canada) and was further purified using Qiagen RNeasy columns (Qiagen, Mississauga, ON, Canada) according to the manufacturer's recommended protocol. The RNA was then quantified using a NanoDrop 1000 spectrophotometer (NanoDrop Technologies, Wilmington, DE) and its integrity was evaluated using a Bioanalyzer 2100 (Agilent Technologies, Santa Clara, CA) according to the manufacturer's protocol. RNA samples with RNA integrity numbers (RIN) greater than 7.0 were used in this study.
The RNA samples were linearly amplified, labeled with Cy3, and hybridized to Agilent whole human genome arrays using Agilent kits (one-color, low RNA input linear amplification kit PLUS; one color RNA spike-in kit; and gene expression hybridization kit) according to the manufacturer's directions. The arrays were scanned using an Agilent scanner. The data were extracted and evaluated for quality using Feature Extraction Software 9.5 and were normalized and analyzed using GeneSpring GX 7.3 (Agilent Technologies). The data used in this publication have been deposited in the U.S. National Center for Biotechnology Information (NCBI) Gene Expression Omnibus25 and are accessible through GEO series accession number GSE22820 (http://www.ncbi.nlm.nih.gov/geo/query/acc.cgi?).
Reverse Transcription-PCR
First-strand cDNAs were synthesized using SuperScript reverse transcriptase II (Invitrogen, Burlington, ON, Canada). The following oligonucleotide primers were used for PCR amplification: FABP5, sense 5′-GAATACATGAAGGAGCTAGG-3′, antisense 5′-ACTGAGCTTGGTCATTCTC-3′; β-actin, sense 5′-CTGGCACCACACCTTCTA C-3′, antisense 5′-CATACTCCTGCTTGCTGATC-3′. The PCR reactions were conducted in 20-μL reaction volumes containing 0.5 U of Taq DNA polymerase, 1.5 mmol/L MgCl2, 200 μmol/L of each dNTP, 0.25 μmol/L of each primer, and 1 μL cDNA template. Following an initial denaturation step at 94°C for 2 minutes, the reaction was subjected to 30 cycles of amplification at 94°C for 30 seconds, 55°C for 30 seconds, and 72°C for 30 seconds, with a final extension at 72°C for 7 minutes. Samples were size-fractionated in a 1% (w/v) agarose gel, and DNA was visualized using ethidium bromide and UV light. Negative controls included all reverse transcription (RT)-PCR components with the exception of the cDNA template.
siRNA Knockdown, Western Blot Analysis, and Immunohistochemistry
Hs578T and MDA-MB-231 cells were transfected with 10 nmol/L scrambled siRNAs (catalog no. 12935–200 and 12935–300; Invitrogen) or 10 nmol/L FABP5 siRNA (5′-UGUACCCUGGGAGAGAAGU-3′; Sigma-Aldrich) using the lipofectamine RNAiMAX reagent (Invitrogen). For immunostaining, cells were harvested 60 hours after transfection, fixed in formalin, embedded in paraffin, and immunostained with anti-FABP5 antibody (1:200 dilution) (HyCult Biotechnology, Canton, MA). For cell growth experiments, transfected cells were seeded in triplicate and cultured in Dulbecco's modified Eagle's medium supplemented with 10% fetal bovine serum for 24 hours before addition of 0, 0.5, 1, or 2 μmol/L all-trans-RA (Sigma-Aldrich). Cells were harvested after 4 days (MDA-MB-231) or 2 days (MCF-7) in culture and were counted using a particle and size analyzer (Coulter Corporation, Hialeah, FL). Cell counts were averaged and were analyzed with Student's t-test.
Western blot analysis was performed using 50 μg whole cell lysates per lane. Proteins were separated by SDS-polyacrylamide gel electrophoresis and were transferred to polyvinylidene difluoride membranes. Blots were immunostained with anti-HA (1:100,000; Santa Cruz Biotechnology, Santa Cruz, CA), anti-FABP5 (1:1000; HyCult Biotechnology), or anti-actin (1:50,000; Sigma-Aldrich) antibodies. Primary antibodies were detected with horseradish peroxidase–conjugated secondary antibodies using the Immobilon Western detection system (Millipore, Billerica, MA).
Tissue Microarray Analysis
Tissue microarrays (TMArrayer; Pathology Devices, Westminster, MD) were generated using all available formalin-fixed paraffin-embedded breast tumor tissue blocks (from 120 of the original 176 patients). The TMA slides contained triplicate core tissue samples (0.6 mm in diameter) from each tumor. TMAs were deparaffinized in xylene, rehydrated, and microwaved for 20 minutes at 750 watts in epitope retrieval buffer (10 mmol/L citrate, 0.05% Tween-20 with pH 6.0). The TMAs were then immunostained with anti-FABP5 antibody (1:200), and the signal was detected using EnVision+ anti-rabbit secondary system (DakoCytomation, Carpinteria, CA). Tissues were counterstained with hematoxylin and scored.
Cytoplasmic and nuclear FABP5 immunoreactivity were scored separately, based on the average staining signal intensity throughout the tumor tissue on a scale of 0 (negative), 1 (weak), 2 (intermediate), and 3 (strong). Cytoplasmic staining was calibrated by scanning all of the tumor tissues to determine the range of staining intensities. The tumors showing the strongest staining were scored as 3, and tumors showing undetectable staining were scored as 0. A score of 1 indicates a weak but detectable signal, and a score of 2 indicates a moderate staining intensity. Of the 120 tumor samples, 109 had sufficient tissue for analysis. With the exception of 9 tumor samples, FABP5 immunoreactivity was consistent in 100% of the tumor cells throughout each core. All samples were independently scored by two observers (D.D.G. and D.R.G.) blinded to clinical outcomes. The agreement between the two sets of scores had a Cohen's κ value of 0.68 (substantial agreement). Cohen's interrater agreement (κ) test was used to evaluate agreement among scores from the triplicate cores. The average κ value was 0.75 (good agreement) and 0.73 (good agreement) for cytoplasmic and nuclear immunoreactivity scores, respectively.
Statistical Analysis
All statistical analysis was performed using MedCalc version 11.1 (MedCalc Software, Mariakerke, Belgium). For gene expression microarray data, FABP5 signal intensity values were log-transformed and receiver operating characteristic (ROC) curve analysis was used to determine the cutoff point for high versus low: 0.768 with sensitivity 70.2 and specificity 43.7 for overall survival and 0.768 with sensitivity 68.2 and specificity 46.6 for recurrence-free survival. For TMA data, cytoplasmic and nuclear staining were separately classified as low (scores of 0 or 1) or high (scores of 2 or 3). Tissues were categorized in this manner because 92.7% of tissue samples showed some immunoreactivity to anti-FABP5 antibody, with considerable cytoplasmic and nuclear variation observed from tissue to tissue. Student's t-test (gene expression microarray data) or χ2 test (TMA data) was used to test the significance of the associations among FABP5 mRNA or immunoreactivity levels and clinicopathologic factors. Overall survival and recurrence-free survival were analyzed using logrank test on Kaplan-Meier survival probabilities. Cox proportional-hazards regression model was used to test independence and statistical significance of different predictive variables (covariates) on overall and recurrence-free survival. The predictive variables shown to be significant in the univariate model and included in the multivariate regression model were ER (negative vs positive), PR (negative vs positive), histological grade (not high vs high), and FABP5 cytoplasmic immunoreactivity (0, 1, 2, 3). The backward-enter method was used to remove the nonsignificant variables (P > 0.10) from the multivariate regression model.
Results
Expression of FABP5 mRNA in Human Breast Cancer Tumors and Cell Lines
Gene expression profiling of 176 primary human breast tumors and 10 normal breast tissue samples was performed. Eighty-eight tumors (50%) were from patients who had suffered an early relapse, of whom 57 (32%) were deceased at the time of last data update (Table 1). The average relative FABP5 mRNA level (measured by normalized gene expression microarray hybridization signal intensity) for the 176 tumors was 1.60 (SEM = 0.13). Analysis of FABP5 mRNA levels obtained for three different oligonucleotides targeting the FABP5 transcript revealed significant correlation, with an average correlation coefficient r = 0.66 (P < 0.0001 for all correlations), indicating high reproducibility of the gene expression microarray data. The average FABP5 mRNA level for the 10 normal breast tissues was 1.31 (SEM = 0.21). Independent t-test comparison of the means of FABP5 mRNA levels between tumors and normal tissues showed no significant difference (P = 0.2663).
Table 1.
Clinicopathologic Associations with FABP5 in Human Breast Cancer
| Factors | Gene expression microarray |
Tissue microarray |
|||||||||||||
|---|---|---|---|---|---|---|---|---|---|---|---|---|---|---|---|
| Sample size, no. | Geometric mean | P | Cytoplasmic immunoreactivity |
Nuclear immunoreactivity |
|||||||||||
| 0 | 1 | 2 | 3 | P | Ptrend | 0 | 1 | 2 | 3 | P | Ptrend | ||||
| ER | |||||||||||||||
| Negative | 64 | 1.73 | <0.0001 | 1 | 8 | 18 | 15 | 0.0009 | 0.0001 | 2 | 8 | 17 | 15 | 0.549 | 0.716 |
| Positive | 112 | 0.85 | 7 | 31 | 22 | 7 | 2 | 12 | 36 | 17 | |||||
| PR | |||||||||||||||
| Negative | 82 | 1.54 | <0.0001 | 1 | 13 | 24 | 15 | 0.0041 | 0.0004 | 3 | 11 | 22 | 17 | 0.428 | 0.637 |
| Positive | 94 | 0.82 | 7 | 26 | 16 | 7 | 1 | 9 | 31 | 15 | |||||
| Her2 | |||||||||||||||
| Negative | 146 | 1.15 | 0.054 | 6 | 29 | 34 | 19 | 0.551 | 0.196 | 3 | 18 | 41 | 26 | 0.663 | 0.705 |
| Positive | 30 | 0.89 | 2 | 10 | 6 | 3 | 1 | 2 | 12 | 6 | |||||
| ER/PR/Her2 | |||||||||||||||
| Triple negative | 56 | 1.36 | <0.0001 | 0 | 7 | 16 | 14 | 0.0005 | <0.0001 | 2 | 7 | 15 | 13 | 0.602 | 0.869 |
| Positive | 120 | 0.93 | 8 | 32 | 24 | 8 | 2 | 13 | 38 | 19 | |||||
| Age | |||||||||||||||
| ≤60 | 127 | 1.20 | 0.026 | 1 | 13 | 13 | 3 | 0.242 | 0.473 | 1 | 7 | 16 | 6 | 0.573 | 0.265 |
| >60 | 49 | 0.88 | 7 | 26 | 27 | 19 | 3 | 13 | 37 | 26 | |||||
| Menopausal status | |||||||||||||||
| Pre | 60 | 1.32 | 0.031 | 3 | 11 | 15 | 9 | 0.686 | 0.382 | 1 | 5 | 19 | 13 | 0.713 | 0.269 |
| Post | 101 | 0.99 | 4 | 24 | 22 | 10 | 2 | 12 | 31 | 15 | |||||
| Family history | |||||||||||||||
| No | 97 | 1.09 | 0.795 | 3 | 21 | 25 | 14 | 0.549 | 0.206 | 3 | 11 | 29 | 20 | 0.821 | 0.870 |
| Yes | 77 | 1.12 | 5 | 17 | 15 | 8 | 1 | 9 | 23 | 12 | |||||
| Death | |||||||||||||||
| No | 119 | 1.04 | 0.200 | 8 | 30 | 22 | 11 | 0.014 | 0.002 | 3 | 13 | 40 | 15 | 0.061 | 0.092 |
| Yes | 57 | 1.24 | 0 | 9 | 18 | 11 | 1 | 7 | 13 | 17 | |||||
| Recurrence | |||||||||||||||
| No | 88 | 1.04 | 0.349 | 6 | 20 | 17 | 5 | 0.044 | 0.006 | 2 | 9 | 26 | 11 | 0.611 | 0.358 |
| Yes | 88 | 1.17 | 2 | 19 | 23 | 17 | 2 | 11 | 27 | 21 | |||||
| Tumor Size | |||||||||||||||
| ≤2.0 cm | 72 | 1.12 | 0.875 | 3 | 26 | 27 | 14 | 0.427 | 0.465 | 3 | 13 | 33 | 21 | 0.956 | 0.886 |
| >2.0 cm | 104 | 1.10 | 5 | 13 | 13 | 8 | 1 | 7 | 20 | 11 | |||||
| Surgical type | |||||||||||||||
| Ductal | 152 | 1.64 | 0.016 | 6 | 33 | 36 | 19 | 0.670 | 0.437 | 3 | 17 | 46 | 28 | 0.732 | 0.550 |
| Lobular | 13 | 1.00 | 1 | 5 | 2 | 2 | 0 | 3 | 5 | 2 | |||||
| Nodal status | |||||||||||||||
| pN0 | 69 | 1.22 | 0.193 | 4 | 15 | 14 | 10 | 0.789 | 0.997 | 2 | 9 | 23 | 9 | 0.474 | 0.166 |
| pN1–3 | 106 | 1.04 | 4 | 24 | 26 | 12 | 2 | 11 | 30 | 23 | |||||
| Cancer stage | |||||||||||||||
| I | 45 | 1.24 | 0.270 | 4 | 9 | 9 | 5 | 0.399 | 0.331 | 2 | 4 | 16 | 5 | 0.275 | 0.262 |
| II–III | 131 | 1.06 | 4 | 30 | 31 | 17 | 2 | 16 | 37 | 27 | |||||
| Nuclear grade | |||||||||||||||
| Low | 44 | 0.84 | 0.009 | 4 | 11 | 9 | 1 | 0.043 | 0.007 | 0 | 4 | 17 | 4 | 0.124 | 0.791 |
| High | 132 | 1.21 | 4 | 28 | 31 | 21 | 4 | 16 | 36 | 28 | |||||
| Mitotic grade | |||||||||||||||
| Low | 78 | 0.78 | <0.0001 | 6 | 21 | 16 | 2 | 0.001 | 0.0001 | 1 | 10 | 26 | 8 | 0.117 | 0.164 |
| High | 98 | 1.45 | 2 | 18 | 24 | 20 | 3 | 10 | 27 | 24 | |||||
| Architectural grade | |||||||||||||||
| Low | 29 | 0.74 | 0.004 | 2 | 5 | 3 | 1 | 0.345 | 0.089 | 0 | 2 | 6 | 3 | 0.907 | 0.810 |
| High | 147 | 1.19 | 6 | 34 | 37 | 21 | 4 | 18 | 47 | 29 | |||||
| Overall grade | |||||||||||||||
| Low | 56 | 0.74 | <0.0001 | 5 | 15 | 11 | 1 | 0.006 | 0.0006 | 0 | 7 | 18 | 7 | 0.337 | 0.754 |
| High | 120 | 1.33 | 3 | 24 | 29 | 21 | 4 | 13 | 35 | 25 | |||||
ER, estrogen receptor; PR, progesterone receptor.
P values indicate statistical significance level of t-test or χ2 test. Ptrend values indicate significance level of χ2 test for a linear trend between the four cytoplasmic FABP5 immunoreactivity levels and a specific clinicopathological factor. Significant values are highlighted in bold.
To verify the relative levels of FABP5 transcripts in the gene expression microarray, we performed semiquantitative RT-PCR analysis on 35 breast cancer tissues (Figure 1A). Each PCR band was quantitated using β-actin as the standard and the resulting values, compared with the corresponding gene expression microarray signal intensity scores using Spearman's rank correlation analysis (Figure 1B). The coefficient of rank correlation ρ = 0.71 (P < 0.0001) indicates that the semiquantitative RT-PCR data are in good agreement with the gene expression microarray data. We also analyzed 11 breast cancer cell lines for FABP5 mRNA expression by semiquantitative RT-PCR. FABP5 RNA at varying levels was detected in 7 of the 11 cell lines (Figure 1C). Of these seven cell lines, the three with the highest levels of FABP5 mRNA (Hs578T, HTB-129, and MDA-MB231) have been reported to be negative for ER and PR.26,27 MDA-MB231 is also negative for HER2,27 but the HER2 status of HTB-129 and Hs578T is not known.
Figure 1.
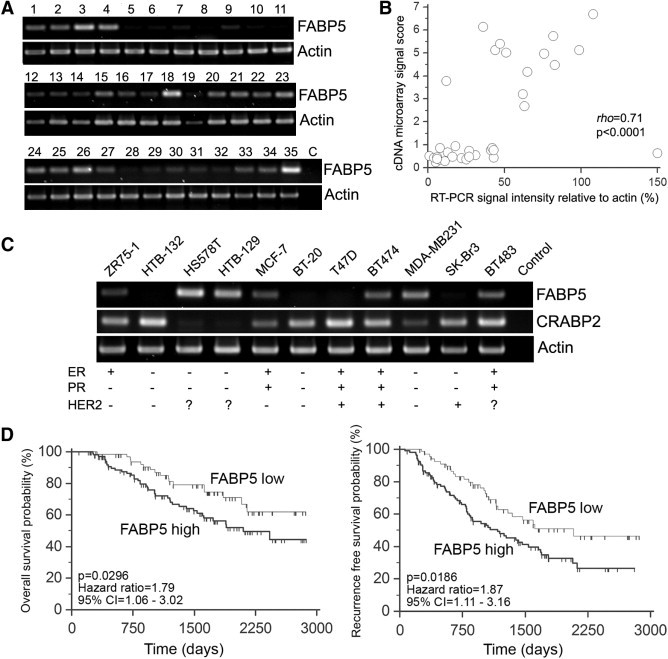
A: RT-PCR analysis of FABP5 in human breast cancer tissue samples. B: Spearman's rank correlation between FABP5 RT-PCR band intensities and gene expression microarray signal intensity scores. C: RT-PCR analysis of FABP5 and CRABP2 in breast cancer cell lines, with ER/PR/HER2 status. D: Kaplan-Meier survival curves of patients with relative FABP5 mRNA levels of >0.77 (high, n = 107), compared with patients with relative FABP5 mRNA levels of ≤0.77 (low, n = 69). Left: Overall survival. Right: Recurrence-free survival.
FABP5 mRNA Levels Are Significantly Higher in ER/PR-Negative Tumors and Are Associated with High Tumor Grade and Poor Prognosis
Correlation of FABP5 mRNA levels with ER/PR status and other commonly used clinicopathological parameters was examined using Student's t-test (Table 1). FABP5 mRNA levels were significantly higher in ER-negative (P < 0.0001) and PR-negative (P < 0.0001) tumors, compared with ER/PR-positive tumors. The ratio of geometric (and arithmetic) means for negative versus positive tumors was 2.03 (2.55) for ER and 1.76 (2.36) for PR. These results suggest preferential expression of FABP5 in ER/PR-negative breast cancers. The difference in FABP5 mRNA levels between HER2-negative and -positive tumors did not reach significance [P = 0.0538; ratio = 1.29 (1.57)]; however, FABP5 RNA levels were significantly higher in triple-negative breast cancers [P = 0.0001; ratio = 1.46 (2.21)]. FABP5 mRNA levels were elevated in tumors with a high histological grade, compared with tumors with a low histological grade (P < 0.0001). High levels of FABP5 mRNA were also associated with younger age (dichotomized at 60 years; P = 0.026), premenopausal status (P = 0.031), and ductal rather than lobular histology (P = 0.016).
To examine the relationship between FABP5 mRNA levels and patient outcomes, normalized gene expression microarray signal intensity scores were categorized into high versus low, using a cutoff point of 0.768 as defined in Materials and Methods. Of the 176 patients, 107 (61%) were classified as having high FABP5 mRNA (>0.768) and 69 (39%) as having low FABP5 mRNA (≤0.768). The relationship between FABP5 mRNA levels and overall survival (Figure 1D, left) or recurrence-free survival (Figure 1D, right) was assessed using the log-rank test on Kaplan-Meier survival probabilities. Patients with high FABP5 mRNA levels had a significantly lower probability of survival than those with low FABP5 levels [log-rank test P = 0.0296, hazard ratio (HR) = 1.79, 95% confidence interval (CI) = 1.06 to 3.02]. Similarly, high FABP5 mRNA levels were significantly associated with the probability of recurrence-free survival (P = 0.0186, HR = 1.87, 95% CI = 1.11 to 3.16).
Examination of two breast cancer gene expression microarray datasets (accession numbers GDS225028 and GDS132929) deposited in the GEO database at NCBI (http://www.ncbi.nlm.gov/) revealed higher levels of FABP5 in basal type or basal-like type breast cancers, compared with non–basal-like tumors or normal breast tissue (data not shown). Because basal breast cancers are characterized by negative ER/PR status and poor prognosis, these data are in general agreement with our observations. We further verified the prognostic significance of FABP5 by survival analysis using a publicly accessible online tool (http://kmplot.com/breast/), KM Plotter.30 Recurrence-free survival of 1593 patients classified using a median expression cutoff for FABP5 indicates that high FABP5 expression correlates with shorter survival (log-rank P = 1.5 × 10⁻⁶, HR = 1.4) (Figure 2).
Figure 2.
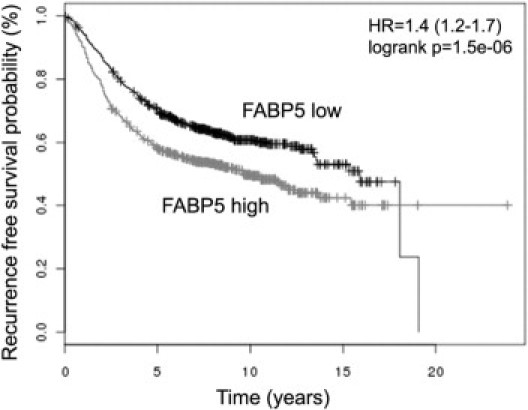
Online analysis of recurrence-free survival in breast cancer patients with high and low levels of FABP5 mRNA. Plots were generated using the publicly accessible tool KM Plotter (http://kmplot.com/breast/). The high- and low-FABP5 groups were split based on the median value calculated across the entire dataset to generate two groups of equal size. Sample size: n = 1592.
Cytoplasmic FABP5 Immunoreactivity Is Associated with Negative Clinicopathologic Features
FABP5 is an intracellular protein found in both the cytoplasm and the nucleus. Its translocation to the nucleus in response to RA facilitates PPARβ activation, which in turn affects cell survival/proliferation.11 To gain insight into possible mechanisms of action of FABP5 protein, we examined its subcellular distribution in 120 of the 176 breast cancers included in the gene expression microarray. To ensure that the anti-FABP5 antibody used for these analyses did not cross-react with other members of the FABP family expressed in breast cancer (ie, FABP3, FABP4, FABP7), we overexpressed each of the four HA-tagged FABPs in a human malignant glioma cell line (T98) known to be negative for all four FABPs (unpublished data). Lysates from transfected cells were sequentially immunostained with anti-FABP5 and anti-HA antibodies. No cross-reactivity to other members of the FABP family was detected (Figure 3A).
Figure 3.
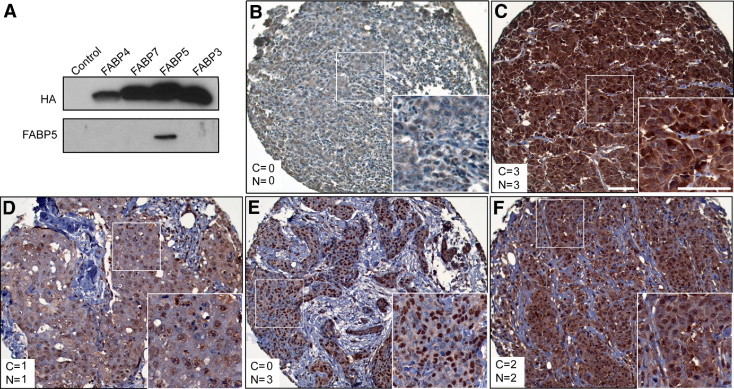
A: Western blot showing specificity of the anti-FABP5 antibody used for immunostaining. Whole cell lysates were prepared from T98 human malignant glioma cells transfected with HA-tagged FABP3, FABP4, FABP5, or FABP7 expression constructs. T98 cells transfected with an empty vector served as the negative control. B–F: FABP5 protein subcellular localization in breast cancer TMAs. The cytoplasmic (C) and nuclear (N) scores are indicated in each panel. Insets show the boxed region at higher magnification. Scale bars = 100 μm (for both main and inset images).
Next, we examined FABP5 expression in Hs578T cells (which express abundant FABP5 RNA based on RT-PCR) transfected with FABP5 siRNA. There was ∼75% reduction in FABP5 signal intensity in cells transfected with FABP5 siRNA, compared with cells transfected with a scrambled siRNA control (see Supplemental Figure S1 at http://ajp.amjpathol.org). Immunostaining of paraffin-embedded BT-20 (which expresses little or no FABP5 RNA, based on RT-PCR), Hs578T, Hs578T transfected with scrambled siRNA, and Hs578T transfected with FABP5 siRNA revealed significant reductions in signal intensity in BT-20 and Hs578T cells transfected with FABP5 siRNA, compared with Hs578T and Hs578T cells transfected with control siRNA (see Supplemental Figure S1, B–E, at http://ajp.amjpathol.org).
Immunostaining of breast cancer TMAs with anti-FABP5 antibody revealed the presence of FABP5 in both the cytoplasm and nucleus (Figure 3, B–F). Of the 109 patients with sufficient tissue for immunohistochemical analysis, 61 (56%) patients experienced early relapse and 38 (44%) were dead at the time of analysis. Correlations between cytoplasmic or nuclear FABP5 (hereafter termed FABP5c and FABP5n) protein levels and clinicopathological characteristics are shown in Table 1. FABP5c, but not FABP5n, was significantly higher in ER-negative (P = 0.0009), PR–negative (P = 0.0041), triple-negative (P = 0.0005), and high histological grade tumors (P = 0.0062). Among the determinants of overall histological grade, FABP5c levels were significantly correlated with nuclear grade (P = 0.0432) and mitotic grade (P = 0.0013), but not with architectural grade (P = 0.3446). Significantly higher death (P = 0.0135) and recurrence (P = 0.0435) frequencies were observed in patients who had tumors with elevated FABP5c. Of note, there was no significant correlation between FABP5n and any of the pathological parameters examined. When performing χ2 analysis, we separated the four FABP5 immunoreactivity scores (0, indicating negative staining; 1, weak; 2, medium; 3, strong) to test the significance of linear trends between FABP5 immunoreactivity and clinicopathological factors. The linear trends for all significant correlations reached very significant levels (Ptrend < 0.01) (Table 1).
FABP5 Is a Strong and Independent Prognostic Factor of Breast Cancer Prognosis
Kaplan-Meier overall and recurrence-free survival curves were generated based on subcellular immunoreactivity of FABP5. High levels of FABP5c (scores of 2 or 3; n = 62) were associated with significantly lower overall survival probability (P = 0.013, HR = 2.2) and marginally significantly lower recurrence-free survival (P = 0.0551, HR = 1.64), compared with low FABP5c levels (scores of 0 or 1; n = 47) (Figure 4A). FABP5n (scores of 0 and 1 vs scores of 2 and 3) was not associated with either overall (P = 0.7806, HR = 0.89) or recurrence-free survival (P = 0.8393, HR = 0.94) (Figure 4B). However, for the comparison of FABP5n scores of 3 versus 0, 1, and 2, a significant correlation was observed with low survival (P = 0.0173) but not recurrence-free survival (P = 0.0828).
Figure 4.
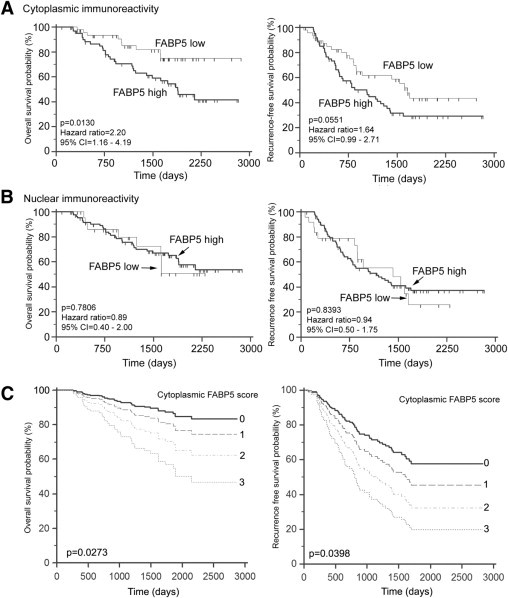
Effect of cytoplasmic FABP5 (A) and nuclear FABP5 (B) immunoreactivity on overall and recurrence-free survival. A: Cytoplasmic immunoreactivity was classified as low (score of 0 or 1; n = 47) or high (score of 2 or 3; n = 62). B: Nuclear immunoreactivity was classified as low (score of 0 or 1; n = 24) or high (score of 2 or 3; n = 85). C: Overall and recurrence-free survival curves for different cytoplasmic FABP5 immunoreactivity scores [C = 0 (n = 8); C = 1 (n = 39); C = 2 (n = 40); C = 3 (n = 22)] in multivariate Cox proportional hazards regression model at the means of all other covariates in these models.
Cox multivariate proportional-hazards regression analysis was used to test the prognostic significance of FABP5 subcellular immunoreactivity in relation to other commonly used significant prognostic factors (ER, PR, histological grade). FABP5c, but not FABP5n, retained independent prognostic significance for both overall and recurrence-free survival (Table 2). For overall survival, FABP5c (P = 0.0273, HR = 1.61) and PR (P = 0.0743, HR = 0.50) were retained in the model as significant predictor variables after backward proportional modeling. For recurrence-free survival, all four factors [including FABP5c (P = 0.0398, HR = 1.43)] acted as significant and independent covariates in the model (Table 2). The P values for the whole regression model were 0.0021 for overall survival and 0.0016 for recurrence-free survival, indicating a very strong model fit (Table 2).
Table 2.
Cox Multivariate Proportional Regression Analysis of Prognostic Markers on Overall and Recurrence-Free Survival (n = 109)
| Factors | Overall survival |
Recurrence-free survival |
||||
|---|---|---|---|---|---|---|
| HR | 95% CI | P | HR | 95% CI | P | |
| FABP5c (0/1/2/3) | 1.61 | 1.06–2.44 | 0.0273 | 1.43 | 1.02–2.02 | 0.0398 |
| ER (+/−) | NS | NS | NS | 2.42 | 1.04–5.63 | 0.0418 |
| PR (+/−) | 0.50 | 0.26–0.99 | 0.0473 | 0.33 | 0.15–0.73 | 0.0058 |
| Grade (high/low) | NS | NS | NS | 1.95 | 0.96–3.94 | 0.0660 |
| Regression model | PI = 0.47FABP5c − 0.69PR | PI = 0.36FABP5c + 0.88ER − 1.10PR + 0.67Grade | ||||
| Pmodel | 0.0021 | 0.0016 | ||||
CI, confidence interval; ER, estrogen receptor; FABP5c, cytoplasmic immunoreactivity; HR, hazard ratio; PI, prognostic index; PR, progesterone receptor.
Survival curves for all four FABP5c immunoreactivity levels (0, 1, 2, and 3) at the means of the other covariates in the model showed a consistent decrease of overall and recurrence-free survival probability with increasing FABP5c immunoreactivity (Figure 4C). These results suggest a strong and independent role for FABP5c in breast cancer prognosis.
Depletion of FABP5 in Breast Cancer Cell Lines Modulates Cell Proliferation and Responsiveness to RA
To examine a possible role for FABP5 in stimulating breast tumor cell proliferation, we first analyzed the relationship between FABP5 and the cell proliferation marker Ki-67 in 105 tumors for which we had Ki-67 immunostaining data. A steady increase in the percentage of Ki-67–positive cells was observed with increasing cytoplasmic FABP5 (P < 0.001) (Figure 5A), but not nuclear FABP5 (P = 0.12) (data not shown). To investigate the actual effect of FABP5 on cell proliferation, we used FABP5 siRNA to reduce FABP5 levels in Hs578T, a breast cancer cell line with elevated levels of FABP5 (Figure 1C; see also Supplemental Figure S1 at http://ajp.amjpathol.org). Depletion of FABP5 resulted in ∼40% reduction in cell growth (P = 0.0002) (Figure 5B), in keeping with a role for FABP5 in stimulating breast cancer cell proliferation.
Figure 5.
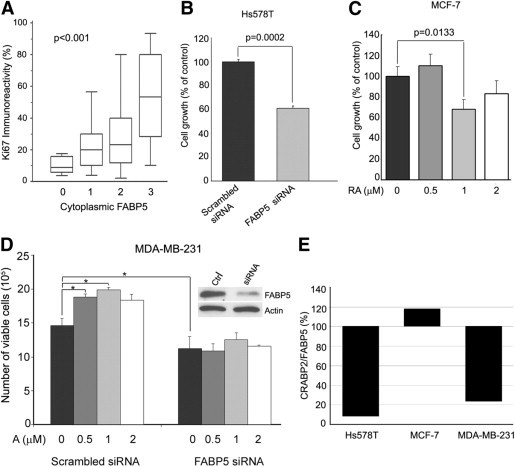
Effects of FABP5 expression on breast cancer cell proliferation and response to retinoic acid (RA). A: Ki-67 immunoreactivity (% of immunohistochemistry-positive cells) among breast tumors with different cytoplasmic FABP5 levels based on TMA scoring data (n = 105). Statistical significance (P < 0.001) was analyzed by one-way analysis of variance. B: Comparison of cell growth between Hs578T cells transfected with scrambled siRNA (control) or FABP5 siRNA. P values were obtained by t-test. C: Effect of RA on MCF-7 cell growth. MCF-7 were cultured in 0, 0.5 μmol/L, 1 μmol/L or 2 μmol/L RA for 2 days. P values were obtained by t-test. D: Effect of RA on MDA-MB-231 cell growth in cells transfected with scrambled siRNA or FABP5 siRNA; Western blots demonstrate knockdown of FABP5. *P < 0.05, t-test. E: The relative CRABP2/FABP5 ratios for the three cell lines (Hs578T, MCF-7, and MDA-MB-231) used for the in vitro analysis were obtained from the RT-PCR data shown in Figure 1C. Band intensities for FABP5 and CRABP2 were quantified by measuring the intensities of the FABP5 and CRABP2 bands relative to β-actin. Cross point was set at 100%.
Next, we addressed the possibility that relative FABP5 and CRABP2 levels might affect cellular response to RA. The MCF-7 cell line, which expresses relatively high levels of both CRABP2 and FABP5 (Figures 1C and 5E), was treated with different concentrations of RA, and cells were counted 2 days later. A significant reduction in MCF-7 cell growth was observed in the presence of 1 μmol/L RA, compared with control (P < 0.05) (Figure 5C). To more directly assess the importance of the CRABP2/FABP5 ratio in controlling cell growth in response to RA, we conducted a FABP5 knockout experiment using MDA-MB-231, a breast cancer cell line with a low CRABP2/FABP5 ratio (Figures 1C and 5E). Transfected cells (scrambled and FABP5 siRNAs) were then treated with RA. A significant increase in the growth rate of control cells was observed in the presence of RA (Figure 5D). In contrast, FABP5-depleted cells showed no response to RA, likely a reflection of the relative increase in the ratio of CRABP2 to FABP5 in these cells.
Discussion
FABP5 (also termed epidermal FABP, E-FABP, or psoriasis-associated fatty acid-binding protein, PA-FABP) was first identified in human skin cells.31 It was later found to be expressed in many other tissues, including mammary gland.32,33 The physiological function of this protein remains elusive, and evidence supporting a role for FABP5 in human cancers is limited. Up-regulation of FABP5 RNA and protein has been observed in prostate and breast cancer cell lines relative to benign cell lines.34,35 Furthermore, overexpression of FABP5 in a rat mammary epithelial cell line induces metastasis.35,36 Most notably, recent studies by Noy and colleagues11,12 have demonstrated a role for FABP5 in mediating RA action in a mouse mammary cancer model and human breast cancer cell lines by targeting PPARβ, a nuclear receptor associated with cell survival/proliferation. These investigators showed that the ratio of CRABP2 and FABP5 determines whether RA plays a role in the inhibition of cell growth through the RA-CRABP2-RAR pathway or a role in cell survival through the RA-FABP5-PPARβ pathway.12
FABP5 is up-regulated by EpCAM,37 a tumor-associated epithelial cell adhesion molecule with a negative prognostic effect in breast cancer.38,39 FABP5 is a major target of the proto-oncogene c-Myc,40 which is also rapidly up-regulated by de novo expression of EpCAM,41 and implicated in breast tumor formation and progression.42 These results suggest an EpCAM-c-Myc-FABP5 link in human breast cancers. These combined in vivo and in vitro data indicate that FABP5 expression may promote breast cancer cell survival and tumor progression.
Little is known about FABP5 abundance and distribution in human breast cancer and its clinicopathologic correlates and prognostic relevance. Taking advantage of a well-characterized cohort of breast cancer patients and using both gene profiling and TMA datasets, we found an association between FABP5 expression, ER/PR status, and clinical outcome. In support of the hypothesis that FABP5 promotes cell growth/survival based on in vitro studies and animal models,11,12 we found that elevated levels of FABP5 mRNA and cytoplasmic localization of FABP5 are strongly associated with poor prognosis and adverse clinicopathologic features in breast cancer. There was also a correlation between the highest levels of nuclear FABP5 (score of 3) and reduced survival. These results are in general agreement with previous reports suggesting that FABP5 mobilization to the nucleus is at the heart of its involvement with RA and PPARβ.11
We speculate that RA-FABP5-PPARβ is a secondary pathway modulating cell survival/proliferation, with the involvement of this pathway generally obscured by the primary tumor growth-inhibiting RA-CRABP2-RAR pathway. In agreement with this idea, the binding affinity of CRABP2 and RAR for RA is much higher (the dissociation constant Kd is in the 0.1−0.2 nmol/L range)43,44 than the binding affinity of FABP5 and PPARβ for RA (Kd in the 10 to 50 nmol/L range).45 When highly enriched in the cytoplasm, FABP5 can compete with CRABP2 for RA ligand binding, thus reducing the availability of free RA directed toward the RA-CRABP2-RAR pathway. Consequently, the tumor growth-inhibiting function of RA is restricted under these conditions and the secondary cell survival/proliferation pathway becomes more potent.
As suggested by studies conducted with animals and cell lines, the relative level of FABP5 and CRABP2 may be a critical determinant for cellular proliferation and RA responsiveness. We therefore analyzed the clinical significance of the CRABP2/FABP5 ratio in breast cancer tumor tissue based on FABP5 and CRABP2 gene expression microarray signal intensities. As predicted from previous animal and in vitro studies, patients with tumors characterized by a high CRABP2/FABP5 ratio had significantly longer overall survival (P = 0.0051) and marginally significant longer recurrence-free survival (P = 0.0677), thus providing clinical evidence for the opposing effects of these two cellular RA-binding proteins on tumor progression and prognosis (Figure 6). In further support of the opposite natures of CRABP2 and FABP5, our in vitro data indicate that the CRABP2/FABP5 ratio in breast cancer cell lines affects cellular response to RA, with an increased CRABP2/FABP5 ratio associated with decreased cell growth in the presence of RA.
Figure 6.
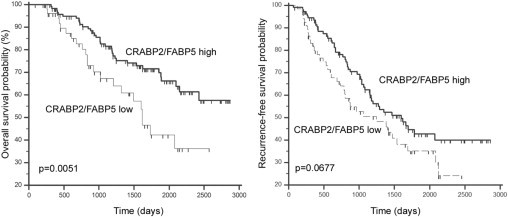
Patient survival based on CRABP2/FABP5 ratio. The ratios were obtained by dividing normalized gene expression microarray signal intensity of CRABP2 with that of FABP5. Cutoff values (0.4193 and 0.6287 for overall and recurrence-free survival, respectively) were determined by ROC analysis as described in Materials and Methods. Overall (left) and recurrence-free (right) survival curves were generated by Kaplan-Meier survival analysis.
We propose a model whereby cytoplasmic FABP5 abundance modulates the balance between the two opposing RA-related pathways (Figure 7). Because high cytoplasmic FABP5 immunoreactivity is associated with ER/PR negativity and high tumor grade, and because RA-mediated tumor growth/cell survival is generally observed in ER-negative and advanced-stage human breast cancer,13,46 we suggest that elevated levels of FABP5 in the cytoplasm acts as an inhibitor of RA activity by sequestering this molecule in the cytoplasm of ER-negative breast cancer cells. As a consequence, RA is unavailable for CRABP2-mediated activation of the growth-inhibiting nuclear receptor RAR. Drugs designed to block FABP5 in ER-negative and advanced-stage breast cancers may therefore be key to overcoming RA resistance and improving clinical outcomes in ER-negative breast cancer patients.
Figure 7.
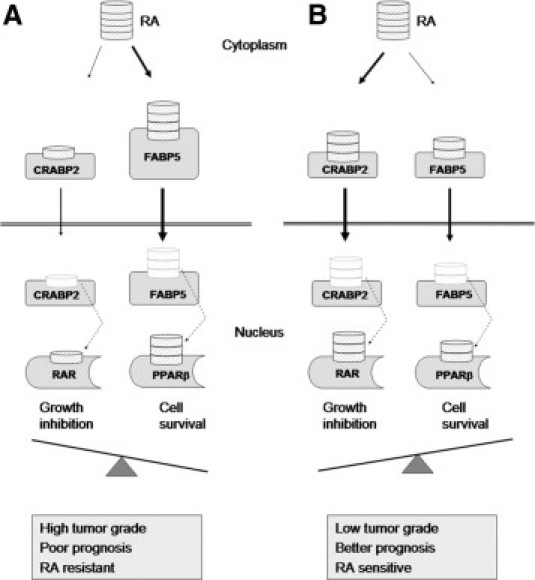
A schematic model illustrating the role of cytoplasmic FABP5 in regulating retinoic acid (RA) availability in breast cancer cells. When cytoplasmic FABP5 levels are high relative to CRABP2 (A), RA is preferentially bound to FABP5, thus increasing cell survival. When cytoplasmic FABP5 levels are low relative to CRABP2 (B), RA is preferentially bound to CRABP2, thus decreasing cell survival.
FABP5 has previously been shown to be associated with increased proliferation, tumorigenicity, and metastasis in prostate cancer, and elevated levels of FABP5 are significantly associated with a poorer prognosis in these cancers.34,36,47 Furthermore, depletion of FABP5 in a prostate cancer cell line dramatically inhibited cell proliferation and tumorigenicity in nude mice.48 Another member of the FABP family, FABP4, which is closely related to FABP5, has recently been shown to be associated with increased breast cancer risk in obese patients.22 In contrast to FABP4 and FABP5, overexpression of two other members of the FABP family, FABP3 (also known as mammary-derived growth inhibitor, MDGI) and FABP7 (also known as mammary-derived growth inhibitor-related gene, MRG) reduce breast cancer cell proliferation and tumorigenicity in nude mice.49,50 Two recent studies have demonstrated significant correlations between FABP7 immunoreactivity and absence of ER/PR expression in breast cancer.23,51 One group suggested that elevated levels of FABP7 may underlie high histological grade and poor prognosis in basal-like breast tumors,51 but the other group observed a better prognosis in FABP7-positive basal-like breast tumors.23 These data highlight the need for further studies to clarify the various roles of FABPs and their ligands in breast cancer formation and progression.
In summary, through gene profiling and TMA analysis, we have identified FABP5 as a novel and strong independent prognostic factor in human breast cancer. We have demonstrated that FABP5 is preferentially expressed in ER/PR-negative breast cancer patients with a poor prognosis, and that the prognostic value of FABP5 depends on its localization to the cytoplasm. We have provided evidence in support of a model whereby the relative ratio of FABP5 and CRABP2 in the cytoplasm determines a cancer cell's response to RA. We propose that FABP5 may serve as a novel prognostic biomarker and potential therapeutic target for ER/PR-negative and RA-resistant breast cancers.
Acknowledgments
We thank Lillian Cook, Cheryl Santos, and Ho Yin Poon for their excellent technical assistance and Adrian Driga for his help with database management.
Footnotes
Supported by grants from the Alberta Cancer Research Institute (R.G. and J.R.M.); an Alberta Heritage Foundation for Medical Research fellowship (R.-Z.L.); and Alberta Cancer Foundation studentship (D.R.G.).
Supplemental material for this article can be found at http://ajp.amjpathol.org or at doi:10.1016/j.ajpath.2010.11.075.
Supplementary data
Validation of the anti-FABP5 antibody used for immunohistochemical analysis. A: The FABP5-positive Hs578T breast cancer cell line was transfected with scrambled (control) siRNA or FABP5 siRNA. Cells were harvested 60 hours after transfection and FABP5 protein levels analyzed by Western blotting and densitometric scanning. As shown on the right, FABP5 levels were reduced by ∼75%. B and C: Hs578T cells transfected with scrambled or FABP5 siRNAs, paraffin-embedded and immunostained with anti-FABP5 antibody. The intensity of the FABP5 signal was significantly reduced in FABP5 siRNA-transfected cells. Scale bar = 100 μm (both images). D and E: Immunostaining of BT20 (low or absent FABP5 RNA) and Hs578T (high levels of FABP5 RNA) using anti-FABP5 antibody. Scale bar = 100 μm (both images).
References
- 1.Dolled-Filhart M., Rydén L., Cregger M., JirströM K., Harigopal M., Camp R.L., Rimm D.L. Classification of breast cancer using genetic algorithms and tissue microarrays. Clin Cancer Res. 2006;12:6459–6468. doi: 10.1158/1078-0432.CCR-06-1383. [DOI] [PubMed] [Google Scholar]
- 2.Liu R., Wang X., Chen G.Y., Dalerba P., Gurney A., Hoey T., Sherlock G., Lewicki J., Shedden K., Clarke M.F. The prognostic role of a gene signature from tumorigenic breast-cancer cells. N Engl J Med. 2007;356:217–226. doi: 10.1056/NEJMoa063994. [DOI] [PubMed] [Google Scholar]
- 3.Pohlmann P.R., Mayer I.A., Mernaugh R. Resistance to trastuzumab in breast cancer. Clin Cancer Res. 2009;15:7479–7491. doi: 10.1158/1078-0432.CCR-09-0636. [DOI] [PMC free article] [PubMed] [Google Scholar]
- 4.Tan A.R., Swain S.M. Therapeutic strategies for triple-negative breast cancer. Cancer J. 2008;14:343–351. doi: 10.1097/PPO.0b013e31818d839b. [DOI] [PubMed] [Google Scholar]
- 5.Bonanni B., Lazzeroni M. Retinoids and breast cancer prevention. Recent Results Cancer Res. 2009;181:77–82. doi: 10.1007/978-3-540-69297-3_9. [DOI] [PubMed] [Google Scholar]
- 6.Zanardi S., Serrano D., Argusti A., Barile M., Puntoni M., Decensi A. Clinical trials with retinoids for breast cancer chemoprevention. Endocr Relat Cancer. 2006;13:51–68. doi: 10.1677/erc.1.00938. [DOI] [PubMed] [Google Scholar]
- 7.Calviello G., Serini S., Piccioni E., Pessina G. Antineoplastic effects of n-3 polyunsaturated fatty acids in combination with drugs and radiotherapy: preventive and therapeutic strategies. Nutr Cancer. 2009;61:287–301. doi: 10.1080/01635580802582777. [DOI] [PubMed] [Google Scholar]
- 8.Shen Q., Brown P.H. Novel agents for the prevention of breast cancer: targeting transcription factors and signal transduction pathways. J Mammary Gland Biol Neoplasia. 2003;8:45–73. doi: 10.1023/a:1025783221557. [DOI] [PubMed] [Google Scholar]
- 9.Soprano K.J., Soprano D.R. Retinoic acid receptors and cancer. J Nutr. 2002;132:3809S–3813S. doi: 10.1093/jn/132.12.3809S. [DOI] [PubMed] [Google Scholar]
- 10.Garattini E., Gianni M., Terao M. Retinoids as differentiating agents in oncology: a network of interactions with intracellular pathways as the basis for rational therapeutic combinations. Curr Pharm Des. 2007;13:1375–1400. doi: 10.2174/138161207780618786. [DOI] [PubMed] [Google Scholar]
- 11.Schug T.T., Berry D.C., Shaw N.S., Travis S.N., Noy N. Opposing effects of retinoic acid on cell growth result from alternate activation of two different nuclear receptors. Cell. 2007;129:723–733. doi: 10.1016/j.cell.2007.02.050. [DOI] [PMC free article] [PubMed] [Google Scholar]
- 12.Schug T.T., Berry D.C., Toshkov I.A., Cheng L., Nikitin A.Y., Noy N. Overcoming retinoic acid-resistance of mammary carcinomas by diverting retinoic acid from PPARbeta/delta to RAR. Proc Natl Acad Sci U S A. 2008;105:7546–7551. doi: 10.1073/pnas.0709981105. [DOI] [PMC free article] [PubMed] [Google Scholar]
- 13.Cho Y., Tighe A.P., Talmage D.A. Retinoic acid induced growth arrest of human breast carcinoma cells requires protein kinase C alpha expression and activity. J Cell Physiol. 1997;172:306–313. doi: 10.1002/(SICI)1097-4652(199709)172:3<306::AID-JCP4>3.0.CO;2-S. [DOI] [PubMed] [Google Scholar]
- 14.Lotan R. Retinoids in cancer chemoprevention. FASEB J. 1996;10:1031–1039. doi: 10.1096/fasebj.10.9.8801164. [DOI] [PubMed] [Google Scholar]
- 15.Li Y., Brown P.H. Prevention of ER-negative breast cancer. Recent Results Cancer Res. 2009;181:121–134. doi: 10.1007/978-3-540-69297-3_13. [DOI] [PMC free article] [PubMed] [Google Scholar]
- 16.Conzen S.D. Minireview: nuclear receptors and breast cancer. Mol Endocrinol. 2008;22:2215–2228. doi: 10.1210/me.2007-0421. [DOI] [PMC free article] [PubMed] [Google Scholar]
- 17.Schroeder F., Petrescu A.D., Huang H., Atshaves B.P., McIntosh A.L., Martin G.G., Hostetler H.A., Vespa A., Landrock D., Landrock K.K., Payne H.R., Kier A.B. Role of fatty acid binding proteins and long chain fatty acids in modulating nuclear receptors and gene transcription. Lipids. 2008;43:1–17. doi: 10.1007/s11745-007-3111-z. [DOI] [PubMed] [Google Scholar]
- 18.Liu R.Z., Li X., Godbout R. A novel fatty acid-binding protein (FABP) gene resulting from tandem gene duplication in mammals: transcription in rat retina and testis. Genomics. 2008;92:436–445. doi: 10.1016/j.ygeno.2008.08.003. [DOI] [PubMed] [Google Scholar]
- 19.Schaap F.G., van der Vusse G.J., Glatz J.F. Evolution of the family of intracellular lipid binding proteins in vertebrates. Mol Cell Biochem. 2002;239:69–77. [PubMed] [Google Scholar]
- 20.Donato L.J., Noy N. Suppression of mammary carcinoma growth by retinoic acid: proapoptotic genes are targets for retinoic acid receptor and cellular retinoic acid-binding protein II signaling. Cancer Res. 2005;65:8193–8199. doi: 10.1158/0008-5472.CAN-05-1177. [DOI] [PubMed] [Google Scholar]
- 21.Storch J., Corsico B. The emerging functions and mechanisms of mammalian fatty acid-binding proteins. Annu Rev Nutr. 2008;28:73–95. doi: 10.1146/annurev.nutr.27.061406.093710. [DOI] [PubMed] [Google Scholar]
- 22.Hancke K., Grubeck D., Hauser N., Kreienberg R., Weiss J.M. Adipocyte fatty acid-binding protein as a novel prognostic factor in obese breast cancer patients. Breast Cancer Res Treat. 2010;119 doi: 10.1007/s10549-009-0577-9. 367-367. [DOI] [PubMed] [Google Scholar]
- 23.Zhang H., Rakha E.A., Ball G.R., Spiteri I., Aleskandarany M., Paish E.C., Powe D.G., Macmillan R.D., Caldas C., Ellis I.O., Green A.R. The proteins FABP7 and OATP2 are associated with the basal phenotype and patient outcome in human breast cancer. Breast Cancer Res Treat. 2010;121:41–51. doi: 10.1007/s10549-009-0450-x. [DOI] [PubMed] [Google Scholar]
- 24.Germain D.R., Graham K., Glubrecht D.D., Hugh J.C., Mackey J.R., Godbout R. DEAD box 1: a novel and independent prognostic marker for early recurrence in breast cancer. Breast Cancer Res Treat. 2010 doi: 10.1007/s10549-010-0943-7. [DOI] [PubMed] [Google Scholar]
- 25.Edgar R., Domrachev M., Lash A.E. Gene Expression Omnibus: NCBI gene expression and hybridization array data repository. Nucleic Acids Res. 2002;30:207–210. doi: 10.1093/nar/30.1.207. [DOI] [PMC free article] [PubMed] [Google Scholar]
- 26.Neve R.M., Chin K., Fridlyand J., Yeh J., Baehner F.L., Fevr T., Clark L., Bayani N., Coppe J.P., Tong F., Speed T., Spellman P.T., DeVries S., Lapuk A., Wang N.J., Kuo W.L., Stilwell J.L., Pinkel D., Albertson D.G., Waldman F.M., McCormick F., Dickson R.B., Johnson M.D., Lippman M., Ethier S., Gazdar A., Gray J.W. A collection of breast cancer cell lines for the study of functionally distinct cancer subtypes. Cancer Cell. 2006;10:515–527. doi: 10.1016/j.ccr.2006.10.008. [DOI] [PMC free article] [PubMed] [Google Scholar]
- 27.She Q.B., Chandarlapaty S., Ye Q., Lobo J., Haskell K.M., Leander K.R., DeFeo-Jones D., Huber H.E., Rosen N. Breast tumor cells with PI3K mutation or HER2 amplification are selectively addicted to Akt signaling. PLoS One. 2008;3:e3065. doi: 10.1371/journal.pone.0003065. [DOI] [PMC free article] [PubMed] [Google Scholar]
- 28.Richardson A.L., Wang Z.C., De Nicolo A., Lu X., Brown M., Miron A., Liao X., Iglehart J.D., Livingston D.M., Ganesan S. X chromosomal abnormalities in basal-like human breast cancer. Cancer Cell. 2006;9:121–132. doi: 10.1016/j.ccr.2006.01.013. [DOI] [PubMed] [Google Scholar]
- 29.Farmer P., Bonnefoi H., Becette V., Tubiana-Hulin M., Fumoleau P., Larsimont D., Macgrogan G., Bergh J., Cameron D., Goldstein D., Duss S., Nicoulaz A.L., Brisken C., Fiche M., Delorenzi M., Iggo R. Identification of molecular apocrine breast tumours by microarray analysis. Oncogene. 2005;24:4660–4671. doi: 10.1038/sj.onc.1208561. [DOI] [PubMed] [Google Scholar]
- 30.Györffy B., Lanczky A., Eklund A.C., Denkert C., Budczies J., Li Q., Szallasi Z. An online survival analysis tool to rapidly assess the effect of 22,277 genes on breast cancer prognosis using microarray data of 1,809 patients. Breast Cancer Res Treat. 2010;123:725–731. doi: 10.1007/s10549-009-0674-9. [DOI] [PubMed] [Google Scholar]
- 31.Madsen P., Rasmussen H.H., Leffers H., Honoré B., Celis J.E. Molecular cloning and expression of a novel keratinocyte protein (psoriasis-associated fatty acid-binding protein [PA-FABP]) that is highly up-regulated in psoriatic skin and that shares similarity to fatty acid-binding proteins. J Invest Dermatol. 1992;99:299–305. doi: 10.1111/1523-1747.ep12616641. [DOI] [PubMed] [Google Scholar]
- 32.Haunerland N.H., Spener F. Fatty acid-binding proteins—insights from genetic manipulations. Prog Lipid Res. 2004;43:328–349. doi: 10.1016/j.plipres.2004.05.001. [DOI] [PubMed] [Google Scholar]
- 33.Siegenthaler G., Hotz R., Chatellard-Gruaz D., Didierjean L., Hellman U., Saurat J.H. Purification and characterization of the human epidermal fatty acid-binding protein: localization during epidermal cell differentiation in vivo and in vitro. Biochem J. 1994;302:363–371. doi: 10.1042/bj3020363. [DOI] [PMC free article] [PubMed] [Google Scholar]
- 34.Adamson J., Morgan E.A., Beesley C., Mei Y., Foster C.S., Fujii H., Rudland P.S., Smith P.H., Ke Y. High-level expression of cutaneous fatty acid-binding protein in prostatic carcinomas and its effect on tumorigenicity. Oncogene. 2003;22:2739–2749. doi: 10.1038/sj.onc.1206341. [DOI] [PubMed] [Google Scholar]
- 35.Jing C., Beesley C., Foster C.S., Rudland P.S., Fujii H., Ono T., Chen H., Smith P.H., Ke Y. Identification of the messenger RNA for human cutaneous fatty acid-binding protein as a metastasis inducer. Cancer Res. 2000;60:2390–2398. [PubMed] [Google Scholar]
- 36.Jing C., Beesley C., Foster C.S., Chen H., Rudland P.S., West D.C., Fujii H., Smith P.H., Ke Y. Human cutaneous fatty acid-binding protein induces metastasis by up-regulating the expression of vascular endothelial growth factor gene in rat Rama 37 model cells. Cancer Res. 2001;61:4357–4364. [PubMed] [Google Scholar]
- 37.Munz M., Zeidler R., Gires O. The tumour-associated antigen EpCAM upregulates the fatty acid binding protein E-FABP. Cancer Lett. 2005;225:151–157. doi: 10.1016/j.canlet.2004.11.048. [DOI] [PubMed] [Google Scholar]
- 38.Gastl G., Spizzo G., Obrist P., Dunser M., Mikuz G. Ep-CAM overexpression in breast cancer as a predictor of survival. Lancet. 2000;356:1981–1982. doi: 10.1016/S0140-6736(00)03312-2. [DOI] [PubMed] [Google Scholar]
- 39.Spizzo G., Went P., Dirnhofer S., Obrist P., Simon R., Spichtin H., Maurer R., Metzger U., von Castelberg B., Bart R., Stopatschinskaya S., Köchli O.R., Haas P., Mross F., Zuber M., Dietrich H., Bischoff S., Mirlacher M., Sauter G., Gastl G. High Ep-CAM expression is associated with poor prognosis in node-positive breast cancer. Breast Cancer Res Treat. 2004;86:207–213. doi: 10.1023/B:BREA.0000036787.59816.01. [DOI] [PubMed] [Google Scholar]
- 40.Coller H.A., Grandori C., Tamayo P., Colbert T., Lander E.S., Eisenman R.N., Golub T.R. Expression analysis with oligonucleotide microarrays reveals that MYC regulates genes involved in growth, cell cycle, signaling, and adhesion. Proc Natl Acad Sci U S A. 2000;97:3260–3265. doi: 10.1073/pnas.97.7.3260. [DOI] [PMC free article] [PubMed] [Google Scholar]
- 41.Münz M., Kieu C., Mack B., Schmitt B., Zeidler R., Gires O. The carcinoma-associated antigen EpCAM upregulates c-myc and induces cell proliferation. Oncogene. 2004;23:5748–5758. doi: 10.1038/sj.onc.1207610. [DOI] [PubMed] [Google Scholar]
- 42.Liao D.J., Dickson R.B. c-Myc in breast cancer. Endocr Relat Cancer. 2000;7:143–164. doi: 10.1677/erc.0.0070143. [DOI] [PubMed] [Google Scholar]
- 43.Dong D., Ruuska S.E., Levinthal D.J., Noy N. Distinct roles for cellular retinoic acid-binding proteins I and II in regulating signaling by retinoic acid. J Biol Chem. 1999;274:23695–23698. doi: 10.1074/jbc.274.34.23695. [DOI] [PubMed] [Google Scholar]
- 44.Sussman F., de Lera A.R. Ligand recognition by RAR and RXR receptors: binding and selectivity. J Med Chem. 2005;48:6212–6219. doi: 10.1021/jm050285w. [DOI] [PubMed] [Google Scholar]
- 45.Tan N.S., Shaw N.S., Vinckenbosch N., Liu P., Yasmin R., Desvergne B., Wahli W., Noy N. Selective cooperation between fatty acid binding proteins and peroxisome proliferator-activated receptors in regulating transcription [Erratum appeared in Mol Cell Biol 2002;22:6318] Mol Cell Biol. 2002;22:5114–5127. doi: 10.1128/MCB.22.14.5114-5127.2002. [DOI] [PMC free article] [PubMed] [Google Scholar]
- 46.Ahn E.H., Chang C.C., Talmage D.A. Loss of anti-proliferative effect of all-trans retinoic acid in advanced stage of breast carcinogenesis. Anticancer Res. 2009;29:2899–2904. [PubMed] [Google Scholar]
- 47.Morgan E.A., Forootan S.S., Adamson J., Foster C.S., Fujii H., Igarashi M., Beesley C., Smith P.H., Ke Y. Expression of cutaneous fatty acid-binding protein (C-FABP) in prostate cancer: potential prognostic marker and target for tumourigenicity-suppression. Int J Oncol. 2008;32:767–775. [PubMed] [Google Scholar]
- 48.Forootan S.S., Bao Z.Z., Forootan F.S., Kamalian L., Zhang Y., Bee A., Foster C.S., Ke Y. Atelocollagen-delivered siRNA targeting the FABP5 gene as an experimental therapy for prostate cancer in mouse xenografts. Int J Oncol. 2010;36:69–76. [PubMed] [Google Scholar]
- 49.Huynh H.T., Larsson C., Narod S., Pollak M. Tumor suppressor activity of the gene encoding mammary-derived growth inhibitor. Cancer Res. 1995;55:2225–2231. [PubMed] [Google Scholar]
- 50.Shi Y.E., Ni J., Xiao G., Liu Y.E., Fuchs A., Yu G., Su J., Cosgrove J.M., Xing L., Zhang M., Li J., Aggarwal B.B., Meager A., Gentz R. Antitumor activity of the novel human breast cancer growth inhibitor, mammary-derived growth inhibitor-related gene, MRG. Cancer Res. 1997;57:3084–3091. [PubMed] [Google Scholar]
- 51.Tang X.Y., Umemura S., Tsukamoto H., Kumaki N., Tokuda Y., Osamura R.Y. Overexpression of fatty acid binding protein-7 correlates with basal-like subtype of breast cancer. Pathol Res Pract. 2010;206:98–101. doi: 10.1016/j.prp.2009.06.010. [DOI] [PubMed] [Google Scholar]
Associated Data
This section collects any data citations, data availability statements, or supplementary materials included in this article.
Supplementary Materials
Validation of the anti-FABP5 antibody used for immunohistochemical analysis. A: The FABP5-positive Hs578T breast cancer cell line was transfected with scrambled (control) siRNA or FABP5 siRNA. Cells were harvested 60 hours after transfection and FABP5 protein levels analyzed by Western blotting and densitometric scanning. As shown on the right, FABP5 levels were reduced by ∼75%. B and C: Hs578T cells transfected with scrambled or FABP5 siRNAs, paraffin-embedded and immunostained with anti-FABP5 antibody. The intensity of the FABP5 signal was significantly reduced in FABP5 siRNA-transfected cells. Scale bar = 100 μm (both images). D and E: Immunostaining of BT20 (low or absent FABP5 RNA) and Hs578T (high levels of FABP5 RNA) using anti-FABP5 antibody. Scale bar = 100 μm (both images).