

Abstract
Injection of aristolochic acid (AA) in mice causes AA-induced nephrotoxicity, in which oxidative stress contributes to development of tubulointerstitial damage (TID). Liver-type fatty acid binding protein (L-FABP) is expressed in human proximal tubules and has an endogenous antioxidative function. The renoprotection of renal L-FABP was examined in a model of AA-induced nephrotoxicity. Established human L-FABP (hL-FABP) transgenic (Tg) mice and wild-type (WT) mice were treated with AA for up to 5 days. Mice were sacrificed on days 1, 3, and 5 after the start of AA injection. Although mouse L-FABP was not expressed in proximal tubules of WT mice, hL-FABP was expressed in proximal tubules of Tg mice. The expression of renal hL-FABP was significantly increased in Tg mice administered AA (Tg-AA), compared with the control (saline-treated Tg mice). In WT-AA mice, there was high urinary excretion of Nε-(hexanoyl)-lysine, the production of heme oxygenase-1 and receptor for advanced glycation end products increased, and TID was provoked. In contrast, renal hL-FABP in Tg-AA mice suppressed production of Nε-(hexanoyl)lysine, heme oxygenase-1, and receptor for advanced glycation end products. Renal dysfunction was significantly milder in Tg-AA mice than in WT-AA mice. The degree of TID was significantly attenuated in Tg-AA mice, compared with WT-AA. In conclusion, renal hL-FABP reduced the oxidative stress in AA-induced nephrotoxicity and attenuated TID.
Acute kidney injury is a common complication of critically ill patients and is associated with increased morbidity and mortality.1 In patients with acute kidney injury but without a history of glomerulonephritis, acute tubulointerstitial necrosis is a key event leading to renal failure. Thus, inhibition of the progression of tubulointerstitial damage (TID) could lead to a reduction in progressive loss of kidney function.
Liver-type fatty acid binding protein (L-FABP) is found in the cytoplasm of human proximal tubular cells.2 L-FABP binds fatty acids and transports them to mitochondria or peroxisomes, where the fatty acids are β-oxidized, and participates in intracellular fatty acid homeostasis.3,4 Moreover, L-FABP has a high affinity for and capacity to bind long-chain fatty acid oxidation products and thus may be an effective endogenous antioxidant.5,6
Renal L-FABP is not expressed in the mouse kidney. To elucidate the pathophysiological role of L-FABP in renal disease, we had previously established human L-FABP (hL-FABP) chromosomal transgenic (Tg) mice and reported the pathological significance of hL-FABP in experimental models of protein overload,7 unilateral ureteral obstruction,8 and streptozotocin-induced diabetes,9 all of which are known models of chronic kidney disease. Under experimentally induced pathological conditions, the expression of renal hL-FABP was up-regulated and the TID in Tg mice was attenuated, compared with wild-type (WT) mice. With regard to experimental models of acute kidney injury, the expression of renal hL-FABP protected kidney tissue from renal ischemia, reperfusion after ischemia,10 and intoxication with cisplatin.11 The antioxidative ability of hL-FABP is thought to attenuate kidney injury in various experimental models; however, the pathophysiological significance of hL-FABP remains to be determined in acute toxic injury, such as aristolochic acid (AA)-induced nephrotoxicity.
Aristolochic acid is a carcinogenic plant alkaloid present in various Aristolochia species. It is nephrotoxic and plays a central role in the pathogenesis of AA-induced nephrotoxicity.12 Aristolochic acid has been found in slimming pills and in a medication containing a Chinese herb such as Aristolochia fangchi that is used to treat infertility, hyperuricemia, pain relief, rheumatism, or atopic dermatitis.12 The pathology of AA-induced nephrotoxicity involves acute tubular necrosis (ATN), which leads to acute kidney injury, and extensive interstitial fibrosis.13 Recently, it was demonstrated that the pathogenesis of AA-induced nephrotoxicity is associated with oxidative stress produced by direct exposure of the proximal tubules to AA14 or by tubular hypoxia derived from microcirculation injury.15–18 hL-FABP may have an antioxidative function and thus ameliorate kidney injury in AA-induced nephrotoxicity. In the present study, the renoprotective function of renal hL-FABP in AA-induced acute kidney injury mice was investigated.
Materials and Methods
Animals
Studies were conducted in accordance with the St. Marianna University School of Medicine Institutional Guide for Animal Experiments.
Because renal L-FABP is not expressed in the mouse kidney, hL-FABP Tg mice were generated as described previously (World Intellectual Property Organization patent no. WO0073791).7 Mice were housed in the animal facilities of St. Marianna University School of Medicine with free access to food and water.
The animals used were 8-week-old female hL-FABP Tg mice (n = 42; body weight = 21.1 ± 0.3 g) on a BALB/c background and 8-week-old female WT mice (n = 53; body weight = 20.6 ± 0.2 g) that were littermates with exactly the same genetic background as the Tg mice. The mice were divided into two groups, AA and control. The AA group (Tg-AA, n = 25, body weight = 21.5 ± 0.3 g; WT-AA, n = 31, body weight = 20.8 ± 0.2 g) received intraperitoneal injection of AA1 (Sigma-Aldrich, St. Louis, MO) at a dose of 5 mg/kg per dayin saline for up to 5 days. The control group (Tg-control, n = 17, body weight = 21.0 ± 0.4 g; WT-control, n = 22, body weight = 20.4 ± 0.3 g) received only saline, in the same fluid volume of AA-solvating medium, at a dose of 20 ml/kg. The dose of AA1 had been determined in prior studies to be critical for induction of severe TID (unpublished data).
For urine collection on days 0, 1, 3, and 5, all mice were housed overnight individually in metabolic cages with free access to tap water and food.7 Sediment was removed from the urine samples by centrifugation (15,000 rpmat 4°C for 3 minutes).
The mice in the AA group were sacrificed on day 1, 3, or 5 after the start of AA1 administration. The mice in the control group were sacrificed on the same day as the AA group. In brief, under intraperitoneal anesthesia, blood was drawn from the inferior vena cava. The left kidney was then removed, fixed in 10% buffered formalin (Wako Pure Chemical Industries, Osaka, Japan), and stained with methyl Carnoy's solution.The right kidney was removed and snap-frozen in liquid nitrogen for analysis of protein and for gene expression assay.
Serum Biochemistry
Serum was isolated from blood by centrifugation (15,000 rpmat 4°C for 10 minutes). Serum creatinine was measured by the enzymic method (Nescoat VLII CRE, Alfresa Pharma, Osaka, Japan). Serum glutamic oxaloacetic transaminase was measured by the enzymic method (transaminase CII test, Wako Pure Chemical Industries).
Urinary Biochemistry
Urine parameters are reported as the ratio to urinary creatinine (Cre). Urinary creatinine was measured by the Jaffé method (The Creatinine Companion, Exocell, Philadelphia, PA). Urinary N-acetyl-β-d-glucosaminidase (NAG) was quantified by using a commercially available chemical reagent (NAGtest, Shionogi, Osaka, Japan). Albuminuria was determined using the Albuwell assay (Exocell). Urinary hL-FABP was measured by a two-step sandwich enzyme-linked immunosorbent assay (ELISA) procedure (human L-FABP ELISA kit, CMIC, Tokyo, Japan).19
We examined the urinary levels of the oxidative stress marker Nε-(hexanoyl)lysine (HEL), using a HEL ELISA kit (Japan International Cooperation Agency–JICA, Shizuoka, Japan).
Renal Histological and Morphometric Analysis
For light microscopic analysis, the kidney was dehydrated and embedded in paraffin. Serial sections (2 μm thick) were obtained for conventional histological assessment, such as periodic acid-Schiff (PAS) staining and Azan–Mallory staining, and for immunohistochemistry. The PAS-stained tissue sections were used to evaluate acute tubulointerstitial injury using the ATN score.20 This score quantifies the percentage of tubules that display cell necrosis, loss of brush border, cast formation, or tubule dilatation on the following scale: 0 = none; 1 = <10%; 2 = 11% to 25%; 3 = 26% to 45%; 4 = 46% to 75%; and 5 = >76%. Azan–Mallory-stained tissue sections were used to evaluate tubulointerstitial fibrosis, which was defined as accumulation of extracellular matrix (staining blue) and tubular atrophy. Under magnification (×200), 10 nonoverlapping fields from the cortical region were selected, and the area of tubulointerstitial injury or fibrosis and the whole cortical area were measured with an image analyzer version 6.1 (WinRoof,Mitani Co., Tokyo, Japan). The degree of tubulointerstitial injury and of fibrosis was evaluated as the ratio to the entire cortical area.7,21 These histological evaluations were performed in a blinded manner by K.M.
Immunohistological Analysis
Tissues fixed in methyl Carnoy's solution were embedded in paraffin. An indirect immunoperoxidase method was used to identify the antigens, as described previously.8,9 Macrophages were identified with rat monoclonal antibody F4/80 (BMA Biomedicals, Augst, Switzerland), and type I collagen was identified with a rabbit polyclonal antibody (Cedarlane Laboratories, Burlington, ON, Canada). The degree of macrophage infiltration in the cortical interstitium was expressed as the ratio of the positive area of F4/80 to the entire cortical area under ×200 magnification, measured with an image analyzer (WinRoof). Similarly, the positive area of type I collagen was expressed as the ratio of the positive area of type I collagen to the entire cortical area.
Tissues were fixed in 10% buffered formalin and embedded in paraffin. After deparaffinization of sections, we performed double immunohistochemistry with monoclonal antibody against hL-FABP (CMIC, Tokyo, Japan) for evaluation of its expression in the Tg mice kidney and rabbit polyclonal antibody against aquaporin-1 (AQP-1) (Millipore, Temecula, CA) as a marker of the proximal tubule, as described previously.21 The expression of hL-FABP and AQP-1 was quantified with an image analyzer (WinRoof).
Measurement of Monocyte Chemoattractant Protein-1 and hL-FABP by ELISA
Frozen kidneys were homogenized in lysis buffer (0.1 mol/L phosphate buffer, 1 μg/ml leupeptin, 1% Triton X-100, and 0.05 mmol/L phenylmethyl sulfonyl fluoride) at 4°C. After centrifugation at 15,000 rpm at 4°C for 30 minutes, supernatants were collected and protein concentrations were measured by the Bradford method (Bio-Rad protein assay, Bio-Rad Laboratories, Hercules, CA). To determine the quantity of monocyte chemoattractant protein-1 (MCP-1) and hL-FABP proteins in the kidney, the proteins that had been extracted by the Bradford method were subjected to ELISA for MCP-1 (R&D Systems, Minneapolis, MN) and for hL-FABP (CMIC Co., Ltd). The concentrations of MCP-1 and hL-FABP were corrected for total protein concentration.
Real-Time Quantitative PCR Analysis
Total RNA was extracted from the kidney using an RNeasy mini kit (Qiagen, Valencia, CA) according to the manufacturer's instructions. Total RNA (0.5 μg) was reverse-transcribed using an ExScript RT reagent kit (Takara Bio, Shiga, Japan). The TaqMan real-time PCR reaction was performed on a TaqMan ABI PRISM 7000 sequence detection system (Applied Biosystems, Foster City, CA) using a TaqMan universal PCR master mix (Applied Biosystems). The mRNAs of hL-FABP, MCP-1, transforming growth factor-β (TGF-β), α-1 type I collagen (COL1A1), hypoxia inducible factor-1α (HIF-1α), heme oxygenase-1 (HO-1), receptor for advanced glycation end products (RAGE), and glyceraldehyde-3-phosphate dehydrogenase (GAPDH) were detected using TaqMan real-time PCR. Unlabeled specific primers and the TaqMan MGB probes (6-FAM dye-labeled) were purchased from Applied Biosystems. Expression of hL-FABP, MCP-1, TGF-β, COL1A1, HO-1, RAGE, and HIF-1α mRNAs in each sample was evaluated, normalized with GAPDH expression.
Statistical Analysis
All values were expressed as means ± SE. Statistical significance was set at P < 0.05. To compare parameters of the two groups, the Mann–Whitney U-test using unpaired data was used. The correlation between urinary hL-FABP and histological change was analyzed by Spearman's rank coefficient of correlation. These statistical analyses were done using StatView 5.0 software (SAS Institute, Cary, NC) and StatFlex 6.0 software (Artech, Osaka, Japan).
Results
Serum Biochemistry
In Tg-AA and WT-AA mice on day 5, the serum creatinine level was significantly higher than in the same group on day 1 (P = 0.03 and P = 0.001, respectively), and was also significantly higher than in Tg-control and WT-control mice on day 5 (Table 1). The serum creatinine level was significantly lower in Tg-AA mice than in WT-AA mice on day 5 (P = 0.0003) (Table 1).
Table 1.
Body Weight and Serum and Urinary Biochemistry Findings in hL-FABP Transgenic and Wild-Type Mice
| Day | Control |
Aristolochic acid |
||
|---|---|---|---|---|
| Transgenic | Wild type | Transgenic | Wild type | |
| Body weight (g) | ||||
| 0 | 21.0 ± 0.4 | 20.4 ± 0.3 | 21.5 ± 0.3 | 20.8 ± 0.3 |
| 1 | 21.2 ± 0.2 | 21.1 ± 0.3 | 21.6 ± 0.5 | 20.3 ± 0.3 |
| 3 | 21.3 ± 0.5 | 20.2 ± 0.6 | 20.7 ± 0.3⁎ | 19.4 ± 0.4† |
| 5 | 21.3 ± 0.4 | 20.7 ± 0.6 | 21.0 ± 0.4⁎ | 19.4 ± 0.4† |
| Serum creatinine (mg/dL) | ||||
| 0 | — | — | — | — |
| 1 | 0.135 ± 0.021 | 0.157 ± 0.014 | 0.174 ± 0.109 | 0.168 ± 0.023 |
| 3 | 0.111 ± 0.014 | 0.147 ± 0.019 | 0.191 ± 0.048 | 0.248 ± 0.069 |
| 5 | 0.157 ± 0.027 | 0.155 ± 0.038 | 0.46 ± 0.068⁎†‡ | 1.067 ± 0.135‡† |
| Urinary N-acetyl-β-d-glucosaminidase (U/g creatinine) | ||||
| 0 | 4.6 ± 0.4 | 4.6 ± 0.2 | 4.6 ± 0.4 | 4.6 ± 0.2 |
| 1 | 4.4 ± 0.7 | 4.8 ± 0.4 | 5.2 ± 0.4 | 5.7 ± 0.4§ |
| 3 | 4.4 ± 0.5 | 4.8 ± 0.4 | 6.1 ± 0.9‡§ | 7.2 ± 0.9‡§ |
| 5 | 4.8 ± 0.8 | 4.8 ± 0.6 | 10.5 ± 1.0‡§ | 17.0 ± 1.6‡§ |
| Urinary albumin (mg/g creatinine) | ||||
| 0 | 1.1 ± 0.2 | 1.0 ± 0.2 | 1.3 ± 0.2 | 1.0 ± 0.1 |
| 1 | 1.0 ± 0.2 | 0.9 ± 0.2 | 1.2 ± 0.1 | 1.4 ± 0.3 |
| 3 | 0.9 ± 0.2 | 1.0 ± 0.3 | 12.9 ± 1.6⁎‡§ | 70.0 ± 12.7‡§ |
| 5 | 0.7 ± 0.2 | 1.0 ± 0.2 | 251.8 ± 25.8‡§ | 305.5 ± 23.2‡§ |
| Serum glutamic oxaloacetic transaminase (IU/L) | ||||
| 0 | — | — | — | — |
| 1 | 15.3 ± 1.0 | 13.5 ± 0.7 | 13.8 ± 0.7 | 14.9 ± 0.6 |
| 3 | 13.8 ± 0.9 | 14.5 ± 1.4 | 15.1 ± 0.7 | 13.3 ± 1.4 |
| 5 | 13.1 ± 1.8 | 12.0 ± 0.9 | 16.6 ± 1.4⁎ | 36.1 ± 2.9†‡ |
Data are expressed as means ± SE.
P < 0.05, compared with the WT group of the same day.
P < 0.05, compared with day 1 of the same group.
P < 0.05, compared with the control group of the same day.
P < 0.05, compared with day 0 of the same group.
In WT-AA mice on day 5, the serum glutamic oxaloacetic transaminase level was significantly higher than in the same group on days 1 and 3 (P = 0.001 and P = 0.001, respectively), and was also significantly higher than in Tg-AA mice on day 5 (P < 0.0001) (Table 1).
Urinary Biochemistry
The urinary NAG level in Tg-AA mice on days 3 and 5 and in WT-AA mice on days 1, 3, and 5 was significantly higher than in the same group on day 0 (Tg day 3, P = 0.006; Tg day 5, P < 0.0001; WT day 1, P = 0.005; WT day 3, P = 0.01; WT day 5, P < 0.0001) (Table 1). In both Tg-AA and WT-AA mice on days 3 and 5, the urinary NAG level was significantly higher than in the matching control group on the same day (Tg day 3, P = 0.01; Tg day 5, P < 0.0001; WT day 3, P = 0.01; WT day 5, P < 0.0001) (Table 1). The urinary NAG level in Tg-AA mice was significantly lower than in WT-AA mice on day 5 (P = 0.001) (Table 1). There were no differences in urinary NAG level between the Tg-control and WT-control groups on any day.
The urinary albumin level did not differ significantly between the Tg-AA and WT-AA mice on day 0 (P = 0.128). In both Tg-AA and WT-AA mice on days 3 and 5, the urinary albumin level was significantly higher than in the same group on day 0 (Tg day 3, P = 0.0003; Tg day 5, P < 0.0001; WT day 3, P < 0.0001; WT day 5, P < 0.0001) and was also significantly higher than in the Tg-control and WT-control mice on the same day (Tg day 3, P = 0.0003; Tg day 5, P < 0.0001; WT day 3, P < 0.0001; WT day 5, P < 0.0001) (Table 1). The urinary albumin level in Tg-AA mice was significantly lower than in WT-AA mice on day 3 (P = 0.0003) (Table 1). On day 5, the urinary albumin level in Tg-AA mice tended to be lower than in WT-AA mice, although the difference was not significant (P = 0.18).
Dynamics of hL-FABP Expression in the Kidney
The gene expression level of renal hL-FABP (Figure 1A) in Tg-AA mice on days 1, 3, and 5 was significantly higher than in Tg-control mice on the same day (day 1, 0.44 ± 0.04 vs 0.21 ± 0.02, P = 0.006; day 3, 0.78 ± 0.10 vs 0.16 ± 0.008, P = 0.003; day 5, 1.00 ± 0.08 vs 0.18 ± 0.04, P = 0.002; values in arbitrary units). In Tg-AA mice, the gene expression level of hL-FABP on days 3 and 5 was significantly higher than on day 1 (P = 0.004 and P = 0.001, respectively).
Figure 1.
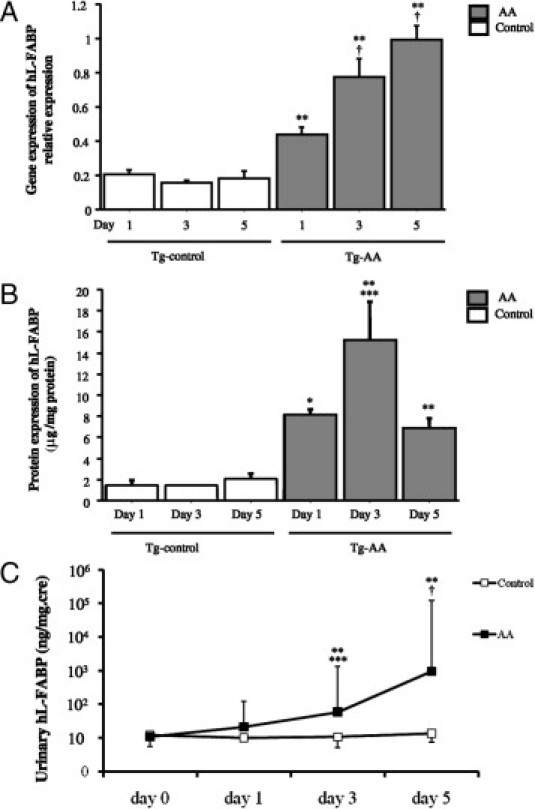
Dynamics of hL-FABP in the kidney in transgenic (Tg) control and aristolochic acid (AA)-treated mice. A: Expression of hL-FABP mRNA transcripts was determined by TaqMan real-time PCR, normalized to that of GAPDH mRNA transcripts in the same sample. *P < 0.05 and **P < 0.01, compared with the control group on the same day; ***P < 0.05 and †P < 0.005, compared with the same group on day 1. B: The expression of hL-FABP protein was determined by ELISA and corrected for the total amount of protein. *P < 0.05, **P < 0.01, compared with the control group on the same day; ***P < 0.05, †P < 0.005, compared with the same group on day 1. C: The course of urinary hL-FABP levels in the hL-FABP Tg mice (AA). **P < 0.01, compared with the control group on the same day; ***P < 0.05 and †P < 0.005, compared with the same group on day 0.
The protein expression level of renal hL-FABP (Figure 1B) in Tg-AA mice on days 1, 3, and 5 was significantly higher than in Tg-control mice on the same day (day 1, 8.2 ± 0.5 vs 1.5 ± 0.3 μg/mg protein, P = 0.01; day 3, 15.2 ± 3.6 vs 1.4 ± 0.05 μg/mg protein, P = 0.004; day 5, 6.9 ± 0.9 vs 2.1 ± 0.4 μg/mg protein, P = 0.003). In Tg-AA mice, the protein expression level of hL-FABP on day 3 was significantly higher than on day 1 (P = 0.01). On day 5, the protein expression level of renal hL-FABP in Tg-AA mice decreased to the same level as on day 1.
The urinary hL-FABP level (Figure 1C) in Tg-AA mice on day 0 did not differ from the matching control group on the same day. On day 1, the urinary hL-FABP level in Tg-AA mice tended to increase, but there was no significant difference in comparison with Tg-control mice on the same day (21.1 ± 5.9 ng/mg Cre vs 10.1 ± 1.2 ng/mg Cre; P = 0.27). The urinary hL-FABP level was significantly higher in Tg-AA mice than in Tg-control mice on days 3 and 5 (day 3, 58.9 ± 22.3 ng/mg Cre vs 10.7 ± 2.1 ng/mg Cre, P = 0.0006; day 5, 957.6 ± 127.4 ng/mg Cre vs 13.7 ± 1.8 ng/mg Cre, P < 0.0001). Moreover, in the Tg-AA group, the urinary hL-FABP levels on days 3 and 5 were significantly higher than on day 0 (P = 0.008 and P < 0.0001, respectively).
Double Immunohistochemical Staining of hL-FABP and AQP-1
To investigate the localization of expression of hL-FABP, double immunohistochemical staining was performed with monoclonal antibody against hL-FABP and rabbit polyclonal antibody against AQP-1, a marker of the proximal tubule (Figure 2). In Tg-control mice, many double-positive tubules (hL-FABP+/AQP-1+) were observed in the cortical area; in Tg-AA mice on days 1, 3, and 5, double-positive tubules were found not only in the cortex but also in the medulla. Moreover, the double-positive tubular staining of hL-FABP and AQP-1 was most intense in both cortical and medullar lesions on day 3, with decreased expression in both lesions on day 5.
Figure 2.
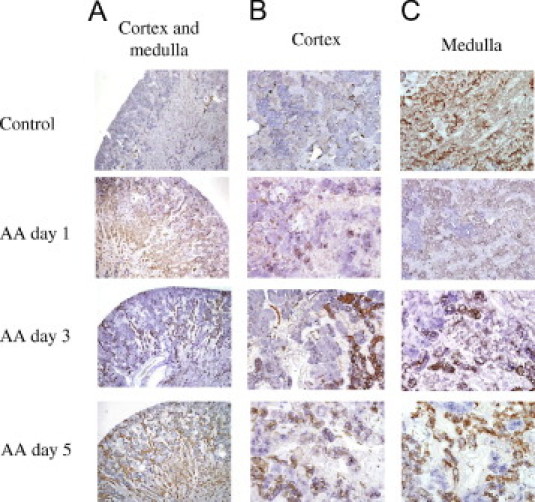
Double immunohistochemical staining of hL-FABP (purple) and aquaporin-1 (brown) in the kidney cortex and medulla (A), cortex (B), and medulla (C) of Tg-control mice on day 5 and Tg-AA mice on days 1, 3, and 5. Original magnification: ×40 (A); ×200 (B and C).
Renal Histological and Morphometric Analysis
Photomicrographs (Figure 3, A and B) were consistent with the results of morphometric analyses (Figure 3, C and D).
Figure 3.
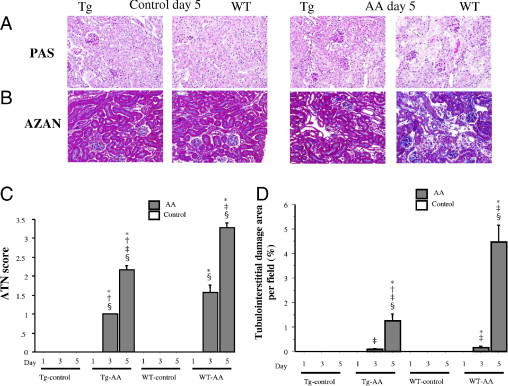
Histological findings of PAS (A) and Azan–Mallory (B) staining in the cortex of Tg and wild-type (WT) control and AA-treated mice on day 5. Original magnification, ×200. On days 1, 3, and 5 in both groups, these areas were also assessed quantitatively (C and D), as described under Materials and Methods. Data are reported as means ± SE. *P < 0.05, compared with the control group on the same day; †P < 0.05, compared with the WT group on the same day; ‡P < 0.05, compared with the same group on day 1; §P < 0.05, compared with the same group on day 3.
In both the Tg-AA and WT-AA mice, PAS-stained sections revealed ATN, including dilatation of tubules and degeneration and exfoliation of proximal tubular epithelial cells on days 3 (data not shown) and 5 (Figure 3, A and B), and Azan–Mallory-stained sections revealed tubulointerstitial fibrosis (blue staining).
The ATN scores of the PAS-stained sections of both Tg-AA and WT-AA mice on days 3 and 5 were significantly higher than in the matching control group on the same day (Tg day 3, P = 0.0005; Tg day 5, P = 0.0003; WT day 3, P < 0.0001; WT day 5, P = 0.0004). The ATN score in Tg-AA mice was significantly lower than in WT-AA mice on days 3 and 5 (day 3, P = 0.02; day 5, P < 0.0001) (Figure 3C).
The levels of tubulointerstitial fibrosis in Azan–Mallory-stained sections of the kidney in Tg-AA mice on day 5 and in WT-AA mice on days 3 and 5 were significantly higher than in the matching control group on the same day (Tg day 5, P = 0.006; WT-AA day 3, P = 0.004; WT day 5, P = 0.001). In Tg-AA mice on day 5, the degree of tubulointerstitial fibrosis was significantly lower than in WT-AA mice on the same day (1.26 ± 0.28 vs 4.45 ± 0.70, P = 0.002) (Figure 3, B and D).
Immunohistological Analysis
Deposition of type I collagen (Figure 4, A and C) on the kidney of both Tg-AA and WT-AA mice on days 3 and 5 was significantly higher than in the matching control group on the same day (Tg day 3, P = 0.01; Tg day 5, P = 0.005; WT day 3, P = 0.0002; WT day 5, P = 0.003). Deposition of type I collagen in Tg-AA mice on day 5 was significantly lower than in WT-AA mice on the same day (2.62 ± 0.15% vs 5.00 ± 0.31%; P = 0.001).
Figure 4.
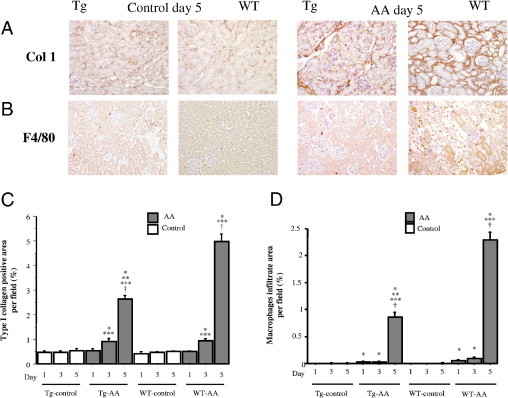
Immunohistological staining using the antibody to type I collagen (A) and antibody to F4/80 (B) in the cortex of Tg and WT control and AA-treated mice on day 5. Original magnification, × 200. On days 1, 3, and 5 in both groups, these areas were also assessed quantitatively (C and D), as described under Materials and Methods. Data are reported as means ± SE. *P < 0.05, compared with the control group on the same day; **P < 0.05, compared with the WT group on the same day; ***P < 0.05, compared with the same group on day 1; †P < 0.05, compared with the same group on day 3.
Infiltration of macrophages (Figure 4, B and D) in Tg-AA mice on days 1, 3, and 5 and in WT-AA mice on days 1, 3, and 5 was significantly greater than in the matching control group on the same day (Tg day 1, P = 0.02; Tg day 3, P = 0.03; Tg day 5, P = 0.002; WT day 1, P = 0.005; WT day 3, P = 0.005; WT day 5, P = 0.001). The infiltration of macrophages was significantly inhibited in Tg-AA mice on day 5, compared with WT-AA mice on the same day (0.86 ± 0.09% vs 2.29 ± 0.15%; P < 0.0001).
Expression of MCP-1 in the Kidney
The gene expression level of MCP-1 in the kidneys of Tg-AA mice on days 1, 3, and 5 and of WT-AA mice on days 3 and 5 was significantly higher than in the matching control group on the same day (Tg day 1, P = 0.04; Tg day 3, P = 0.01; Tg day 5, P = 0.002; WT day 3, P = 0.0007; WT day 5, P = 0.001) (Figure 5A). The gene expression level of MCP-1 in Tg-AA mice on days 3 and 5 was significantly lower than in WT-AA mice on the same day (day 3, 0.067 ± 0.013 vs 0.307 ± 0.05, P = 0.003; day 5, 0.987 ± 0.113 vs 4.103 ± 0.274, P = 0.0001; values in arbitrary units) (Figure 5A).
Figure 5.
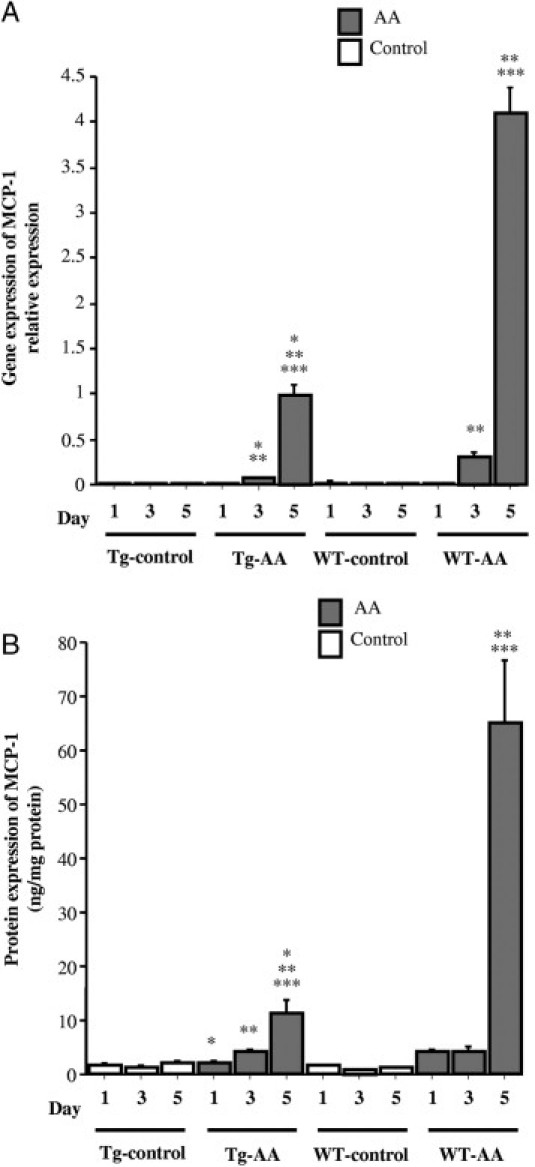
Expression of MCP-1 in the kidney of Tg and WT control and AA-treated mice. A: Expression of MCP-1 mRNA transcripts was determined by TaqMan real-time PCR, normalized to that of GAPDH mRNA transcripts in the same sample. B: The expression of MCP-1 protein was determined by ELISA and corrected for the total amount of protein. Data are reported as means ± SE. *P < 0.05, compared with the WT group on the same day; **P < 0.05, compared with the same group on day 1; ***P < 0.05, compared with the same group on day 3.
In Tg-AA mice on days 3 and 5, the protein expression level of MCP-1 was significantly higher than in Tg-control mice on the same day (day 3, 4.00 ± 0.78 vs 1.42 ± 0.22 ng/mg protein, P = 0.003; day 5, 11.24 ± 2.34 vs 1.93 ± 0.53 ng/mg protein, P = 0.002) (Figure 5B). In WT-AA mice on days 1, 3, and 5, the protein expression level of MCP-1 was significantly higher than in the WT-control group on the same day (day 1, 3.98 ± 0.48 vs 1.48 ± 0.11 ng/mg protein, P = 0.0007; day 3, 4.28 ± 0.54 vs 0.96 ± 0.07 ng/mg protein; day 5, 65.09 ± 11.56 vs 1.22 ± 0.12 ng/mg protein, P = 0.001) (Figure 5B). The protein expression of MCP-1 in Tg-AA mice on days 1 and 5 was significantly lower than in WT-AA mice on the same day (day 1, 2.24 ± 0.20 vs 3.98 ± 0.48 ng/mg protein, P = 0.006; day 5, 11.24 ± 2.34 vs 65.09 ± 11.56 ng/mg protein, P < 0.0001) (Figure 5B).
Gene Expression of Transforming Growth Factor-β and α1 (I) Procollagen in the Kidney
The gene expression levels of TGF-β in the kidneys of Tg-AA mice on day 5 and of WT-AA mice on days 3 and 5 were significantly higher than in the matching control group on the same day (Tg day 5, 1.48 ± 0.13 vs 0.35 ± 0.04, P = 0.002; WT day 3, 0.89 ± 0.12 vs 0.37 ± 0.03, P = 0.002; WT day 5, 1.94 ± 0.17 vs 0.33 ± 0.04, P = 0.001; values in arbitrary units) (Figure 6). The gene expression levels in the kidneys of Tg-AA mice on days 1 and 3 were significantly lower than in the kidneys of WT-AA mice on the same day (day 1, 0.38 ± 0.03 vs 0.63 ± 0.09, P = 0.04; day 3, 0.52 ± 0.04 vs 0.89 ± 0.12, P = 0.007; values in arbitrary units) (Figure 6A).
Figure 6.
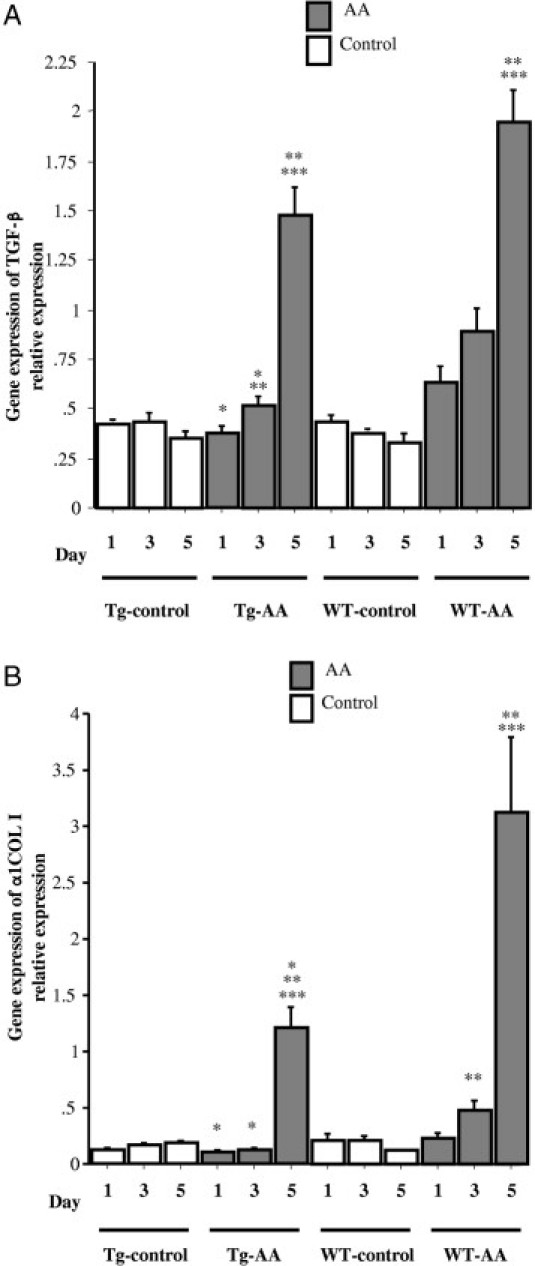
Gene expression of TGF-β and COL1A1 in the kidney of Tg and WT control and AA-treated mice. Expression of TGF-β (A) and COL1A1 (B) mRNA transcripts was determined by TaqMan real-time PCR, normalized to that of GAPDH mRNA transcripts in the same sample. Data are reported as means ± SE. *P < 0.05, compared with the WT group on the same day; **P < 0.05, compared with the same group on day 1; ***P < 0.05, compared with the same group on day 3.
The gene expression levels of COL1A1 in the kidneys of Tg-AA mice on day 5 and of WT-AA mice on days 3 and 5 were significantly higher than in the matching control group on the same day (Tg day 5, 1.21 ± 0.18 vs 0.18 ± 0.02, P = 0.002; WT day 3, 0.49 ± 0.07 vs 0.21 ± 0.05, P = 0.006; WT day 5, 3.12 ± 0.68 vs 0.12 ± 0.01, P = 0.001) (Figure 6B). The gene expression levels of COL1A1 in the kidneys of Tg-AA mice on days 1, 3, and 5 were significantly lower than in the kidneys of WT-AA mice on the same day (day 1, 0.11 ± 0.02 vs 0.22 ± 0.04, P = 0.02; day 3, 0.12 ± 0.01 vs 0.49 ± 0.07, P = 0.0004; day 5, 1.21 ± 0.18 vs 3.12 ± 0.68, P = 0.03; values in arbitrary units) (Figure 6B).
Gene Expression of Hypoxia Inducible Factor-1α in the Kidney
The gene expression levels of hypoxia inducible factor-1α (HIF-1α) in the kidneys of Tg-AA mice on day 5 and of WT-AA mice on days 3 and 5 were significantly higher than in the matching control group on the same day (Tg day 5, 0.92 ± 0.09 vs 0.46 ± 0.07, P = 0.01; WT day 3, 0.88 ± 0.06 vs 0.54 ± 0.02, P = 0.0006; WT day 5, 1.43 ± 0.16 vs 0.48 ± 0.06, P = 0.002; values in arbitrary units) (Figure 7). The gene expression levels of HIF-1α in the kidneys of Tg-AA mice on days 3 and 5 were significantly lower than in the kidneys of WT-AA mice on the same day (day 3, 0.44 ± 0.07 vs 0.88 ± 0.06, P = 0.002; day 5, 0.92 ± 0.09 vs 1.43 ± 0.16, P = 0.02; values in arbitrary units) (Figure 7).
Figure 7.
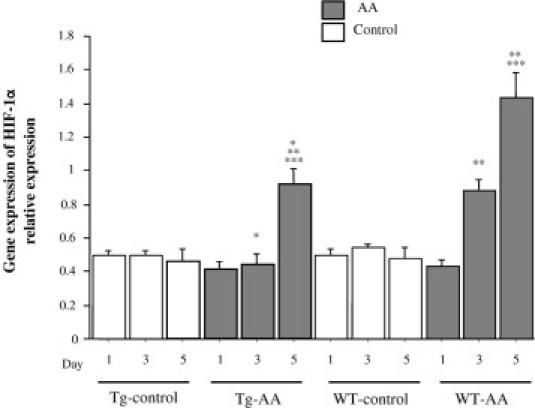
Gene expression of HIF-1α in the kidney of Tg and WT control and AA-treated mice. Expression of HIF-1α mRNA transcripts was determined by TaqMan real-time PCR, normalized to that of GAPDH mRNA transcripts in the same sample. Data are reported as means ± SE. *P < 0.05, compared with the WT group on the same day; **P < 0.05, compared with the same group on day 1; ***P < 0.05, compared with the same group on day 3.
Evaluation of Oxidative Stress
To assess oxidative stress, the urinary HEL level was measured. The urinary HEL levels in Tg-AA mice on day 1 and in WT-AA mice on days 1 and 3 were significantly higher than in the matching control group on the same day (Tg day 1, P = 0.008; WT day 1, P = 0.01; WT day 3, P = 0.0003) (Figure 8A). In the Tg-AA group, the urinary HEL levels on days 1 and 5 were significantly higher than on day 0 (day 1, P = 0.002; day 3, P = 0.01). In the WT-AA group, the urinary HEL levels on days 1, 3, and 5 were significantly higher than on day 0 (day 1, P = 0.003; day 3, P = 0.0001; day 5, P = 0.01). The urinary HEL level was significantly lower in Tg-AA mice than in WT-AA mice on days 1 and 3 (day 1, 0.63 ± 0.06 nmol/mg Cre vs 1.06 ± 0.19 nmol/mg Cre, P = 0.04; day 3, 0.66 ± 0.17 nmol/mg Cre vs 1.46 ± 0.14 nmol/mg Cre, P = 0.009) (Figure 8A). In the WT-AA group, the highest urinary HEL level was seen on day 3, and then it decreased sharply from day 3 to day 5. There was no significant difference in the urinary HEL level between the Tg-AA and WT-AA mice on day 5 (0.80 ± 0.20 nmol/mg Cre vs 0.93 ± 0.14 nmol/mg Cre, P = 0.19).
Figure 8.
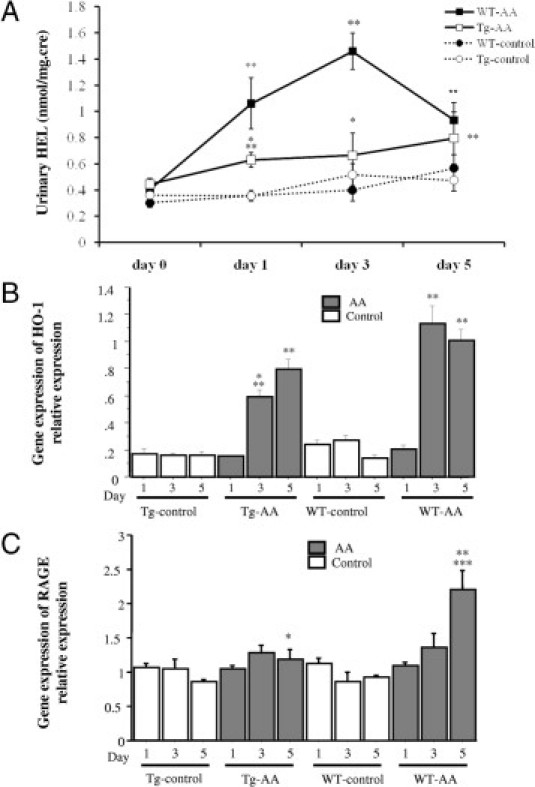
Evaluation of oxidative stress in Tg and WT control and AA-treated mice. A: The course of urinary Nε-(hexanoyl)lysine (HEL). *P < 0.05, compared with the WT group on the same day; **P < 0.05 compared with the same group on day 0. B and C: Gene expression of HO-1 and RAGE in the kidney. Expression of HO-1 (B) and RAGE (C) mRNA transcripts was determined by TaqMan real-time PCR, normalized to that of GAPDH mRNA transcripts in the same sample. Data are reported as means ± SE. *P < 0.05, compared with the WT group on the same day; **P < 0.05, compared with the same group on day 1. ***P < 0.05, compared with the same group on day 3.
The gene expression levels of HO-1 in the kidneys of both Tg-AA and WT-AA mice on days 3 and 5 were significantly higher than in the matching control group on the same day (Tg day 3, P = 0.003; Tg day 5, P = 0.002; WT day 3, P = 0.0001; WT day 5, P = 0.001) (Figure 8B). The gene expression level of HO-1 in Tg-AA mice on day 3 was significantly lower than in WT-AA mice on the same day (0.59 ± 0.05 vs 1.13 ± 0.13; P = 0.007, values in arbitrary units) (Figure 8B).
The gene expression level of RAGE in the kidneys of WT-AA mice on day 5 was significantly higher than in the kidneys of WT-control group on the same day (2.20 ± 0.28 vs 0.92 ± 0.04; P = 0.006, values in arbitrary units) (Figure 8C). The gene expression level of RAGE in the Tg-AA kidneys on day 5 was significantly lower than in the WT-AA kidneys on the same day (1.18 ± 0.15 vs 2.20 ± 0.28; P = 0.01, values in arbitrary units) (Figure 8C).
Correlation between Urinary hL-FABP and Histological Changes
In combination Tg-AA and Tg-cont group, urinary hL-FABP was significantly correlated with the ATN score (Figure 9A, r = 0.79, P < 0.0001), the degree of tubulointerstitial fibrosis (Figure 9B, r = 0.87, P < 0.0001), and the level of deposition of type I collagen (Figure 9C, r = 0.75, P < 0.0001).
Figure 9.
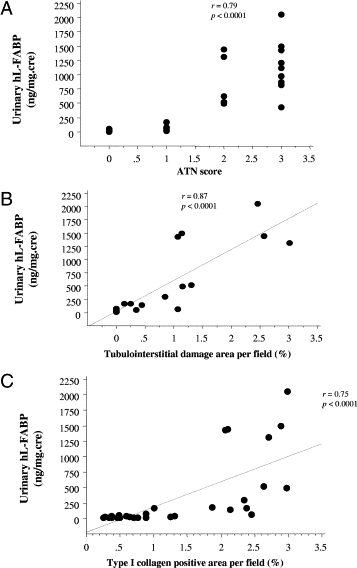
Significant correlation (P < 0.0001) between urinary hL-FABP and the ATN score (A), the degree of tubulointerstitial fibrosis (B), and the deposition of type I collagen (C) in combination Tg-AA and Tg-cont group.
Discussion
In the present study, we examined whether renal hL-FABP, with its antioxidative function, can attenuate the acute phase of AA-induced nephropathy. In WT-AA mice, high levels of urinary excretion of HEL, a urinary marker of oxidative stress, were observed; production of MCP-1, TGF-β, COL1A1, HIF-1α, HO-1, and RAGE increased; and severe infiltration of macrophages, ATN, and tubular fibrosis were provoked. In contrast, in Tg-AA mice the expression of renal hL-FABP was up-regulated and production of HEL, MCP-1, TGF-β, COL1A1, HIF-1α, HO-1 and RAGE was suppressed. The serum creatinine level was significantly lower in Tg-AA mice than in WT-AA mice. In the histological and immunohistochemical evaluation, the ATN score and the degrees of infiltrated macrophages, fibrosis, and type I collagen deposition were significantly attenuated in Tg-AA mice, compared with WT-AA mice, on days 3 and 5. These results suggest that, in this AA-induced nephrotoxicity model, oxidative stress played a significant role in the development of TID in AA-induced nephrotoxicity and that renal hL-FABP reduced oxidative stress, prevented ATN, inhibited the production of inflammatory cytokine and lipid peroxidation product, and attenuated acute TID.
In AA-induced nephrotoxicity, the production of oxidative stress in the proximal tubules is enhanced directly by intoxication with AA,14,22 or indirectly by tissue hypoxia derived from the microcirculation injury induced by AA.16,18 Consequently, lipid peroxidation products are generated. In an in vitro experiment with tubular epithelial cells, exposure to AA increased the levels of intracellular reactive oxygen species and loaded oxidative stress onto the tubular epithelial cells.22 As to the mechanism by which AA induces microcirculation injury, the proximal tubular damage induced by AA may develop into peritubular capillary damage, which leads to microcirculation injury. In an alternative potential mechanism, AA is an inhibitor of phospholipase A2 (PLA2) and suppresses the production of arachidonic acid, which is an intermediary in the production of prostaglandins with functions in attenuating renal vasodilatation and regulating renal circulation.17 The reduced level of arachidonic acid leads to microcirculation injury.
The early oxidative stress marker HEL is formed by oxidative modification by oxidized omega-6 fatty acids, such as linoleic acid or arachidonic acid.23 In the WT-AA and Tg-AA mice, the urinary HEL level increased on day 1, before up-regulation of HIF-1 gene expression, which suggests the presence of tissue hypoxia. Because renal hL-FABP with antioxidative function was expressed in the proximal tubules of Tg-AA mice, the increase in urinary HEL level was suppressed, compared with WT-AA mice. These results suggest that intoxication of the proximal tubules by AA directly provoked oxidative stress in the proximal tubules.
On days 3 and 5 in WT-AA mice, when HIF-1 gene expression was up-regulated, the urinary HEL level was high on day 3, HO-1 gene expression was up-regulated on days 3 and 5, and RAGE gene expression was up-regulated on day 5. Heme oxygenase-1 is a microsomal enzyme that catalyzes the oxidation of heme to the antioxidant molecules biliverdin and carbon monoxide.24 Expression of HO-1 is induced by oxidative stress. RAGE, also induced by oxidative stress, exacerbates interstitial inflammation and damage through activation of the intracellular signaling pathway that promotes oxidative stress.25 These results indicate that, in addition to the immediate intoxication of AA, oxidative stress was also generated by tubular hypoxia due to microcirculation injury. Furthermore, in Tg-AA mice, the urinary HEL level was significantly lower, expression of HIF-1, HO-1, and RAGE was inhibited, and TID was attenuated, compared with WT-AA mice. The presence of renal hL-FABP reduced the mediators produced by oxidative stress, inhibited tubular damage, and consequently may have suppressed microcirculation injury, prevented tissue hypoxia, and avoided additional oxidative stress overloaded onto the tubules.
Renal hL-FABP was up-regulated in the proximal tubules of Tg-AA mice on days 1, 3, and 5, compared with Tg-control mice. We have reported that renal hL-FABP expression was up-regulated in folic acid–induced nephropathy,21 in the unilateral ureteral obstruction model,8 and in the streptozotocin-induced diabetic model,9 in which oxidative stress contributes to severe TID. Thus, the onset of oxidative stress generated in Tg-AA mice might also promote the expression of renal hL-FABP in AA-induced nephrotoxicity. Moreover, on double immunohistochemical staining, hL-FABP expression was observed in the straight portion of the proximal tubules (S3 segment), in addition to the convoluted proximal tubules, during the follow-up period. Because the damaged tubules in AA-induced nephrotoxicity involve the S3 segment tubules, which are highly susceptible to hypoxia, de novo expression of hL-FABP in the S3 segment of the proximal tubules might be up-regulated to prevent TID.
Although renal hL-FABP gene expression in Tg-AA mice was up-regulated for 5 days, the protein expression of hL-FABP decreased in the proximal tubules of both the cortex and medulla on day 5. Because the urinary hL-FABP levels in Tg-AA mice increased on days 3 and 5, elevation of urinary excretion of hL-FABP derived from the proximal tubules was considered to contribute to the inverse findings for gene expression and protein expression of hL-FABP.
Aristolochic acid forms adducts with DNA and induces cell death through cell apoptosis.26 Recently, inhibition of apoptosis was reported to lead to attenuation of ATN and improvement of proteinuria in AA-induced nephrotoxicity, and apoptosis was emphasized as an important pathological feature of AA-induced nephrotoxicity.26–29 The expression of the proapoptotic genes Fas and BCL-2 associated X protein (Bax) was examined using TaqMan real-time PCR in the present study (see Supplementary Figure S1 at http://ajp.amjpathol.org). Although the gene expression level of Fas was significantly lower in Tg-AA mice than in WT-AA mice on day 5, there were no differences in the gene expression levels of Fas on day 1 and 3 and Bax on days 1, 3, and 5 between the Tg-AA and WT-AA mice. It was considered that these results were not sufficient evidence to assert that prevention of cell damage through apoptosis led to attenuation of ATN observed from day 3 in Tg-AA mice.
We reported the clinical significance of measuring urinary hL-FABP in patients with chronic kidney disease since 2004.7,19 Recently, it was reported that urinary hL-FABP was an early detection marker of acute kidney injury in clinical studies.30,31 However, because renal biopsy was not performed for the acute kidney injury patients in these studies, the relationship between urinary hL-FABP level and the degree of TID was not evaluated in the clinical setting. Under acute kidney injury in folic acid–induced nephropathy of Tg mice, the urinary hL-FABP level was significantly correlated with the degree of TID.21 In AA-induced nephrotoxicity, the urinary hL-FABP level was significantly correlated with the ATN score, tubulointerstitial fibrosis, and the deposition of type I collagen. Based on these findings, and because an increase in urinary hL-FABP accurately reflects the degree of acute tubulointerstitial injury, urinary hL-FABP was considered to be clinically useful for the detection of acute kidney injury.
The serum level of HEL was measured in an attempt to clarify whether injection of AA induced systemic oxidative stress, caused an elevation of serum HEL, and influenced urinary HEL (see Supplementary Figure S2 at http://ajp.amjpathol.org). The serum level of HEL in the Tg-AA and WT-AA mice did not increase significantly, compared with the matching control group. The increased levels of urinary HEL were therefore attributed to the HEL excreted from kidney tissue into urine.
Intraperitoneally injected AA was absorbed into the systemic circulation from the peritoneal cavity and was transported into the proximal tubules via organic anion transporters 1 and 2 (OAT1 and OAT2; solute carrier family 22 members 6 and 7),which are localized at the basolateral membrane of proximal tubular cells.32 The gene expression levels of OAT1 and OAT3 in the kidneys of the Tg and WT mice showed no significant differences (see Supplementary Figure S3 at http://ajp.amjpathol.org). We therefore considered the amount of AA loaded onto the proximal tubules to be equivalent in the two groups.
Because OAT1 and OAT3 are reportedly not expressed in the mouse liver,33 AA was considered not to be transported into liver and not to induce liver damage. However, the serum glutamic oxaloacetic transaminase level, which is a serum marker that reflects the degree of liver damage, increased on day 5 in WT-AA but not in Tg mice. The serum glutamic oxaloacetic transaminase level was significantly higher in WT-AA mice than in Tg-AA mice on day 5. Although the mechanism by which AA provokes liver injury in mice was not clarified in the present study, the results indicate that AA induced liver damage and that expression of hL-FABP in the liver of Tg-AA mice prevented the liver insult of AA. Thus, there is a possibility that attenuation of liver damage led to suppression of acute tubular damage in Tg-AA mice. However, the renoprotective function of hL-FABP in AA-induced nephrotoxicity was observed from day 3, when liver damage was not observed in WT-AA mice. Moreover, an in vitro experiment was performed to investigate the role of hL-FABP independent of other organs (see Supplementary Figure S4 at http://ajp.amjpathol.org). The cytotoxicity to proximal tubular cells was significantly suppressed in cells expressing hL-FABP, compared with cells that did not express hL-FABP. These results indicate that the expression of renal hL-FABP protected against acute tubular injury of AA-induced nephrotoxicity.
In summary, the present study provides new and important information: in AA-induced nephrotoxicity, oxidative stress plays a significant role in the development of TID and renal hL-FABP attenuates acute TID via antioxidative function.
Acknowledgments
We thank Ms. Seiko Hoshino and Aya Sakamaki (St. Marianna University School of Medicine) for technical assistance.
Footnotes
Supplemental material for this article can be found at http://ajp.amjpathol.org or at DOI: 10.1016/j.ajpath.2010.12.002.
Supplementary data
Gene expression of Fas (A) and Bax (B) in the kidney of Tg and WT control and AA-treated mice. A: Expression of Fas mRNA transcripts was determined by TaqMan real-time PCR, normalized to that of GAPDH mRNA transcripts in the same sample. Data are reported as means ± SE. *P < 0.05, compared with the WT group on the same day. B: Expression of Bax mRNA transcripts was determined by TaqMan real-time PCR, normalized to that of GAPDH mRNA transcripts in the same sample. Data are reported as means ± SE. In both the Tg-AA and WT-AA mice, the gene expression levels of Fas and Bax were significantly increased, compared with the corresponding controls. In WT-AA mice on day 5, the gene expression level of Fas was significantly higher than in Tg-AA mice on day 5 (P = 0.04); however, the gene expression levels of Fas on days 1 and 3 and of Bax on days 1, 3, and 5 in Tg-AA mice were similar to those in the WT-AA group. These results were not considered to be sufficient evidence for asserting that prevention of cell damage through apoptosis led to attenuation of ATN observed from day 3 in Tg-AA mice.
Serum HEL in Tg and WT control and AA-treated mice. Serum HEL was measured by using a HEL ELISA kit (JaICA). Serum HEL levels in Tg-AA mice were similar to those in WT-AA mice.
Gene expression of AA-transporters OAT1 (A) and OAT3 (B) was evaluated in the kidney of Tg and WT mice that did not undergo any procedures. A: Expression of OAT1 mRNA transcripts was determined by TaqMan real-time PCR, normalized to that of GAPDH mRNA transcripts in the same sample. B: Expression of OAT3 mRNA transcripts was determined by TaqMan real-time PCR, normalized to that of GAPDH mRNA transcripts in the same sample. The levels of OAT1 and OAT3 mRNA transcripts in the kidney of the Tg mice did not differ significantly from those in the WT mice.
Measurement of cytotoxicity of AA in an in vitro experiment. The cytotoxicity of AA was determined using a lactate dehydrogenase cytotoxicity assay kit (BioVision, Mountain View, CA). *P < 0.05, compared with mProx cells at the same concentration. The lactate dehydrogenase level was significantly lower in mProx-L cells than in mProx cells when AA at a final concentration of 30.0 μg/ml was added. Method: The mProx cells were originally isolated from mouse proximal tubules using microdissection methods (Patent Number: WO0073791) and were maintained in Dulbecco's modified Eagle's medium (Sigma-Aldrich) containing 10% fetal bovine serum (Gibco BRL, Rockville, MD). Because the expression of L-FABP mRNA is strongly suppressed in the rodent kidney, the mProx cell line, which was derived from C57B/6 mouse renal proximal tubule (Kamijo et al: Kidney Int 2002, 62:1628–1637), does not express L-FABP. To investigate the role of renal L-FABP independent from other organs, we compared the mProx and the hL-FABP stable transformant, mProx-L, which was established by transfecting with hL-FABP cDNA combined to the promoter region of elongation factor. Both mProx and mProx-L were seeded in 96-well plates (3 × 10⁴/well) and kept overnight in growth medium. The medium was changed to serum-free K-1 medium (Gibco BRL). After 24 hours, these cells were cultured overnight in K-1 medium with AA at a final concentration of 0.6, 6, 12, and 30 μg/ml, including fatty acid–free bovine serum albumin with low endotoxin (0.5 mg/ml, Sigma-Aldrich). Aristolochic acid was not added in the low control sample, and 1% triton X-100 was added in the high control sample. The K-1 medium consisted of a 50:50 mixture of Dulbecco's modified Eagle's medium and Hamm's F12 medium; to this was added 15 mmol/L HEPES, 13.4 mmol/L sodium bicarbonate, 5 μg/ml insulin, 5 μg/ml transferrin, 5 ng/ml selenous acid (ITS Premix, Sigma-Aldrich); 0.05 μmol/L hydrocortisone (Sigma-Aldrich); and 10 ng/ml epidermal growth factor (Sigma-Aldrich). To evaluate the cytotoxicity of AA, lactate dehydrogenase was measured using a commercially available lactate dehydrogenase cytotoxicity assay kit (BioVision), and the degree of cytotoxicity was calculated as follows: Cytotoxicity % = (Sample − ControlSamplelow)/(ControlSamplehigh − ControlSamplelow) × 100.
References
- 1.Kellum J.A. Acute kidney injury. Crit Care Med. 2008;36(4 Suppl):S141–S145. doi: 10.1097/CCM.0b013e318168c4a4. [DOI] [PubMed] [Google Scholar]
- 2.Maatman R.G., van de Westerlo E.M., van Kuppevelt T.H., Veerkamp J.H. Molecular identification of the liver- and the heart-type fatty acid-binding proteins in human and rat kidney: Use of the reverse transcriptase polymerase chain reaction. Biochem J. 1992;15:285–290. doi: 10.1042/bj2880285. [DOI] [PMC free article] [PubMed] [Google Scholar]
- 3.Veerkamp J.H., Peeters R.A., Maatman R.G. Structural and functional features of different types of cytoplasmic fatty acid-binding proteins. Biochim Biophys Acta. 1991;4:1–24. doi: 10.1016/0005-2760(91)90244-c. [DOI] [PubMed] [Google Scholar]
- 4.Veerkamp J.H., van Kuppevelt T.H., Maatman R.G., Prinsen C.F. Structural and functional aspects of cytosolic fatty acid-binding proteins. Prostaglandins Leukot Essent Fatty Acids. 1993;49:887–906. doi: 10.1016/0952-3278(93)90174-u. [DOI] [PubMed] [Google Scholar]
- 5.Ek-Von Mentzer B.A., Zhang F., Hamilton J.A. Binding of 13-HODE and 15-HETE to phospholipid bilayers, albumin, and intracellular fatty acid binding proteins: Implications for transmembrane and intracellular transport and for protection from lipid peroxidation. J Biol Chem. 2001;11:15575–15580. doi: 10.1074/jbc.M011623200. [DOI] [PubMed] [Google Scholar]
- 6.Wang G., Gong Y., Anderson J., Sun D., Minuk G., Roberts M.S., Burczynski F.J. Antioxidative function of L-FABP in L-FABP stably transfected Chang liver cells. Hepatology. 2005;42:871–879. doi: 10.1002/hep.20857. [DOI] [PubMed] [Google Scholar]
- 7.Kamijo A., Sugaya T., Hikawa A., Okada M., Okumura F., Yamanouchi M., Honda A., Okabe M., Fujino T., Hirata Y., Omata M., Kaneko R., Fujii H., Fukamizu A., Kimura K. Urinary excretion of fatty acid-binding protein reflects stress overload on the proximal tubules. Am J Pathol. 2004;165:1243–1255. doi: 10.1016/S0002-9440(10)63384-6. [DOI] [PMC free article] [PubMed] [Google Scholar]
- 8.Kamijo-Ikemori A., Sugaya T., Obama A., Hiroi J., Miura H., Watanabe M., Kumai T., Ohtani-Kaneko R., Hirata K., Kimura K. Liver-type fatty acid-binding protein attenuates renal injury induced by unilateral ureteral obstruction. Am J Pathol. 2006;169:1107–1117. doi: 10.2353/ajpath.2006.060131. [DOI] [PMC free article] [PubMed] [Google Scholar]
- 9.Kamijo-Ikemori A., Sugaya T., Sekizuka A., Hirata K., Kimura K. Amelioration of diabetic tubulointerstitial damage in liver-type fatty acid-binding protein transgenic mice. Nephrol Dial Transplant. 2009;24:788–800. doi: 10.1093/ndt/gfn573. [DOI] [PubMed] [Google Scholar]
- 10.Yamamoto T., Noiri E., Ono Y., Doi K., Negishi K., Kamijo A., Kimura K., Fujita T., Kinukawa T., Taniguchi H., Nakamura K., Goto M., Shinozaki N., Ohshima S., Sugaya T. Renal L-type fatty acid-binding protein in acute ischemic injury. J Am Soc Nephrol. 2007;18:2894–2902. doi: 10.1681/ASN.2007010097. [DOI] [PubMed] [Google Scholar]
- 11.Negishi K., Noiri E., Maeda R., Portilla D., Sugaya T., Fujita T. Renal L-type fatty acid-binding protein mediates the bezafibrate reduction of cisplatin-induced acute kidney injury. Kidney Int. 2008;73:1374–1384. doi: 10.1038/ki.2008.106. [DOI] [PubMed] [Google Scholar]
- 12.Debelle F.D., Vanherweghem J.L., Nortier J.L. Aristolochic acid nephropathy: a worldwide problem. Kidney Int. 2008;74:158–169. doi: 10.1038/ki.2008.129. [DOI] [PubMed] [Google Scholar]
- 13.Depierreux M., Van Damme B., Vanden Houte K., Vanherweghem J.L. Pathologic aspects of a newly described nephropathy related to the prolonged use of Chinese herbs. Am J Kidney Dis. 1994;24:172–180. doi: 10.1016/s0272-6386(12)80178-8. [DOI] [PubMed] [Google Scholar]
- 14.Chen Y.Y., Chung J.G., Wu H.C., Bau D.T., Wu K.Y., Kao S.T., Hsiang C.Y., Ho T.Y., Chiang S.Y. Aristolochic acid suppresses DNA repair and triggers oxidative DNA damage in human kidney proximal tubular cells. Oncol Rep. 2010;24:141–153. doi: 10.3892/or_00000839. [DOI] [PubMed] [Google Scholar]
- 15.Pozdzik A.A., Salmon I.J., Debelle F.D., Decaestecker C., Van den Branden C., Verbeelen D., Deschodt-Lanckman M.M., Vanherweghem J.L., Nortier J.L. Aristolochic acid induces proximal tubule apoptosis and epithelial to mesenchymal transformation. Kidney Int. 2008;73:595–607. doi: 10.1038/sj.ki.5002714. [DOI] [PubMed] [Google Scholar]
- 16.Yang L., Li X., Wang H. Possible mechanisms explaining the tendency towards interstitial fibrosis in aristolochic acid-induced acute tubular necrosis. Nephrol Dial Transplant. 2007;22:445–456. doi: 10.1093/ndt/gfl556. [DOI] [PubMed] [Google Scholar]
- 17.Ni Y., Su M., Qiu Y., Chen M., Liu Y., Zhao A., Jia W. Metabolic profiling using combined GC-MS and LC-MS provides a systems understanding of aristolochic acid-induced nephrotoxicity in rat. FEBS Lett. 2007;20:707–711. doi: 10.1016/j.febslet.2007.01.036. [DOI] [PubMed] [Google Scholar]
- 18.Wen Y.J., Qu L., Li X.M. Ischemic injury underlies the pathogenesis of aristolochic acid-induced acute kidney injury. Transl Res. 2008;152:38–46. doi: 10.1016/j.trsl.2008.05.002. [DOI] [PubMed] [Google Scholar]
- 19.Kamijo A., Kimura K., Sugaya T., Yamanouchi M., Hikawa A., Hirano N., Hirata Y., Goto A., Omata M. Urinary fatty acid-binding protein as a new clinical marker of the progression of chronic renal disease. J Lab Clin Med. 2004;143:23–30. doi: 10.1016/j.lab.2003.08.001. [DOI] [PubMed] [Google Scholar]
- 20.He Z., Lu L., Altmann C., Hoke T.S., Ljubanovic D., Jani A., Dinarello C.A., Faubel S., Edelstein C.L. Interleukin-18 binding protein transgenic mice are protected against ischemic acute kidney injury. Am J Physiol Renal Physiol. 2008;295:F1414–F1421. doi: 10.1152/ajprenal.90288.2008. [DOI] [PMC free article] [PubMed] [Google Scholar]
- 21.Yokoyama T., Kamijo-Ikemori A., Sugaya T., Hoshino S., Yasuda T., Kimura K. Urinary excretion of liver type fatty acid binding protein accurately reflects the degree of tubulointerstitial damage. Am J Pathol. 2009;174:2096–2106. doi: 10.2353/ajpath.2009.080780. [DOI] [PMC free article] [PubMed] [Google Scholar]
- 22.Liu Q., Wang Q., Yang X., Shen X., Zhang B. Differential cytotoxic effects of denitroaristolochic acid II and aristolochic acids on renal epithelial cells. Toxicol Lett. 2009;184:5–12. doi: 10.1016/j.toxlet.2008.10.020. [DOI] [PubMed] [Google Scholar]
- 23.Kato Y., Mori Y., Makino Y., Morimitsu Y., Hiroi S., Ishikawa T., Osawa T. Formation of Nepsilon-(hexanonyl)lysine in protein exposed to lipid hydroperoxide: A plausible marker for lipid hydroperoxide-derived protein modification. J Biol Chem. 1999;274:20406–20414. doi: 10.1074/jbc.274.29.20406. [DOI] [PubMed] [Google Scholar]
- 24.Maines M.D. Heme oxygenase: function, multiplicity, regulatory mechanisms, and clinical applications. FASEB J. 1988;2:2557–2568. [PubMed] [Google Scholar]
- 25.Schmidt A.M., Hori O., Cao R., Yan S.D., Brett J., Wautier J.L., Ogawa S., Kuwabara K., Matsumoto M., Stern D. RAGE: a novel cellular receptor for advanced glycation end products. Diabetes. 1996;45(Suppl 3):S77–S80. doi: 10.2337/diab.45.3.s77. [DOI] [PubMed] [Google Scholar]
- 26.Zhou L., Fu P., Huang X.R., Liu F., Lai K.N., Lan H.Y. Activation of p53 promotes renal injury in acute aristolochic acid nephropathy. J Am Soc Nephrol. 2010;21:31–41. doi: 10.1681/ASN.2008111133. [DOI] [PMC free article] [PubMed] [Google Scholar]
- 27.Balachandran P., Wei F., Lin R.C., Khan I.A., Pasco D.S. Structure activity relationships of aristolochic acid analogues: toxicity in cultured renal epithelial cells. Kidney Int. 2005;67:1797–1805. doi: 10.1111/j.1523-1755.2005.00277.x. [DOI] [PubMed] [Google Scholar]
- 28.Liu M.C., Maruyama S., Mizuno M., Morita Y., Hanaki S., Yuzawa Y., Matsuo S. The nephrotoxicity of Aristolochia manshuriensis in rats is attributable to its aristolochic acids. Clin Exp Nephrol. 2003;7:186–194. doi: 10.1007/s10157-003-0229-z. [DOI] [PubMed] [Google Scholar]
- 29.Gao R., Zheng F., Liu Y., Zheng D., Li X., Bo Y., Liu Y. Aristolochic acid I-induced apoptosis in LLC-PK1 cells and amelioration of the apoptotic damage by calcium antagonist. Chin Med J (Engl) 2000;113:418–424. [PubMed] [Google Scholar]
- 30.Ferguson M.A., Vaidya V.S., Waikar S.S., Collings F.B., Sunderland K.E., Gioules C.J., Bonventre J.V. Urinary liver-type fatty acid-binding protein predicts adverse outcomes in acute kidney injury. Kidney Int. 2010;77:708–714. doi: 10.1038/ki.2009.422. [DOI] [PMC free article] [PubMed] [Google Scholar]
- 31.Portilla D., Dent C., Sugaya T., Nagothu K.K., Kundi I., Moore P., Noiri E., Devarajan P. Liver fatty acid-binding protein as a biomarker of acute kidney injury after cardiac surgery. Kidney Int. 2008;73:465–472. doi: 10.1038/sj.ki.5002721. [DOI] [PubMed] [Google Scholar]
- 32.Bakhiya N., Arlt V.M., Bahn A., Burckhardt G., Phillips D.H., Glatt H. Molecular evidence for an involvement of organic anion transporters (OATs) in aristolochic acid nephropathy. Toxicology. 2009;264:74–79. doi: 10.1016/j.tox.2009.07.014. [DOI] [PubMed] [Google Scholar]
- 33.Sweet D.H., Miller D.S., Pritchard J.B., Fujiwara Y., Beier D.R., Nigam S.K. Impaired organic anion transport in kidney and choroid plexus of organic anion transporter 3 (Oat3 (Slc22a8)) knockout mice. J Biol Chem. 2002;277:26934–26943. doi: 10.1074/jbc.M203803200. [DOI] [PubMed] [Google Scholar]
Associated Data
This section collects any data citations, data availability statements, or supplementary materials included in this article.
Supplementary Materials
Gene expression of Fas (A) and Bax (B) in the kidney of Tg and WT control and AA-treated mice. A: Expression of Fas mRNA transcripts was determined by TaqMan real-time PCR, normalized to that of GAPDH mRNA transcripts in the same sample. Data are reported as means ± SE. *P < 0.05, compared with the WT group on the same day. B: Expression of Bax mRNA transcripts was determined by TaqMan real-time PCR, normalized to that of GAPDH mRNA transcripts in the same sample. Data are reported as means ± SE. In both the Tg-AA and WT-AA mice, the gene expression levels of Fas and Bax were significantly increased, compared with the corresponding controls. In WT-AA mice on day 5, the gene expression level of Fas was significantly higher than in Tg-AA mice on day 5 (P = 0.04); however, the gene expression levels of Fas on days 1 and 3 and of Bax on days 1, 3, and 5 in Tg-AA mice were similar to those in the WT-AA group. These results were not considered to be sufficient evidence for asserting that prevention of cell damage through apoptosis led to attenuation of ATN observed from day 3 in Tg-AA mice.
Serum HEL in Tg and WT control and AA-treated mice. Serum HEL was measured by using a HEL ELISA kit (JaICA). Serum HEL levels in Tg-AA mice were similar to those in WT-AA mice.
Gene expression of AA-transporters OAT1 (A) and OAT3 (B) was evaluated in the kidney of Tg and WT mice that did not undergo any procedures. A: Expression of OAT1 mRNA transcripts was determined by TaqMan real-time PCR, normalized to that of GAPDH mRNA transcripts in the same sample. B: Expression of OAT3 mRNA transcripts was determined by TaqMan real-time PCR, normalized to that of GAPDH mRNA transcripts in the same sample. The levels of OAT1 and OAT3 mRNA transcripts in the kidney of the Tg mice did not differ significantly from those in the WT mice.
Measurement of cytotoxicity of AA in an in vitro experiment. The cytotoxicity of AA was determined using a lactate dehydrogenase cytotoxicity assay kit (BioVision, Mountain View, CA). *P < 0.05, compared with mProx cells at the same concentration. The lactate dehydrogenase level was significantly lower in mProx-L cells than in mProx cells when AA at a final concentration of 30.0 μg/ml was added. Method: The mProx cells were originally isolated from mouse proximal tubules using microdissection methods (Patent Number: WO0073791) and were maintained in Dulbecco's modified Eagle's medium (Sigma-Aldrich) containing 10% fetal bovine serum (Gibco BRL, Rockville, MD). Because the expression of L-FABP mRNA is strongly suppressed in the rodent kidney, the mProx cell line, which was derived from C57B/6 mouse renal proximal tubule (Kamijo et al: Kidney Int 2002, 62:1628–1637), does not express L-FABP. To investigate the role of renal L-FABP independent from other organs, we compared the mProx and the hL-FABP stable transformant, mProx-L, which was established by transfecting with hL-FABP cDNA combined to the promoter region of elongation factor. Both mProx and mProx-L were seeded in 96-well plates (3 × 10⁴/well) and kept overnight in growth medium. The medium was changed to serum-free K-1 medium (Gibco BRL). After 24 hours, these cells were cultured overnight in K-1 medium with AA at a final concentration of 0.6, 6, 12, and 30 μg/ml, including fatty acid–free bovine serum albumin with low endotoxin (0.5 mg/ml, Sigma-Aldrich). Aristolochic acid was not added in the low control sample, and 1% triton X-100 was added in the high control sample. The K-1 medium consisted of a 50:50 mixture of Dulbecco's modified Eagle's medium and Hamm's F12 medium; to this was added 15 mmol/L HEPES, 13.4 mmol/L sodium bicarbonate, 5 μg/ml insulin, 5 μg/ml transferrin, 5 ng/ml selenous acid (ITS Premix, Sigma-Aldrich); 0.05 μmol/L hydrocortisone (Sigma-Aldrich); and 10 ng/ml epidermal growth factor (Sigma-Aldrich). To evaluate the cytotoxicity of AA, lactate dehydrogenase was measured using a commercially available lactate dehydrogenase cytotoxicity assay kit (BioVision), and the degree of cytotoxicity was calculated as follows: Cytotoxicity % = (Sample − ControlSamplelow)/(ControlSamplehigh − ControlSamplelow) × 100.