

Abstract
Inflammation contributes to liver injury during cholestasis. The mechanism by which cholestasis initiates an inflammatory response in the liver, however, is not known. Two hypotheses were investigated in the present studies. First, activation of Toll-like receptor 4 (TLR4), either by bacterial lipopolysaccharide or by damage-associated molecular pattern molecules released from dead hepatocytes, triggers an inflammatory response. Second, bile acids act as inflammagens, and directly activate signaling pathways in hepatocytes that stimulate production of proinflammatory mediators. Liver inflammation was not affected in lipopolysaccharide-resistant C3H/HeJ mice after bile duct ligation, indicating that Toll-like receptor 4 is not required for initiation of inflammation. Treatment of hepatocytes with bile acids did not directly cause cell toxicity but increased the expression of numerous proinflammatory mediators, including cytokines, chemokines, adhesion molecules, and other proteins that influence immune cell levels and function. Up-regulation of several of these genes in hepatocytes and in the liver after bile duct ligation required early growth response factor-1, but not farnesoid X receptor. In addition, early growth response factor-1 was up-regulated in the livers of patients with cholestasis and correlated with levels of inflammatory mediators. These data demonstrate that Toll-like receptor 4 is not required for the initiation of acute inflammation during cholestasis. In contrast, bile acids directly activate a signaling network in hepatocytes that promotes hepatic inflammation during cholestasis.
Cholestatic liver disease develops when bile flow from the liver is interrupted.1,2 This can occur during autoimmune reactions, congenital disorders, pregnancy, drug hepatotoxicities, and other forms of liver disease.1 Cholestasis causes concentrations of bile acids to rapidly increase in liver and plasma.3,4 As this disease progresses, hepatic inflammation and hepatocyte injury ultimately develop.5 If cholestasis is not corrected and hepatocyte injury persists, portal myofibroblasts and hepatic stellate cells are stimulated to proliferate and produce extracellular matrix, a process that ultimately results in the development of biliary fibrosis and eventually cirrhosis.6
A major consequence of acute cholestasis, especially obstructive cholestasis, is the development of severe liver injury.7 It is generally assumed that exposure of hepatocytes to high concentrations of potentially toxic bile acids is mainly responsible for cholestatic liver injury.8 In support of this concept, several studies have demonstrated that high concentrations of certain bile acids produce hepatocyte cell death in vitro through activation of proapoptotic pathways.9–11 In these studies, deoxycholic acid (DCA), lithocholic acid, and their metabolites are frequently used.11–13 One caveat of these studies, however, is that plasma and liver concentrations of secondary bile acids (eg, lithocholic acid and DCA) do not dramatically increase in humans with cholestasis or in animal models of cholestasis,14–16 because these bile acids are formed in the intestine from primary bile acids, and intestinal concentrations of primary bile acids decrease during cholestasis because of diminished biliary excretion.14,15 On the other hand, serum levels of the most abundant primary bile acids, such as cholic acid and muricholic acid, increase to 200–250 μmol/L in mice subjected to bile duct ligation (BDL) for 7 days.14 In contrast to DCA and lithocholic acid, however, these bile acids are relatively nontoxic to hepatocytes in culture.17 Accordingly, these data raise the question of whether direct bile acid toxicity can be entirely or even partially responsible for liver injury observed during obstructive cholestasis.18
Recent studies suggest that inflammatory cells such as neutrophils are activated and recruited into the liver during obstructive cholestasis and cause significant liver injury in a murine model of bile duct ligation.5 This inflammatory response correlated with substantial formation of pro-inflammatory cytokines and expression of intercellular adhesion molecule-1 (ICAM-1).19 Because liver injury in mice deficient in CD18 or ICAM-1 was almost eliminated, it was concluded that infiltrating neutrophils and not bile acids were responsible for hepatocellular injury.5,19 In support of these findings from animal studies, serum levels of the neutrophil chemokine IL-8 are increased in patients with cholestatic liver disease.20,21 Furthermore, ICAM-1 is up-regulated and neutrophils are present in the livers of these patients.22 Thus, both animal and human studies support the hypothesis that an inflammatory response during obstructive cholestasis plays a critical role in the injury process.
What remains unclear is the molecular mechanism by which cholestasis initiates this inflammatory response in the liver. Two hypotheses were investigated in the present studies to explain this mechanism. First, activation of Toll-like receptor 4 (TLR4), either by bacterial lipopolysaccharide (LPS) released from the gut or by damage-associated molecular pattern molecules (DAMPs) released from dead hepatocytes exposed to pathological concentrations of bile acids, triggers an inflammatory response. Second, bile acids act as inflammagens and directly activate signaling pathways in hepatocytes that regulate production of pro-inflammatory mediators that stimulate recruitment of neutrophils into the liver. A better understanding of the initiating events of the inflammatory response may point to clinically relevant therapeutic strategies against cholestatic liver injury and even fibrosis, without affecting the vital host defense functions of neutrophils.
Materials and Methods
Animals
Mice used for these studies were male, ranging in age from 8 to 10 weeks: C57BL/6 (Harlan Laboratories, Indianapolis, IN), C57BL/6NTac (Taconic, Germantown, NY), early growth response factor-1 (Egr-1) knockout (B6.129-Egr1tm1Jmi N12; Taconic), C3H/HeJ (Jackson Laboratories, Bar Harbor, ME), and C3Heb/FeJ (Jackson Laboratories). Farnesoid X receptor (FXR) knockout mice, described previously,23 were provided by Dr. Grace Guo, Ph.D., University of Kansas Medical Center. All animals were maintained on a 12-hour light/dark cycle under controlled temperature (18–21°C) and humidity. Food (Teklad rodent chow; Harlan Laboratories, Madison, WI) and tap water were allowed ad libitum. All procedures on animals were conducted in accordance with the Guide for the Care and Use of Laboratory Animals promulgated by the National Institutes of Health.
Hepatocyte Isolation
Hepatocytes were isolated from the livers of mice by collagenase perfusion, as we have described previously.24 The hepatocytes were cultured in Williams' medium E containing 10% fetal bovine serum and penicillin-streptomycin. Hepatocytes were treated with bile acids within 16 hours of plating. For caspase inhibition studies, cells were incubated with the pan-caspase inhibitor quinoline-val-asp-difluorophenoxymethylketone (MP Biomedicals, Santa Ana, CA), for 30 minutes before bile acid treatment.
Bile Duct Ligation
Mice were subjected to BDL as described previously.24
Human Liver Samples
Research involving human liver was reviewed by the University of Kansas Medical Center Human Research Protection Program. The specimens were provided by the KU Liver Center Tissue Bank. Diseased liver tissue used for these studies was collected from patients with primary biliary cirrhosis (4 females, ages 59, 56, 60, and 61 years; 1 male, age 47 years) or primary sclerosing cholangitis (3 males, ages 44, 45, and 57 years). Liver samples without histological evidence of cholestasis, fibrosis, or severe inflammation were selected as control tissues (5 females, ages 41, 48, 56, 52, and 66 years; 5 males, age 57, 45, 57, 58, and 48 years).
Measurement of Hepatocyte Viability
Cells were plated and treated as described above. Cell death was evaluated by measuring the release of alanine aminotransferase (ALT) into the medium as an indicator of necrotic cell death, as described previously.25 Cleavage of the Ac-DEVD-AMC substrate was measured to quantify caspase 3 activity. Briefly, cells were lysed with cell lysis buffer (50 mmol/L HEPES, pH 7.4; 100 mmol/L NaCl; 0.1% 3-[(3-cholamidopropyl)dimethylammonio]-1-propanesulfonate; 0.1 mmol/L ethylene-diamine-tetraacetic acid; 1 mmol/L dithiothreitol). The lysate was centrifuged at 10,000 g for 10 minutes at 4°C. The supernatant was collected and incubated with 200 μmol/L of Ac-DEVD-AMC substrate (BD Biosciences San Diego, CA) in assay buffer (50 mmol/L HEPES (pH 7.4); 100 mmol/L NaCl; 0.1% CHAPS; 0.1 mmol/L ethylene-diamine-tetraacetic acid; 10% glycerol; 10 mmol/L dithiothreitol). Cleavage of the Ac-DEVD-AMC substrate was measured kinetically by liberation of AMC using a Synergy 2 plate reader (BioTek, Winooski, VT) (380 nm excitation and 430–460 nm emission wavelengths).
Real-Time PCR
RNA was isolated using TRI reagent (Sigma-Aldrich, St. Louis, MO), and was reverse-transcribed into cDNA, as we have described previously.24 Real-time PCR was performed on an ABI 7900 real-time PCR instrument (Applied Biosystems, Foster City, CA) with the ABI SYBR Green DNA PCR kit. Sequences of primers are listed in Table 1. A customized TaqMan qPCR array (Applied Biosystems) was used to measure mRNA levels of the genes listed in Supplemental Table S1 (see http://www.ajp.amjpathol.org). PCR was performed according to the manufacturer's recommendations.
Table 1.
Sequences of Real-Time PCR Primers
| Gene | Forward primer | Reverse primer |
|---|---|---|
| Mouse Egr-1 | 5′-GGCAGAGGAAGACGATGAAG-3′ | 5′-GACGAGTTATCCCAGCCAAA-3′ |
| MIP-2 | 5′-CTCAGACAGCGAGGCACATC-3′ | 5′-CCTCAACGGAAGAACCAAAGAG-3′ |
| Mouse ICAM-1 | 5′-CGACGCCGCTCAGAAGAA-3′ | 5′-GTCTCGGAAGGGAGCCAAGTA-3′ |
| Mouse 18S | 5′-TTGACGGAAGGGCACCACCAG-3′ | 5′-GCACCACCACCCACGGAATCG-3′ |
| Mouse PAI-1 | 5′-AGTCTTTCCGACCAAGAGCA-3′ | 5′-ATCACTTGCCCCATGAAGAG-3′ |
| VCAM-1 | 5′-TGGCTGTGACTCCCCTTCTTT-3′ | 5′-AGAGCTCAACACAAGCGTGGA-3′ |
| Ccl7 | 5′-AAGATCCCCAAGAGGAATCTCA-3′ | 5′-CAGACTTCCATGCCCTTCTTT-3′ |
| Human 18S | 5′-AACTTTCGATGGTCTCGCCG-3′ | 5′-CCTTGGATGTGGTAGCGTTT-3′ |
| Human Egr-1 | 5′-TACTCCTCTGTTCCCCCTGCTT-3′ | 5′-GAAAAGGTTGCTGTCATGTCCG-3′ |
| Human ICAM-1 | 5′-CGGCTGACGTGTGCAGTAATAC-3′ | 5′-GGCTTCGTCAGAATCACGTTG-3′ |
| IL-8 | 5′-TCCTTGTTCCACTGTGCCTTG-3′ | 5′-TGCTTCCACATGTCCTCACAA-3′ |
| Human PAI-1 | 5′-GTTCATTGCTGCCCCTTATGAA-3′ | 5′-AGCCTGGTCATGTTGGCCTTTC-3′ |
| Snail | 5′-TTTTGCTGACCGCTCCAAC-3′ | 5′-TGCTTGTGGAGCAAGGACAT-3′ |
Immunohistochemistry
Sections of frozen liver were incubated with rat anti-mouse vascular cell adhesion molecule-1 (VCAM-1) antibody diluted 1:50 (Millipore Bioscience Research Reagents, Temecula, CA). The sections were washed and incubated with goat anti-rat conjugated to Alexa 594 (Invitrogen, Carlsbad, CA).
Protein Quantification
Hepatocytes were lysed in RIPA (radio-immunoprecipitation assay) buffer containing complete protease inhibitor cocktail and PhosSTOP phosphatase inhibitor (both from Roche Applied Science, Indianapolis, IN). Equal amounts of protein were separated on a 7.5% or 4.5%–15% gradient Criterion polyacrylamide gel (Bio-Rad, Hercules, CA) and transferred to a polyvinylidene difluoride membrane (Immobilon-P; Millipore, Bedford, MA). The membrane was incubated with anti-ICAM-1 antibody (R&D Systems, Minneapolis, MN), anti-Egr-1 antibody (Cell Signaling Technology, Danvers, MA) or anti-β-actin antibody (Sigma-Aldrich), followed by incubation with the appropriate horseradish peroxidase-conjugated secondary antibody (Santa Cruz Biotechnology, Santa Cruz, CA). The bands were visualized using the Immun-Star HRP Substrate Kit (Bio-Rad). Macrophage inflammatory protein-2 (MIP-2) was measured in cell culture medium using the Bio-Plex assay (Bio-Rad), according to the manufacturer's instructions.
Quantification of Liver Injury in BDL Mice
ALT was measured in serum using a commercially available kit, as described previously.24
Quantification of Neutrophil Accumulation and Extravasation
Neutrophil accumulation and extravasation were quantified as described previously.5
Statistical Analysis
Results are presented as the mean ± SEM. Data were analyzed by analysis of variance or t-test. Analysis of variance was performed on logX-transformed data in instances in which variances were not homogeneous. Comparisons among group means were made using the Student-Newman-Keuls test. Spearman correlation was performed to identify correlations between Egr-1 mRNA levels and mRNA levels of other inflammatory mediators in human livers. The criterion for significance was P < 0.05 for all studies.
Results
Neutrophil Accumulation and Extravasation in the Livers of BDL Mice Occurs Independently of TLR4 Signaling
To determine whether TLR4 is required for stimulation of inflammation in the liver during cholestasis, C3H/HeJ mice, which have an inactivating mutation in the TLR4 gene,26 and C3Heb/FeJ mice, TLR4 wild type, were subjected to BDL. Plasma ALT activity and % area of liver necrosis after BDL were unaffected in C3H/HeJ mice, consistent with previous studies (Figure 1).27 Similarly, total numbers of neutrophils in the liver and numbers of extravasated neutrophils after BDL were unaffected in C3H/HeJ mice (Figure 1). These results suggest that LPS does not initiate inflammation through activation of TLR4 during cholestasis.
Figure 1.
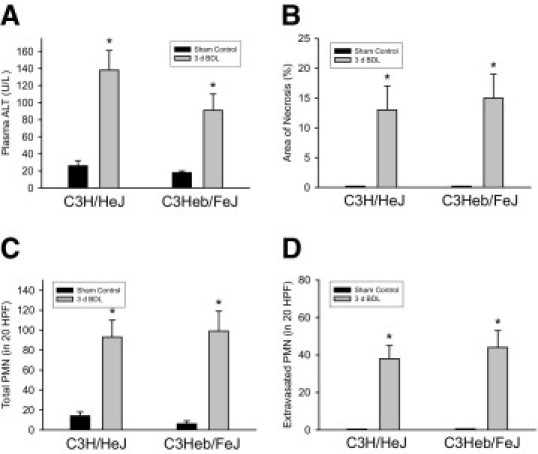
Role of Toll-like receptor 4 (TLR4) in inflammation in the liver during cholestasis. C3H/HeJ (TLR4 mutant) and C3Heb/FeJ (TLR4 wild-type) mice were subjected to bile duct ligation (BDL) or sham operation. Three days later, plasma alanine aminotransferase (ALT) (A), % area of necrosis (B), neutrophil (PMN) accumulation (C), and PMN extravasation (D) were measured. Data are expressed as mean ± SEM; n = .6. Values significantly different (*P < 0.05) from sham-operated mice. HPF, high-power field.
Bile Acids Increase Expression of ICAM-1 and MIP-2 in Hepatocytes
Bile acids activate several signaling pathways in hepatocytes.28–30 Accordingly, we next determined whether bile acids increase expression of proinflammatory mediators in hepatocytes. For this study, hepatocytes were exposed to DCA, chenodeoxycholic acid (CDCA), and taurocholic acid (TCA). DCA was chosen because several studies have shown that DCA activates signal transduction pathways in hepatocytes.28–30 CDCA was chosen because serum levels of CDCA increase in BDL mice.14 TCA was chosen because serum levels of cholic acid increase in BDL mice,14 and because we recently determined that >99% of cholic acid is conjugated with taurine (Copple, Jaeschke, and Klaassen, unpublished data). Exposure of primary mouse hepatocytes to DCA, CDCA, or TCA increased mRNA levels of ICAM-1 and macrophage inflammatory protein-2 (MIP-2), a neutrophil chemokine involved in cholestatic liver injury (Figure 2, A and B).31
Figure 2.
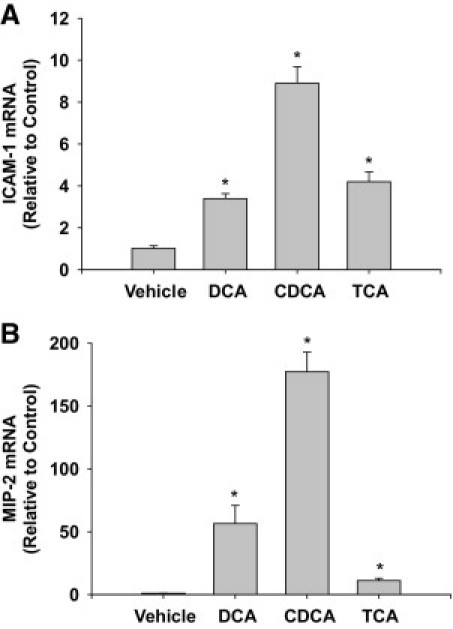
Up-regulation of intercellular adhesion molecule-1 (ICAM-1) and macrophage inflammatory protein-2 (MIP-2) in bile acid-treated hepatocytes. Hepatocytes were isolated from mice and treated with 200 μmol/L deoxycholic acid (DCA), chenodeoxycholic acid (CDCA), or taurocholic acid (TCA). Six hours later, mRNA levels of ICAM-1 (A) and MIP-2 (B) were quantified by real-time PCR. Data are expressed as mean ± SEM; n = 3. Values significantly different (*P < 0.05) from vehicle-treated hepatocytes.
Bile Acids Increase Expression of ICAM-1 and MIP-2 in Hepatocytes Independent of Effects on Viability
Next we investigated the mechanism by which bile acids increase expression of ICAM-1 and MIP-2 in hepatocytes. Studies have demonstrated that bile acids kill hepatocytes by apoptosis and necrosis in vitro.28 Apoptotic bodies and proteins released from necrotic cells have been shown to increase expression of proinflammatory mediators in some cells types.32 Accordingly, we next determined whether bile acids caused apoptosis or necrosis in our studies and whether apoptosis contributed to the increase in ICAM-1 and MIP-2 mRNAs in bile acid-treated hepatocytes. Exposure of hepatocytes to DCA, CDCA, and TCA did not increase caspase 3 activity (Figure 3A), stimulate ALT release (Figure 3B), or cause morphological changes consistent with apoptosis or necrosis (Figure 3, C–F). Lastly, treatment of hepatocytes with quinoline-val-asp-difluorophenoxymethylketone, a pan-caspase inhibitor, did not prevent up-regulation of MIP-2 or ICAM-1 by DCA (Figure 3, G and H).
Figure 3.
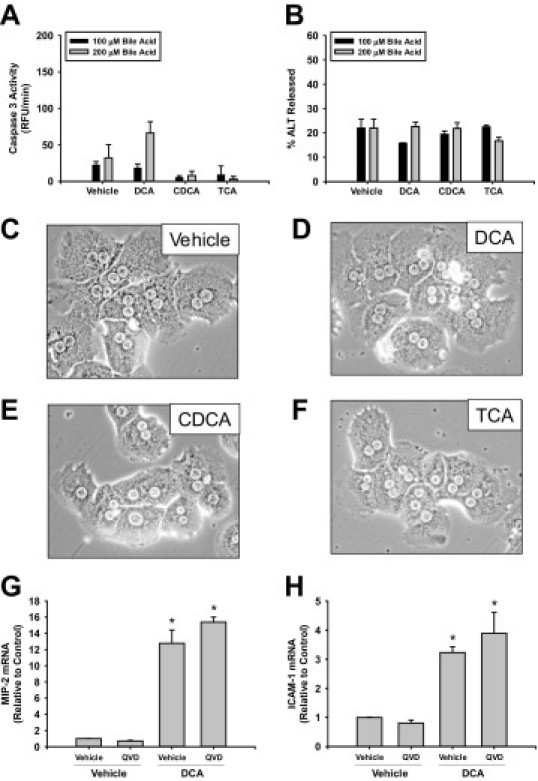
Bile acids do not affect the viability of hepatocytes. Hepatocytes were isolated from mice and treated with 200 μmol/L DCA, CDCA, or TCA. Six hours later, activities of caspase 3 (A) and ALT (B) were measured. Data are expressed as mean ± SEM; n = 3. Photomicrographs (200X) of cells treated with vehicle (A), DCA (B), CDCA (C), or TCA (D) were taken 6 hours after treatment. Primary hepatocytes were isolated and pretreated with quinoline-val-asp-difluorophenoxymethylketone (QVD) or dimethyl sulfoxide vehicle followed by treatment with DCA. mRNA levels of ICAM-1 (G) and MIP-2 (H) were measured 6 hours later. Data are expressed as mean ± SEM; n = 3. Values significantly different (*P < 0.05) from vehicle-treated hepatocytes.
Farnesoid X Receptor Is Not Required for Up-Regulation of ICAM-1 and MIP-2 in BDL Mice
Previous studies demonstrated that FXR regulates ICAM-1 in HepG2 cells.33 To determine whether this occurs in vivo during cholestasis, wild-type and FXR knockout mice were subjected to BDL. Bile duct ligation increased ICAM-1 mRNA levels to the same extent in wild-type and FXR knockout mice (Figure 4A). MIP-2 mRNA levels were increased to a greater extent in FXR knockout mice subjected to BDL, compared with BDL wild-type mice (Figure 4B). Hepatic neutrophil numbers were not significantly different between BDL wild-type and FXR knockout mice (Figure 4C).
Figure 4.
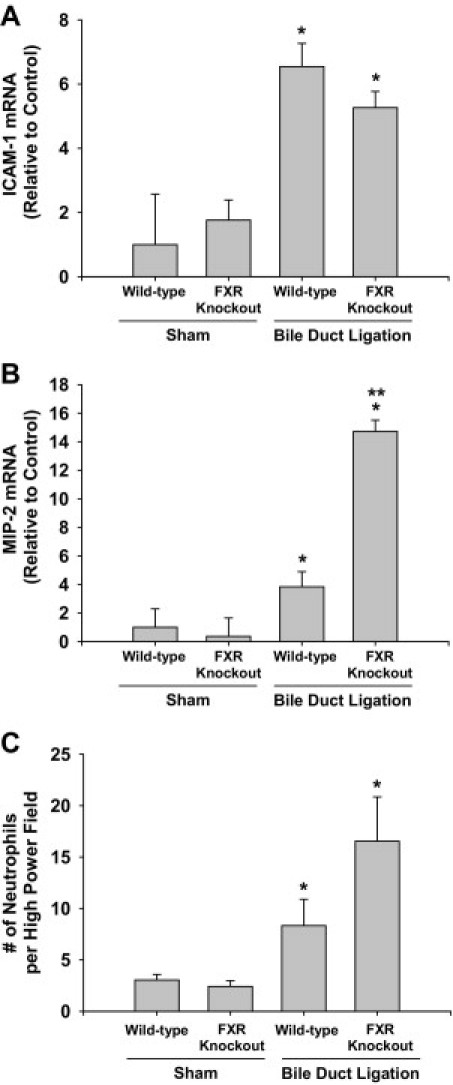
Role of FXR in inflammation in the liver during cholestasis. Wild-type and farnesoid X receptor (FXR) knockout mice were subjected to BDL or sham operation. Three days later, mRNA levels of ICAM-1 (A) and MIP-2 (B) were quantified and hepatic neutrophil accumulation (C) was measured. Values significantly different (*P < 0.05) from sham-operated mice; and significantly different (**P < 0.05) from wild-type mice subjected to BDL.
Up-Regulation of ICAM-1 and MIP-2 in Hepatocytes by Bile Acids Requires Early Growth Response Factor-1
Next, we investigated whether up-regulation of ICAM-1 and MIP-2 requires the transcription factor Egr-1. Exposure of primary mouse hepatocytes to DCA, CDCA, or TCA increased Egr-1 mRNA and protein (Figure 5, A and B). Exposure of hepatocytes isolated from wild-type mice to DCA, CDCA, or TCA increased mRNA and protein levels of ICAM-1 and MIP-2 (Figure 5, C–F). Up-regulation of ICAM-1 and MIP-2 by bile acids was attenuated in hepatocytes isolated from Egr-1 knockout mice (Figure 5, C–F).
Figure 5.
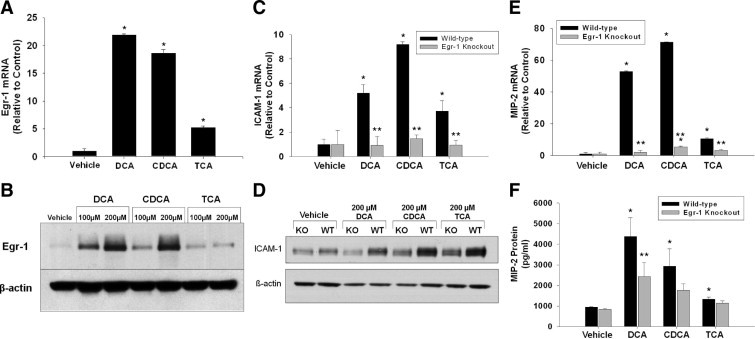
Role of early growth response factor-1 (Egr-1) in up-regulation of ICAM-1 and MIP-2 in hepatocytes. Hepatocytes were isolated from mice and treated with 200 μmol/L DCA, CDCA, or TCA. Two hours later, Egr-1 mRNA (A) and protein (B) were measured. Data are expressed as mean ± SEM; n = 3. Values significantly different (P < 0.05) from vehicle-treated hepatocytes are marked a. Hepatocytes were isolated from wild-type or Egr-1 knockout mice. Six hours later, (C) ICAM-1 and (E) MIP-2 mRNAs were measured. Eight hours later, ICAM-1 (D) and MIP-2 (F) protein levels were measured. Data are expressed as mean ± SEM; n = 3. Values significantly different (*P < 0.05) from vehicle-treated hepatocytes; and significantly different (**P < 0.05) from wild-type hepatocytes treated with bile acids.
Bile Acids Increase Expression of Several Proinflammatory Genes in Hepatocytes by Egr-1-Dependent and -Independent Mechanisms
We next determined whether inflammatory genes other than ICAM-1 and MIP-2 are up-regulated in bile acid-treated hepatocytes in an Egr-1-dependent manner. The genes that were measured are listed in Supplemental Table S1 (see http://www.ajp.amjpathol.org). The results of these studies are summarized in Tables 2, 3, and 4 (only those genes that were increased by bile acid treatment are included in the tables). DCA treatment of hepatocytes isolated from wild-type mice increased mRNA levels of several chemokines, including CXCL1, CXCL10, CXCL11, Ccl2, Ccl5, Ccl7, and Ccl20 (Table 2). In addition, DCA treatment increased mRNA levels of VCAM-1, plasminogen activator inhibitor-1 (PAI-1), urokinase plasminogen activator receptor, and cyclooxygenase-2 (COX-2). Lastly, DCA treatment increased levels of two hematopoietic growth factors, granulocyte macrophage colony stimulating factor (GM-CSF) and granulocyte colony stimulating factor (G-CSF). Of the genes up-regulated by DCA, those encoding CXCL1, Ccl7, PAI-1, and GM-CSF were Egr-1-dependent (Table 2).
Table 2.
Effect of DCA on Proinflammatory Gene Expression in Hepatocytes Isolated from WT Mice and Egr-1 Knockout Mice
| Gene | Other names | Function | WT vehicle | Egr-1 knockout vehicle | WT DCA | Egr-1 knockout DCA |
|---|---|---|---|---|---|---|
| Cxcl1 | KC | Neutrophil chemokine | 1.1 ± 0.2 | 1.1 ± 0.3 | 3.5 ± 0.5⁎ | 1.6 ± 0.4† |
| Cxcl10 | IP-10 | T-cell chemokine | 1.0 ± 0.2 | 1.0 ± 0.2 | 47.0 ± 11.6⁎ | 33.9 ± 14.1⁎ |
| Cxcl11 | I-TAC | T-cell chemokine | 1.2 ± 0.2 | 1.1 ± 0.4 | 16.7 ± 7.7⁎ | 8.1 ± 3.6 |
| Ccl2 | MCP-1 | Monocyte and T-cell chemokine | 1.1 ± 0.2 | 1.0 ± 0.1 | 12.5 ± 1.9⁎ | 8.6 ± 3.7⁎ |
| Ccl5 | RANTES | T-cell, eosinophil, and mast-cell chemokine | 1.0 ± 0.2 | 1.0 ± 0.1 | 3.5 ± 1.1⁎ | 4.4 ± 1.9⁎ |
| Ccl7 | MCP-3 | Monocyte, T-cell, neutrophil, and eosinophil chemokine | 1.1 ± 0.3 | 1.0 ± 0.1 | 9.7 ± 1.1⁎ | 2.7 ± 0.9† |
| Ccl20 | MIP-3α (LARC)‡ | T-cell and B-cell chemokine | 1.2 ± 0.4 | 2.7 ± 2.3 | 6.5 ± 3.5 | 13.1 ± 2.0⁎ |
| Vcam1 | CD106 | Adhesion molecule | 1.0 ± 0.2 | 1.0 ± 0.1 | 7.3 ± 1.36⁎ | 4.6 ± 1.9⁎ |
| Serpine1 | PAI-I | Plasminogen activator inhibitor | 1.0 ± 0.02 | 1.0 ± 0.1 | 4.3 ± 1.0⁎ | 1.0 ± 0.5† |
| Plaur | uPAR | uPA receptor | 1.2 ± 0.1 | 1.0 ± 0.03 | 2.3 ± 0.2⁎ | 2.7 ± 0.2⁎ |
| Ptgs2 | COX-2 | Arachidonic acid metabolism | 1.0 ± 0.2 | 1.0 ± 0.1 | 2.9 ± 0.5⁎ | 2.6 ± 0.9⁎ |
| Csf2 | GM-CSF | Hematopoietic growth factor | 1.2 ± 0.4 | 1.0 ± 0.2 | 6.6 ± 1.0⁎ | 2.4 ± 0.3† |
| Csf3 | G-CSF | Hematopoietic growth factor | 2.1 ± 1.6 | 0.2 ± 0.1 | 2.6 ± 1.0⁎ | 16.6 ± 2.9⁎† |
Primary mouse hepatocytes were isolated from WT or Egr-1 knockout mice and treated with 200 μmol/L DCA. Six hours later, total mRNA was isolated and proinflammatory gene expression measured by quantitative real-time PCR. COX-2, cyclo-oxygenase-2; DCA, deoxycholic acid; uPAR, urokinase plasminogen activator receptor; WT, wild type.
Significantly different (P < 0.05) from vehicle-treated hepatocytes.
Significantly different (P < 0.05) from WT hepatocytes treated with DCA.
Human synonym given in parenthesis.
Table 3.
Effect of CDCA on Proinflammatory Gene Expression in Hepatocytes Isolated from WT Mice and Egr-1 Knockout Mice
| Gene | Other names | Function | WT vehicle | Egr-1 knockout vehicle | WT CDCA | Egr-1 knockout CDCA |
|---|---|---|---|---|---|---|
| Cxcl1 | KC | Neutrophil chemokine | 1.1 ± 0.2 | 1.1 ± 0.3 | 7.1 ± 1.4⁎ | 4.1 ± 1.6⁎ |
| Cxcl10 | IP-10 | T-cell chemokine | 1.0 ± 0.2 | 1.0 ± 0.2 | 92.7 ± 21.4⁎ | 102.1 ± 33.8⁎ |
| Cxcl11 | I-TAC | T-cell chemokine | 1.2 ± 0.2 | 1.1 ± 0.4 | 49.4 ± 14.2⁎ | 44.7 ± 15.0⁎ |
| Cxcl16 | SR-PSOX | T-cell chemokine | 1.0 ± 0.04 | 1.0 ± 0.2 | 3.6 ± 0.2⁎ | 3.7 ± 1.6⁎ |
| Ccl2 | MCP-1 | Monocyte and T-cell chemokine | 1.1 ± 0.2 | 1.0 ± 0.1 | 26.5 ± 1.3⁎ | 20.1 ± 2.8⁎† |
| Ccl3 | MIP-1α | Monocyte and T-cell chemokine | 1.0 ± 0.2 | 1.0 ± 0.2 | 2.1 ± 0.3⁎ | 2.8 ± 0.3⁎ |
| Ccl5 | RANTES | T-cell, eosinophil, and mast cell chemokine | 1.0 ± 0.2 | 1.0 ± 0.1 | 6.5 ± 1.7⁎ | 8.2 ± 3.1⁎ |
| Ccl7 | MCP-3 | Monocyte, T-cell, neutrophil, and eosinophil chemokine | 1.1 ± 0.3 | 1.0 ± 0.1 | 26.1 ± 5.0⁎ | 10.3 ± 4.8⁎† |
| Ccl20 | MIP-3α (LARC)‡ | T-cell and B-cell chemokine | 1.2 ± 0.4 | 2.7 ± 2.3 | 27.2 ± 11.4⁎ | 34.2 ± 8.8⁎ |
| Vcam1 | CD106 | Adhesion molecule | 1.0 ± 0.2 | 1.0 ± 0.1 | 21.9 ± 6.3⁎ | 10.7 ± 4.9⁎ |
| Serpine1 | PAI-1 | Plasminogen activator inhibitor | 1.0 ± 0.02 | 1.0 ± 0.1 | 6.6 ± 1.6⁎ | 3.4 ± 0.1⁎† |
| Plaur | uPAR | uPA receptor | 1.2 ± 0.1 | 1.0 ± 0.03 | 3.9 ± 0.1⁎ | 3.87 ± 0.4⁎ |
| Ptgs2 | COX-2 | Arachidonic acid metabolism | 1.0 ± 0.2 | 1.0 ± 0.1 | 5.1 ± 1.3⁎ | 3.5 ± 1.8⁎ |
| Csf2 | GM-CSF | Hematopoietic growth factor | 1.2 ± 0.4 | 1.0 ± 0.2 | 20.2 ± 4.1⁎ | 4.7 ± 1.5⁎† |
| Csf3 | G-CSF | Hematopoietic growth factor | 2.1 ± 1.6 | 0.2 ± 0.1 | 3.6 ± 1.5⁎ | 6.5 ± 3.5⁎ |
Primary mouse hepatocytes were isolated from WT or Egr-1 knockout mice and treated with 200 μmol/L CDCA. Six hours later, total mRNA was isolated and pro-inflammatory gene expression measured by quantitative real-time PCR. CDCA, chenodeoxycholic acid; COX-2, cyclo-oxygenase-2; uPAR, urokinase plasminogen activator receptor; WT, wild type.
Significantly different (P < 0.05) from vehicle-treated hepatocytes.
Significantly different (P < 0.05) from WT hepatocytes treated with CDCA.
Human synonym given in parenthesis.
Table 4.
Effect of TCA on Proinflammatory Gene Expression in Hepatocytes Isolated from WT Mice and Egr-1 Knockout Mice
| Gene | Other names | Function | WT vehicle | Egr-1 knockout vehicle | WT TCA | Egr-1 knockout TCA |
|---|---|---|---|---|---|---|
| Cxcl1 | KC | Neutrophil chemokine | 1.1 ± 0.2 | 1.1 ± 0.3 | 3.1 ± 0.2⁎ | 1.6 ± 0.2† |
| Cxcl5 | LIX, GCP-2 | Neutrophil chemokine | 1.1 ± 0.4 | 3.5 ± 1.9 | 2.7 ± 0.2 | 10.2 ± 2.6⁎† |
| Cxcl10 | IP-10 | T-cell chemokine | 1.0 ± 0.2 | 1.0 ± 0.2 | 5.18 ± 0.8⁎ | 5.9 ± 0.7⁎ |
| Cxcl11 | I-TAC | T-cell chemokine | 1.2 ± 0.2 | 1.1 ± 0.4 | 5.9 ± 0.9⁎ | 4.9 ± 1.9⁎ |
| Cxcl13 | BLC | B-cell arrest chemokine | 1.2 ± 0.4 | 1.2 ± 0.3 | 4.8 ± 1.1 ⁎ | 1.3 ± 0.2⁎† |
| Cxcl16 | SR-PSOX | T-cell chemokine | 1.0 ± 0.04 | 1.0 ± 0.2 | 1.8 ± 0.2 | 2.0 ± 0.5⁎ |
| Ccl2 | MCP-1 | Monocyte and T-cell chemokine | 1.1 ± 0.2 | 1.0 ± 0.1 | 5.2 ± 0.1⁎ | 3.6 ± 0.5⁎† |
| Ccl3 | MIP-1α | Monocyte and T-cell chemokine | 1.0 ± 0.2 | 1.0 ± 0.2 | 7.3 ± 0.7⁎ | 9.5 ± 1.6⁎ |
| Ccl4 | Mip-1β | T-cell chemokine | 1.1 ± 0.3 | 1.0 ± 0.0 | 7.6 ± 0.6⁎ | 8.9 ± 1.0⁎ |
| Ccl5 | RANTES | T-cell, eosinophil, and mast-cell chemokine | 1.0 ± 0.2 | 1.0 ± 0.1 | 1.6 ± 0.2 | 2.1 ± 0.2⁎ |
| Ccl7 | MCP-3 | Monocyte, T-cell, neutrophil, and eosinophil chemokine | 1.1 ± 0.3 | 1.0 ± 0.1 | 6.5 ± 0.4⁎ | 2.0 ± 0.1⁎† |
| Ccl20 | MIP-3α (LARC)‡ | T-cell and B-cell chemokine | 1.2 ± 0.4 | 2.7 ± 2.3 | 26.8 ± 4.1⁎ | 13.0 ± 0.5⁎† |
| Il1b | IL-1β | Lymphocyte activator, acute phase response | 1.2 ± 0.4 | 1.0 ± 0.1 | 17.6 ± 1.4⁎ | 4.9 ± 1.9⁎† |
| Il10 | IL-10 (CSIF)‡ | Antiinflammatory cytokine | 1.2 ± 0.4 | 1.3 ± 0.5 | 8.2 ± 1.3⁎ | 6.3 ± 0.9⁎ |
| Vcam1 | CD106 | Adhesion molecule | 1.0 ± 0.2 | 1.0 ± 0.1 | 12.0 ± 1.2⁎ | 3.8 ± 1.9⁎† |
| Ptgs2 | COX-2 | Arachidonic acid metabolism | 1.0 ± 0.2 | 1.0 ± 0.1 | 6.9 ± 0.3⁎ | 8.7 ± 1.5⁎ |
| Csf2 | GM-CSF | Hematopoietic growth factor | 1.2 ± 0.4 | 1.0 ± 0.2 | 7.2 ± 1.6⁎ | 2.0 ± 0.7⁎† |
| Csf3 | G-CSF | hematopoietic growth factor | 2.1 ± 1.6 | 0.2 ± 0.1 | 6.0 ± 1.8⁎ | 33.6 ± 5.8⁎ |
Primary mouse hepatocytes were isolated from WT or Egr-1 knockout mice and treated with 200 μmol/L TCA. Six hours later, total mRNA was isolated and pro-inflammatory gene expression measured by quantitative real-time PCR. COX-2, cyclo-oxygenase-2; TCA, taurocholic acid; WT, wild type.
Significantly different (P < 0.05) from vehicle-treated hepatocytes.
Significantly different (P < 0.05) from WT hepatocytes treated with TCA.
Human synonym given in parenthesis.
Exposure of wild-type hepatocytes to CDCA up-regulated all of the same proinflammatory genes as DCA, and in addition increased levels of CXCL16 and Ccl3 (Table 3). CDCA up-regulation of CXCL1, Ccl7, PAI-1, and GM-CSF was partially Egr-1-dependent, similar to DCA (Table 3).
Treatment of wild-type hepatocytes with TCA increased mRNA levels of numerous proinflammatory genes. The profile of mRNA changes was different from the changes that occurred after treatment with the unconjugated bile acids DCA and CDCA. Treatment of hepatocytes with TCA increased mRNA levels of several chemokine genes, including CXCL1, CXCL 5, CXCL10, CXCL11, CXCL13, CXCL16, Ccl2, Ccl3, Ccl4, Ccl5, Ccl7, Ccl20, and also several cytokine genes, including IL-1β and IL-10 (Table 4). In addition, mRNA levels of VCAM-1, COX-2, GM-CSF, and G-CSF genes were increased in hepatocytes after TCA treatment. The increase in Ccl2, Ccl7, Ccl20, IL-1β, VCAM-1, and GM-CSF mRNAs were partially Egr-1-dependent, whereas changes in CXCL1 and CXCL13 were completely Egr-1-dependent (Table 4).
Up-Regulation of PAI-1, VCAM-1, Ccl7, and Snail in the Livers of BDL Mice Requires Egr-1
Next, we determined whether the inflammatory genes that were up-regulated in bile acid-treated hepatocytes in an Egr-1-dependent manner (Tables 2–4), were also increased in BDL mice in an Egr-1-dependent manner. BDL in Egr-1 knockout mice for 10 days resulted in decreased areas of bile infarcts and reduced ALT activity, confirming our previous studies at 14 days after BDL (data not shown).24 BDL increased expression of PAI-1, VCAM-1, and Ccl7 mRNAs to a greater extent in the livers of wild-type mice than in Egr-1 knockout mice (Figure 6, A–C).
Figure 6.
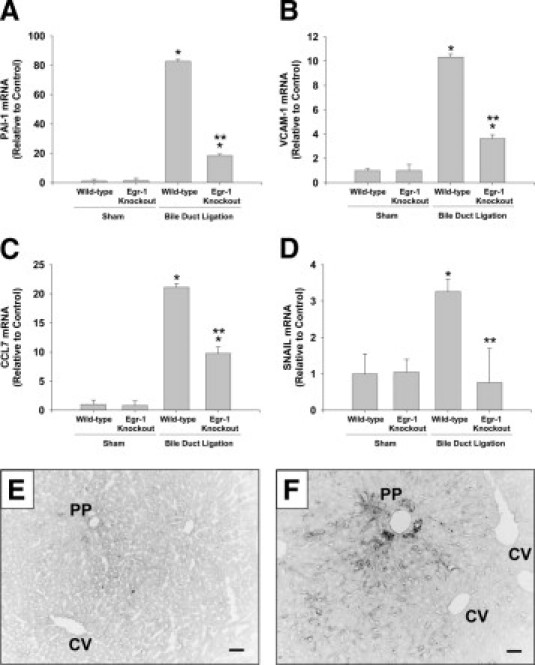
Role of Egr-1 in up-regulation of PAI-1, VCAM-1, CCL7, and SNAIL in the liver during cholestasis. Wild-type and Egr-1 knockout mice were subjected to BDL or sham operation. Seven days later, mRNA levels of PAI-1 (A), VCAM-1 (B), CCL7 (C), and SNAIL (D) were quantified by real-time PCR. Values significantly different (*P < 0.05) from sham-operated mice; and significantly different (**P < 0.05) from wild-type mice subjected to BDL. VCAM-1 protein was detected in sections of liver from sham-operated (E) and BDL (F) mice. Scale bar = 50 μm. PP, periportal zone; CV central vein.
Levels of Snail are increased in bile acid-treated hepatocellular carcinoma cells34 and in the liver after BDL.35 Studies have demonstrated that Egr-1 regulates Snail in some cell types.36 Accordingly, we determined whether up-regulation of Snail in the liver after BDL requires Egr-1. mRNA levels of Snail increased after BDL (Figure 6D). Up-regulation of Snail was completely prevented in Egr-1 knockout mice (Figure 6D).
Minimal immunostaining for VCAM-1 was observed in sham-operated livers (Figure 6E). In liver sections from BDL mice, VCAM-1 immunostaining was observed on bile duct epithelial cells and within the sinusoids, primarily in periportal regions of liver (Figure 6F).
Up-Regulation of Egr-1, PAI-1, ICAM-1, and IL-8 in Livers of Humans with Cholestatic Liver Disease
Human liver was obtained from control donors and from patients with primary biliary cirrhosis or primary sclerosing cholangitis. Levels of Egr-1, PAI-1, ICAM-1, and IL-8 mRNAs were increased in livers of patients with cholestasis from these diseases (Figure 7A). In addition, Spearman correlation indicated a significant correlation between Egr-1 mRNA levels in these patients and mRNA levels of IL-8, PAI-1, and ICAM-1 (Figure 7, B–D).
Figure 7.
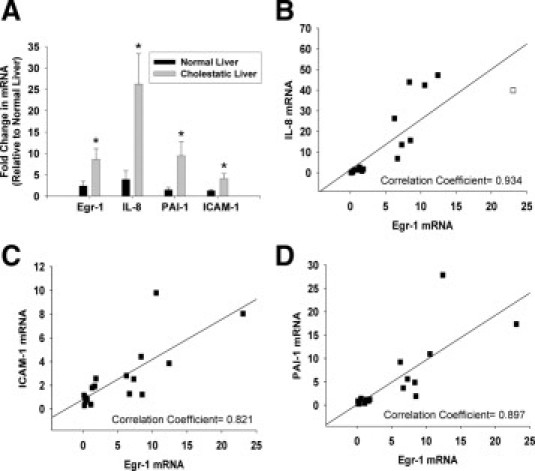
Up-regulation of inflammatory mediators in the livers of humans with cholestatic liver disease. A: Real-time PCR was used to measure mRNA levels of Egr-1, ICAM-1, IL-8, and PAI-1 in normal human livers and in cholestatic livers from patients with primary biliary cirrhosis and primary sclerosing cholangitis. Values significantly different (*P < 0.05) from normal liver. The mRNA levels of IL-8 (B), ICAM-1 (C), and PAI-1 (D) were plotted against mRNA levels of Egr-1. Spearman correlation indicated a significant correlation (specified in each panel) between Egr-1 mRNA levels and mRNA levels of ICAM-1, IL-8, and PAI-1 in normal human livers and liver from patients with cholestatic liver disease at P < 0.05.
Discussion
LPS Does Not Promote Inflammation in the Liver during Acute Phases of Cholestasis
It has been proposed that bacterial LPS may be an important stimulus for inflammation in the liver during cholestasis.37,38 Studies have demonstrated that reduced bile flow increases translocation of bacteria and LPS from the gut, which may stimulate proinflammatory gene expression in the liver.38 In BDL animals, however, up-regulation of inflammatory mediators that affect neutrophil accumulation (eg, MIP-2 and ICAM-1) and hepatic neutrophil accumulation occur within the first 24 hours, whereas plasma LPS levels are not increased at this time.31,37–40 Furthermore, Seki et al27 demonstrated recently that mice deficient in TLR4 (the receptor for LPS) and mice deficient in TLR4 on immune cells are not protected from liver injury after BDL, suggesting that gut-derived LPS is not necessary for neutrophil-dependent injury during cholestasis. Consistent with this report, our present data demonstrate the novel finding that neutrophil accumulation and extravasation in the liver 3 days after BDL is not affected in LPS-resistant C3H/HeJ mice (Figure 1). Collectively, these data suggest that activation of macrophages by LPS, and subsequent release of proinflammatory cytokines such as tumor necrosis factor-α, is not important for the acute phase of inflammation that occurs during cholestasis. Consistent with this finding, tumor necrosis factor-α mRNA levels are not increased in hepatic macrophages at 24 hours after BDL, and depletion of macrophages does not protect from liver injury after BDL.41,42 All together, the present data and these studies suggest that during early stages of cholestasis the activation of hepatic macrophages by LPS from the gut is not important for inflammatory liver injury.
Bile Acid-Induced Hepatocyte Cell Death Is Not a Stimulus for Inflammation in the Liver during Cholestasis
Studies have demonstrated that DAMPs released from necrotic cells, such as high-mobility group box 1 protein, activate macrophages by a TLR4-dependent mechanism that stimulates a sterile inflammatory response.43 This mechanism is important for inflammation in the liver after hepatic ischemia-reperfusion.44 Our results suggest, however, that this mechanism is not responsible for initiation of inflammation in the liver during cholestasis. In BDL mice, serum concentrations of cholic acid and muricholic acid reach approximately 200–250 μmol/L by 7 days after BDL.14 We recently determined that >99% of cholic acid in the serum of BDL mice is conjugated with taurine (Copple, Jaeschke, and Klaassen, unpublished data). In the present studies, exposure of hepatocytes to 200 μmol/L TCA, a concentration that occurs in BDL mice,14 did not produce hepatocyte cell death (Figure 3). Serum concentrations of CDCA and its conjugates increase to approximately 4 μmol/L in BDL mice,14 and in our studies concentrations as high as 200 μmol/L did not produce toxicity in cultured hepatocytes (Figure 3). Similarly, exposure of hepatocytes to 200 μmol/L DCA did not produce toxicity in our studies (Figure 3). Because concentrations of DCA typically decrease during cholestasis,14,15 however, it is unlikely that it contributes to liver toxicity and initiation of inflammation during cholestasis.
We also demonstrated that bile acid-dependent up-regulation of ICAM-1 and MIP-2 was independent of caspase activation (Figure 3). These results are consistent with previous studies in which the pan-caspase inhibitor z-Val-Ala-Asp-fluoromethylketone did not prevent inflammation or attenuate liver injury in BDL mice.45 Collectively, these studies demonstrate that exposure of hepatocytes to bile acids, which increase in serum during cholestasis, do not directly cause cell death and therefore are unlikely to initiate a sterile inflammatory response. Consistent with this finding, inflammation was not affected in TLR4 mutant mice (Figure 1), further supporting the idea that DAMPs released from dead cells are not responsible for initiating inflammation during cholestasis.
Bile Acids Stimulate Production of Inflammatory Mediators by Hepatocytes
Our results indicate that LPS from the gut and DAMPs released from necrotic cells do not stimulate production of proinflammatory cytokines during early stages of cholestasis, suggesting that another mediator triggers inflammation during cholestasis. Furthermore, this other stimulus elicits inflammatory mediator production from cell types other than macrophages, because depletion of macrophages does not attenuate injury after BDL.41,42 Hepatocytes are exposed to high concentrations of bile acids during cholestasis,14,15 and bile acids activate numerous signaling pathways in hepatocytes.29,30,46 We therefore next investigated whether bile acids stimulate production of proinflammatory mediators by hepatocytes. Exposure of hepatocytes to bile acids increased levels of numerous mediators, including cytokines (IL-1β, IL-10), chemokines (KC, IP-10, I-TAC, MCP-1, RANTES, MCP-3, MIP-1α, MIP-1α, MIP-2, MIP-3α, LIX, SR-PSOX, MCP-3, BLC, SR-PSOX), adhesion molecules (ICAM-1, VCAM-1), enzymes in arachidonic acid metabolism (COX-2), and other proteins that influence immune cell levels and function (PAI-1, uPAR, G-CSF, GM-CSF) (Tables 2–4). The concentration of TCA that increased expression of these proinflammatory mediators was similar to concentrations that occur in the serum of BDL mice.
Several of the mediators that were up-regulated by bile acids, including ICAM-1, MIP-2, and KC, are known to be involved in neutrophil trafficking in liver and have been shown to contribute to liver injury during cholestasis.19,31 In addition to neutrophils, studies have shown that T cells and B cells infiltrate the liver during cholestasis.39 Our studies demonstrated that hepatocytes exposed to bile acids may contribute to the chemokine milieu that is responsible for lymphocyte and neutrophil recruitment into the liver. Although systemic chemokine formation may not always contribute to inflammatory liver injury,47,48 a more selective chemokine formation by hepatocytes establishing a chemotactic gradient toward the parenchyma has been shown to trigger neutrophil extravasation and injury.49 Collectively, these results suggest that bile acids at pathological concentrations are inflammatory mediators, and that hepatocytes may be an important source of cytokines and chemokines during cholestasis after exposure to high concentrations of bile acids. In further support of proinflammatory signaling in hepatocytes during cholestasis, recent studies demonstrated that hepatocytes stain positive for the chemokines IL-8, Gro-α, and ENA-78 by immunohistochemistry in the livers of patients with cholestasis.50 In addition, hepatocyte expression of chemokines has been described in animal models of cholestasis.51
Bile Acids Increase Levels of Proinflammatory Mediators in Hepatocytes by Egr-1-Dependent and -Independent Mechanisms
Egr-1-dependent signaling has been shown to enhance inflammation in the vasculature, lungs, and liver.24,52–55 We demonstrated previously that Egr-1 expression increases after BDL, and up-regulation of Egr-1 was dependent on activation of Erk1/2 signaling and occurred independently of FXR activation.24,30 We also demonstrated that Egr-1 knockout mice subjected to BDL exhibited reduced inflammation and liver injury, suggesting a potential role for Egr-1 in regulation of proinflammatory mediator production during cholestasis.24 These studies did not, however, identify the stimulus for up-regulation of Egr-1, nor did they determine the influence of Egr-1 signaling on expression of proinflammatory mediators in hepatocytes. Accordingly, we determined whether bile acids increase cytokine and chemokine expression in hepatocytes by Egr-1-dependent mechanisms. Of the genes that increased in wild-type hepatocytes after exposure to bile acids, those for ICAM-1, MIP-2, CXCL1, CXCL13, Ccl2, Ccl7, IL-1β, PAI-1, G-CSF, GM-CSF, and VCAM-1 (Tables 2–4) were increased in an Egr-1-dependent manner. In addition, we demonstrated that Ccl7, PAI-1, VCAM-1, ICAM-1, and MIP-2 were increased in BDL mice in an Egr-1-dependent manner, consistent with the in vitro studies (Figure 6).24 VCAM-1 protein levels were increased primarily in periportal regions, where intrahepatic bile acid concentrations would expected to be highest (Figure 6F). This is consistent with results in humans with cholestatic liver disease, where VCAM-1 levels were similarly increased in periportal regions of liver.56,57
In addition to findings in mice, our results also demonstrated the novel finding that Egr-1 expression is increased in livers of humans with cholestasis, and that levels of Egr-1 directly correlate with expression of ICAM-1, IL-8 (ie, human homolog of MIP-2 and KC), and PAI-1 (Figure 7). These results suggest that Egr-1 may directly regulate expression of these genes in livers of humans with cholestasis similar to BDL mice. Furthermore, these studies suggest that bile acids may be the stimulus for up-regulation of Egr-1 in the liver during cholestasis.
Recent studies indicated that the bile acid nuclear receptor FXR regulates ICAM-1 in HepG2 cells33 Our results indicate, however, that FXR is not important for up-regulation of ICAM-1 in the liver during cholestasis, nor is it important for hepatic neutrophil accumulation (Figure 4). In contrast, Egr-1 is required for up-regulation of ICAM-1 in the liver during cholestasis, consistent with our in vitro studies (Figure 5).24 Although these results indicate that FXR is not required for inflammation, results from FXR knockout mice need to be interpreted cautiously. FXR knockouts have higher bile acid concentrations and reduced bile duct proliferation after BDL.15,23 In addition, hepatocyte necrosis in FXR knockout mice after BDL is pathologically distinct (ie, less bile infarcts) from wild-type mice.15,23
For many of the genes, increased expression in bile acid-treated hepatocytes occurred independently of Egr-1, suggesting that other signaling pathways are involved. Bile acids have been shown to activate a multitude of signaling pathways in hepatocytes. For example, mitogen-activated protein kinases are activated in bile acid-treated hepatocytes and in livers of BDL mice.30 In addition, bile acids activate various isoforms of the protein kinase C family, p38, c-Jun N-terminal kinase, and pregnane X receptor.46,58–61 It is possible that bile acids stimulate up-regulation of the proinflammatory genes by activation of one or more of these pathways. In support of this concept, studies have shown that activation of c-Jun N-terminal kinase signaling can up-regulate CXCL10 and RANTES in some cell types, and p38 signaling can up-regulate MIP-1α and COX-2 in some cell types.62–64 It seems possible, therefore, that the collective up-regulation of these proinflammatory genes by bile acids may require activation of several signaling pathways; however, further studies are needed to specifically identify which signaling pathways are responsible for up-regulation of each mediator. Although nuclear factor-κB is an important regulator of many of these inflammatory mediators, it is unlikely that nuclear factor-κB contributes to up-regulation of inflammatory mediators in hepatocytes by bile acids, because studies have shown that bile acids do not activate nuclear factor-κB in primary hepatocytes.65
In summary, the present studies have identified a novel mechanism of inflammation in the liver that occurs independently of LPS and TLR4. Furthermore, these studies have identified bile acids as inflammagens that stimulate production of proinflammatory mediators by hepatocytes through Egr-1-dependent and -independent mechanisms that promote neutrophil accumulation, extravasation, and activation (Figure 8). In addition, bile acids stimulate production of cytokines that may promote accumulation of other immune cells, such as T cells that could potentially influence liver pathology during cholestasis. Whereas this signaling network has likely evolved to facilitate repair of the liver during acute episodes of cholestasis, during chronic cholestasis the persistent activation of this inflammatory pathway by bile acids promotes injury. Further identification of the signaling pathways that contribute to activation of this novel inflammatory signaling network in hepatocytes could be useful for the development of drugs that limit inflammation in the liver during cholestasis without affecting vital host defense function of the innate immune response.
Figure 8.
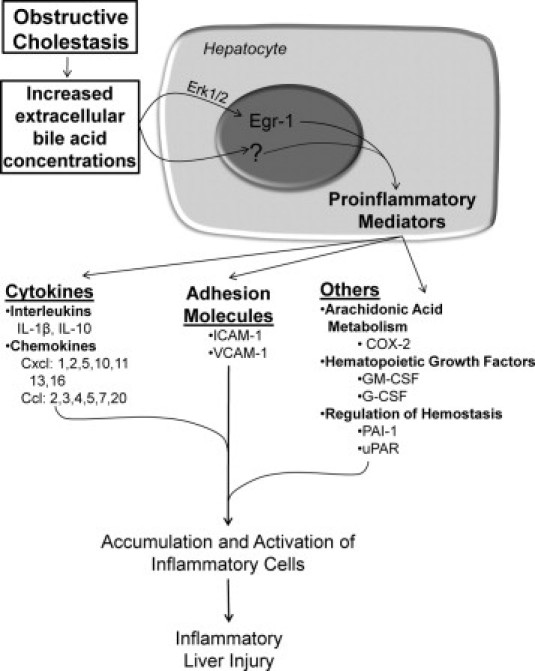
Proposed mechanism of inflammation in the liver during obstructive cholestasis. During obstructive cholestasis, extracellular concentrations of bile acids are increased. Bile acids activate Erk1/2 in hepatocytes which stimulates up-regulation of Egr-1. Egr-1 then regulates production of inflammatory mediators that promote accumulation and activation of inflammatory cells which cause liver injury. Bile acids also up-regulate inflammatory mediators in hepatocytes by an Egr-1-independent mechanism. In addition to hepatocytes, other cell types (not shown) may produce inflammatory mediators that promote inflammatory liver injury during cholestasis.
Acknowledgment
The authors wish to think Erik Schadde, M.D., Richard Gilroy, M.D., Bashar Abdulkarim, M.D., Ph.D., Jameson Forster, M.D., Mojtaba Olyaee, M.D., and Atta M. Nawabi, M.D. for assistance in collecting human liver specimens utilized in this study. The authors wish to thank Natali Navarro-Cazarez and Yvonne Wan, Ph.D. for procuring and preparation of frozen livers.
Footnotes
Supported by NIH grants DK073566 (B.L.C.) and AA12916 (H.J.); by a Center of Biomedical Research Excellence (COBRE) grant P20 RR021940 which supports the Molecular Biology Core and the Histology Core used in these studies, University of Kansas Medical Center; and by NIH grant P20 RR016475 from the National Center for Research Resources.
Supplemental material for this article can be found at http://ajp.amjpathol.org and at doi:10.1016/j.ajpath.2010.11.026.
Supplementary data
Genes Analyzed by qPCR
References
- 1.Li M.K., Crawford J.M. The pathology of cholestasis. Semin Liver Dis. 2004;24:21–42. doi: 10.1055/s-2004-823099. [DOI] [PubMed] [Google Scholar]
- 2.Qureshi W.A. Intrahepatic cholestatic syndromes: pathogenesis, clinical features and management. Dig Dis. 1999;17:49–59. doi: 10.1159/000016903. [DOI] [PubMed] [Google Scholar]
- 3.Setchell K.D., Rodrigues C.M., Clerici C., Solinas A., Morelli A., Gartung C., Boyer J. Bile acid concentrations in human and rat liver tissue and in hepatocyte nuclei. Gastroenterology. 1997;112:226–235. doi: 10.1016/s0016-5085(97)70239-7. [DOI] [PubMed] [Google Scholar]
- 4.Lindblad L., Lundholm K., Schersten T. Bile acid concentrations in systemic and portal serum in presumably normal man and in cholestatic and cirrhotic conditions. Scand J Gastroenterol. 1977;12:395–400. doi: 10.3109/00365527709181679. [DOI] [PubMed] [Google Scholar]
- 5.Gujral J.S., Farhood A., Bajt M.L., Jaeschke H. Neutrophils aggravate acute liver injury during obstructive cholestasis in bile duct-ligated mice. Hepatology. 2003;38:355–363. doi: 10.1053/jhep.2003.50341. [DOI] [PubMed] [Google Scholar]
- 6.Ramadori G., Saile B. Portal tract fibrogenesis in the liver. Lab Invest. 2004;84:153–159. doi: 10.1038/labinvest.3700030. [DOI] [PubMed] [Google Scholar]
- 7.Patel T., Gores G.J. Apoptosis and hepatobiliary disease. Hepatology. 1995;21:1725–1741. doi: 10.1002/hep.1840210635. [DOI] [PubMed] [Google Scholar]
- 8.Guicciardi M.E., Gores G.J. Bile acid-mediated hepatocyte apoptosis and cholestatic liver disease. Dig Liver Dis. 2002;34:387–392. doi: 10.1016/s1590-8658(02)80033-0. [DOI] [PubMed] [Google Scholar]
- 9.Faubion W.A., Guicciardi M.E., Miyoshi H., Bronk S.F., Roberts P.J., Svingen P.A., Kaufmann S.H., Gores G.J. Toxic bile salts induce rodent hepatocyte apoptosis via direct activation of Fas. J Clin Invest. 1999;103:137–145. doi: 10.1172/JCI4765. [DOI] [PMC free article] [PubMed] [Google Scholar]
- 10.Reinehr R., Graf D., Haussinger D. Bile salt-induced hepatocyte apoptosis involves epidermal growth factor receptor-dependent CD95 tyrosine phosphorylation. Gastroenterology. 2003;125:839–853. doi: 10.1016/s0016-5085(03)01055-2. [DOI] [PubMed] [Google Scholar]
- 11.Graf D., Kurz A.K., Fischer R., Reinehr R., Haussinger D. Taurolithocholic acid-3 sulfate induces CD95 trafficking and apoptosis in a c-Jun N-terminal kinase-dependent manner. Gastroenterology. 2002;122:1411–1427. doi: 10.1053/gast.2002.32976. [DOI] [PubMed] [Google Scholar]
- 12.Yang H., Li T.W., Ko K.S., Xia M., Lu S.C. Switch from Mnt-Max to Myc-Max induces p53 and cyclin D1 expression and apoptosis during cholestasis in mouse and human hepatocytes. Hepatology. 2009;49:860–870. doi: 10.1002/hep.22720. [DOI] [PMC free article] [PubMed] [Google Scholar]
- 13.Rodrigues C.M., Fan G., Ma X., Kren B.T., Steer C.J. A novel role for ursodeoxycholic acid in inhibiting apoptosis by modulating mitochondrial membrane perturbation. J Clin Invest. 1998;101:2790–2799. doi: 10.1172/JCI1325. [DOI] [PMC free article] [PubMed] [Google Scholar]
- 14.Marschall H.U., Wagner M., Bodin K., Zollner G., Fickert P., Gumhold J., Silbert D., Fuchsbichler A., Sjovall J., Trauner M. Fxr(−/−) mice adapt to biliary obstruction by enhanced phase I detoxification and renal elimination of bile acids. J Lipid Res. 2006;47:582–592. doi: 10.1194/jlr.M500427-JLR200. [DOI] [PubMed] [Google Scholar]
- 15.Wagner M., Fickert P., Zollner G., Fuchsbichler A., Silbert D., Tsybrovskyy O., Zatloukal K., Guo G.L., Schuetz J.D., Gonzalez F.J., Marschall H.U., Denk H., Trauner M. Role of farnesoid X receptor in determining hepatic ABC transporter expression and liver injury in bile duct-ligated mice. Gastroenterology. 2003;125:825–838. doi: 10.1016/s0016-5085(03)01068-0. [DOI] [PubMed] [Google Scholar]
- 16.Burkard I., von Eckardstein A., Rentsch K.M. Differentiated quantification of human bile acids in serum by high-performance liquid chromatography-tandem mass spectrometry. J Chromatogr B Analyt Technol Biomed Life Sci. 2005;826:147–159. doi: 10.1016/j.jchromb.2005.08.016. [DOI] [PubMed] [Google Scholar]
- 17.Sokol R.J., Winklhofer-Roob B.M., Devereaux M.W., McKim J.M., Jr Generation of hydroperoxides in isolated rat hepatocytes and hepatic mitochondria exposed to hydrophobic bile acids. Gastroenterology. 1995;109:1249–1256. doi: 10.1016/0016-5085(95)90585-5. [DOI] [PubMed] [Google Scholar]
- 18.Copple B.L., Jaeschke H., Klaassen C.D. Oxidative stress and the pathogenesis of cholestasis. Semin Liver Dis. 2010;30:195–204. doi: 10.1055/s-0030-1253228. [DOI] [PubMed] [Google Scholar]
- 19.Gujral J.S., Liu J., Farhood A., Hinson J.A., Jaeschke H. Functional importance of ICAM-1 in the mechanism of neutrophil-induced liver injury in bile duct-ligated mice. Am J Physiol Gastrointest Liver Physiol. 2004;286:G499–G507. doi: 10.1152/ajpgi.00318.2003. [DOI] [PubMed] [Google Scholar]
- 20.Neuman M., Angulo P., Malkiewicz I., Jorgensen R., Shear N., Dickson E.R., Haber J., Katz G., Lindor K. Tumor necrosis factor-alpha and transforming growth factor-beta reflect severity of liver damage in primary biliary cirrhosis. J Gastroenterol Hepatol. 2002;17:196–202. doi: 10.1046/j.1440-1746.2002.02672.x. [DOI] [PubMed] [Google Scholar]
- 21.Yamashiki M., Kosaka Y., Nishimura A., Watanabe S., Nomoto M., Ichida F. Analysis of serum cytokine levels in primary biliary cirrhosis patients and healthy adults. J Clin Lab Anal. 1998;12:77–82. doi: 10.1002/(SICI)1098-2825(1998)12:2<77::AID-JCLA1>3.0.CO;2-G. [DOI] [PMC free article] [PubMed] [Google Scholar]
- 22.Gulubova M.V. Intercellular adhesion molecule-1 (ICAM-1) expression in the liver of patients with extrahepatic cholestasis. Acta Histochem. 1998;100:59–74. doi: 10.1016/s0065-1281(98)80006-8. [DOI] [PubMed] [Google Scholar]
- 23.Sinal C.J., Tohkin M., Miyata M., Ward J.M., Lambert G., Gonzalez F.J. Targeted disruption of the nuclear receptor FXR/BAR impairs bile acid and lipid homeostasis. Cell. 2000;102:731–744. doi: 10.1016/s0092-8674(00)00062-3. [DOI] [PubMed] [Google Scholar]
- 24.Kim N.D., Moon J.O., Slitt A.L., Copple B.L. Early growth response factor-1 is critical for cholestatic liver injury. Toxicol Sci. 2006;90:586–595. doi: 10.1093/toxsci/kfj111. [DOI] [PubMed] [Google Scholar]
- 25.Copple B.L., Bustamante J.J., Welch T.P., Kim N.D., Moon J.O. Hypoxia-inducible factor-dependent production of profibrotic mediators by hypoxic hepatocytes. Liver Int. 2009;29:1010–1021. doi: 10.1111/j.1478-3231.2009.02015.x. [DOI] [PMC free article] [PubMed] [Google Scholar]
- 26.Poltorak A., He X., Smirnova I., Liu M.Y., Van Huffel C., Du X., Birdwell D., Alejos E., Silva M., Galanos C., Freudenberg M., Ricciardi-Castagnoli P., Layton B., Beutler B. Defective LPS signaling in C3H/HeJ and C57BL/10ScCr mice: mutations in Tlr4 gene. Science. 1998;282:2085–2088. doi: 10.1126/science.282.5396.2085. [DOI] [PubMed] [Google Scholar]
- 27.Seki E., De Minicis S., Osterreicher C.H., Kluwe J., Osawa Y., Brenner D.A., Schwabe R.F. TLR4 enhances TGF-beta signaling and hepatic fibrosis. Nat Med. 2007;13:1324–1332. doi: 10.1038/nm1663. [DOI] [PubMed] [Google Scholar]
- 28.Qiao L., Studer E., Leach K., McKinstry R., Gupta S., Decker R., Kukreja R., Valerie K., Nagarkatti P., El Deiry W., Molkentin J., Schmidt-Ullrich R., Fisher P.B., Grant S., Hylemon P.B., Dent P. Deoxycholic acid (DCA) causes ligand-independent activation of epidermal growth factor receptor (EGFR) and FAS receptor in primary hepatocytes: inhibition of EGFR/mitogen-activated protein kinase-signaling module enhances DCA-induced apoptosis. Mol Biol Cell. 2001;12:2629–2645. doi: 10.1091/mbc.12.9.2629. [DOI] [PMC free article] [PubMed] [Google Scholar]
- 29.Dent P., Fang Y., Gupta S., Studer E., Mitchell C., Spiegel S., Hylemon P.B. Conjugated bile acids promote ERK1/2 and AKT activation via a pertussis toxin-sensitive mechanism in murine and human hepatocytes. Hepatology. 2005;42:1291–1299. doi: 10.1002/hep.20942. [DOI] [PubMed] [Google Scholar]
- 30.Allen K., Kim N.D., Moon J.O., Copple B.L. Upregulation of early growth response factor-1 by bile acids requires mitogen-activated protein kinase signaling. Toxicol Appl Pharmacol. 2010;243:63–67. doi: 10.1016/j.taap.2009.11.013. [DOI] [PMC free article] [PubMed] [Google Scholar]
- 31.Wintermeyer P., Cheng C.W., Gehring S., Hoffman B.L., Holub M., Brossay L., Gregory S.H. Invariant natural killer T cells suppress the neutrophil inflammatory response in a mouse model of cholestatic liver damage. Gastroenterology. 2009;136:1048–1059. doi: 10.1053/j.gastro.2008.10.027. [DOI] [PMC free article] [PubMed] [Google Scholar]
- 32.Canbay A., Feldstein A.E., Higuchi H., Werneburg N., Grambihler A., Bronk S.F., Gores G.J. Kupffer cell engulfment of apoptotic bodies stimulates death ligand and cytokine expression. Hepatology. 2003;38:1188–1198. doi: 10.1053/jhep.2003.50472. [DOI] [PubMed] [Google Scholar]
- 33.Qin P., Borges-Marcucci L.A., Evans M.J., Harnish D.C. Bile acid signaling through FXR induces intracellular adhesion molecule-1 expression in mouse liver and human hepatocytes. Am J Physiol Gastrointest Liver Physiol. 2005;289:G267–G273. doi: 10.1152/ajpgi.00043.2005. [DOI] [PubMed] [Google Scholar]
- 34.Fukase K., Ohtsuka H., Onogawa T., Oshio H., Ii T., Mutoh M., Katayose Y., Rikiyama T., Oikawa M., Motoi F., Egawa S., Abe T., Unno M. Bile acids repress E-cadherin through the induction of Snail and increase cancer invasiveness in human hepatobiliary carcinoma. Cancer Sci. 2008;99:1785–1792. doi: 10.1111/j.1349-7006.2008.00898.x. [DOI] [PMC free article] [PubMed] [Google Scholar]
- 35.Zhong W., Shen W.F., Ning B.F., Hu P.F., Lin Y., Yue H.Y., Yin C., Hou J.L., Chen Y.X., Zhang J.P., Zhang X., Xie W.F. Inhibition of extracellular signal-regulated kinase 1 by adenovirus mediated small interfering RNA attenuates hepatic fibrosis in rats. Hepatology. 2009;50:1524–1536. doi: 10.1002/hep.23189. [DOI] [PubMed] [Google Scholar]
- 36.Grotegut S., von Schweinitz D., Christofori G., Lehembre F. Hepatocyte growth factor induces cell scattering through MAPK/Egr-1-mediated upregulation of Snail. EMBO J. 2006;25:3534–3545. doi: 10.1038/sj.emboj.7601213. [DOI] [PMC free article] [PubMed] [Google Scholar]
- 37.Van Bossuyt H., Desmaretz C., Gaeta G.B., Wisse E. The role of bile acids in the development of endotoxemia during obstructive jaundice in the rat. J Hepatol. 1990;10:274–279. doi: 10.1016/0168-8278(90)90132-b. [DOI] [PubMed] [Google Scholar]
- 38.Reynolds J.V., Murchan P., Leonard N., Clarke P., Keane F.B., Tanner W.A. Gut barrier failure in experimental obstructive jaundice. J Surg Res. 1996;62:11–16. doi: 10.1006/jsre.1996.0165. [DOI] [PubMed] [Google Scholar]
- 39.Georgiev P., Jochum W., Heinrich S., Jang J.H., Nocito A., Dahm F., Clavien P.A. Characterization of time-related changes after experimental bile duct ligation. Br J Surg. 2008;95:646–656. doi: 10.1002/bjs.6050. [DOI] [PubMed] [Google Scholar]
- 40.Gong J.P., Wu C.X., Liu C.A., Li S.W., Shi Y.J., Li X.H., Peng Y. Liver sinusoidal endothelial cell injury by neutrophils in rats with acute obstructive cholangitis. World J Gastroenterol. 2002;8:342–345. doi: 10.3748/wjg.v8.i2.342. [DOI] [PMC free article] [PubMed] [Google Scholar]
- 41.Gehring S., Dickson E.M., San Martin M.E., van Rooijen N., Papa E.F., Harty M.W., Tracy T.F., Jr, Gregory S.H. Kupffer cells abrogate cholestatic liver injury in mice. Gastroenterology. 2006;130:810–822. doi: 10.1053/j.gastro.2005.11.015. [DOI] [PubMed] [Google Scholar]
- 42.Zhong Z., Froh M., Lehnert M., Schoonhoven R., Yang L., Lind H., Lemasters J.J., Thurman R.G. Polyphenols from Camellia sinensis attenuate experimental cholestasis-induced liver fibrosis in rats. Am J Physiol Gastrointest Liver Physiol. 2003;285:G1004–G1013. doi: 10.1152/ajpgi.00008.2003. [DOI] [PubMed] [Google Scholar]
- 43.Park J.S., Gamboni-Robertson F., He Q., Svetkauskaite D., Kim J.Y., Strassheim D., Sohn J.W., Yamada S., Maruyama I., Banerjee A., Ishizaka A., Abraham E. High mobility group box 1 protein interacts with multiple Toll-like receptors. Am J Physiol Cell Physiol. 2006;290:C917–C924. doi: 10.1152/ajpcell.00401.2005. [DOI] [PubMed] [Google Scholar]
- 44.Tsung A., Sahai R., Tanaka H., Nakao A., Fink M.P., Lotze M.T., Yang H., Li J., Tracey K.J., Geller D.A., Billiar T.R. The nuclear factor HMGB1 mediates hepatic injury after murine liver ischemia-reperfusion. J Exp Med. 2005;201:1135–1143. doi: 10.1084/jem.20042614. [DOI] [PMC free article] [PubMed] [Google Scholar]
- 45.Gujral J.S., Liu J., Farhood A., Jaeschke H. Reduced oncotic necrosis in Fas receptor-deficient C57BL/6J-lpr mice after bile duct ligation. Hepatology. 2004;40:998–1007. doi: 10.1002/hep.20380. [DOI] [PubMed] [Google Scholar]
- 46.Makishima M., Okamoto A.Y., Repa J.J., Tu H., Learned R.M., Luk A., Hull M.V., Lustig K.D., Mangelsdorf D.J., Shan B. Identification of a nuclear receptor for bile acids. Science. 1999;284:1362–1365. doi: 10.1126/science.284.5418.1362. [DOI] [PubMed] [Google Scholar]
- 47.Dorman R.B., Gujral J.S., Bajt M.L., Farhood A., Jaeschke H. Generation and functional significance of CXC chemokines for neutrophil-induced liver injury during endotoxemia. Am J Physiol Gastrointest Liver Physiol. 2005;288:G880–G886. doi: 10.1152/ajpgi.00317.2004. [DOI] [PubMed] [Google Scholar]
- 48.Simonet W.S., Hughes T.M., Nguyen H.Q., Trebasky L.D., Danilenko D.M., Medlock E.S. Long-term impaired neutrophil migration in mice overexpressing human interleukin-8. J Clin Invest. 1994;94:1310–1319. doi: 10.1172/JCI117450. [DOI] [PMC free article] [PubMed] [Google Scholar]
- 49.Maher J.J., Scott M.K., Saito J.M., Burton M.C. Adenovirus-mediated expression of cytokine-induced neutrophil chemoattractant in rat liver induces a neutrophilic hepatitis. Hepatology. 1997;25:624–630. doi: 10.1002/hep.510250322. [DOI] [PubMed] [Google Scholar]
- 50.Dominguez M., Miquel R., Colmenero J., Moreno M., Garcia-Pagán J.C., Bosch J., Arroyo V., Gines P., Caballeria J., Bataller R. Hepatic expression of CXC chemokines predicts portal hypertension and survival in patients with alcoholic hepatitis. Gastroenterology. 2009;136:1639–1650. doi: 10.1053/j.gastro.2009.01.056. [DOI] [PubMed] [Google Scholar]
- 51.Xu J., Lee G., Wang H., Vierling J.M., Maher J.J. Limited role for CXC chemokines in the pathogenesis of alpha-naphthylisothiocyanate-induced liver injury. Am J Physiol Gastrointest Liver Physiol. 2004;287:G734–G741. doi: 10.1152/ajpgi.00300.2003. [DOI] [PMC free article] [PubMed] [Google Scholar]
- 52.Yan S.F., Fujita T., Lu J., Okada K., Shan Zou Y., Mackman N., Pinsky D.J., Stern D.M. Egr-1, a master switch coordinating upregulation of divergent gene families underlying ischemic stress [Erratum appeared in Nat Med 2001;7:509] Nat Med. 2000;6:1355–1361. doi: 10.1038/82168. [DOI] [PubMed] [Google Scholar]
- 53.Harja E., Bucciarelli L.G., Lu Y., Stern D.M., Zou Y.S., Schmidt A.M., Yan S.F. Early growth response-1 promotes atherogenesis: mice deficient in early growth response-1 and apolipoprotein E display decreased atherosclerosis and vascular inflammation. Circ Res. 2004;94:333–339. doi: 10.1161/01.RES.0000112405.61577.95. [DOI] [PubMed] [Google Scholar]
- 54.Pritchard M.T., Roychowdhury S., McMullen M.R., Guo L., Arteel G.E., Nagy L.E. Early growth response-1 contributes to galactosamine/lipopolysaccharide-induced acute liver injury in mice. Am J Physiol Gastrointest Liver Physiol. 2007;293:G1124–G1133. doi: 10.1152/ajpgi.00325.2007. [DOI] [PubMed] [Google Scholar]
- 55.McMullen M.R., Pritchard M.T., Wang Q., Millward C.A., Croniger C.M., Nagy L.E. Early growth response-1 transcription factor is essential for ethanol-induced fatty liver injury in mice. Gastroenterology. 2005;128:2066–2076. doi: 10.1053/j.gastro.2005.02.065. [DOI] [PMC free article] [PubMed] [Google Scholar]
- 56.Yasoshima M., Nakanuma Y., Tsuneyama K., Van de Water J., Gershwin M.E. Immunohistochemical analysis of adhesion molecules in the micro-environment of portal tracts in relation to aberrant expression of PDC-E2 and HLA-DR on the bile ducts in primary biliary cirrhosis. J Pathol. 1995;175:319–325. doi: 10.1002/path.1711750310. [DOI] [PubMed] [Google Scholar]
- 57.Medina J., Sanz-Cameno P., García-Buey L., Martín-Vílchez S., López-Cabrera M., Moreno-Otero R. Evidence of angiogenesis in primary biliary cirrhosis: an immunohistochemical descriptive study. J Hepatol. 2005;42:124–131. doi: 10.1016/j.jhep.2004.09.024. [DOI] [PubMed] [Google Scholar]
- 58.Gupta S., Stravitz R.T., Dent P., Hylemon P.B. Down-regulation of cholesterol 7alpha-hydroxylase (CYP7A1) gene expression by bile acids in primary rat hepatocytes is mediated by the c-Jun N-terminal kinase pathway. J Biol Chem. 2001;276:15816–15822. doi: 10.1074/jbc.M010878200. [DOI] [PubMed] [Google Scholar]
- 59.Rao Y.P., Stravitz R.T., Vlahcevic Z.R., Gurley E.C., Sando J.J., Hylemon P.B. Activation of protein kinase C alpha and delta by bile acids: correlation with bile acid structure and diacylglycerol formation. J Lipid Res. 1997;38:2446–2454. [PubMed] [Google Scholar]
- 60.Staudinger J.L., Goodwin B., Jones S.A., Hawkins-Brown D., MacKenzie K.I., LaTour A., Liu Y., Klaassen C.D., Brown K.K., Reinhard J., Willson T.M., Koller B.H., Kliewer S.A. The nuclear receptor PXR is a lithocholic acid sensor that protects against liver toxicity. Proc Natl Acad Sci USA. 2001;98:3369–3374. doi: 10.1073/pnas.051551698. [DOI] [PMC free article] [PubMed] [Google Scholar]
- 61.Kurz A.K., Graf D., Schmitt M., Vom Dahl S., Haussinger D. Tauroursodesoxycholate-induced choleresis involves p38(MAPK) activation and translocation of the bile salt export pump in rats. Gastroenterology. 2001;121:407–419. doi: 10.1053/gast.2001.26262. [DOI] [PubMed] [Google Scholar]
- 62.Park C., Lee S., Cho I.H., Lee H.K., Kim D., Choi S.Y., Oh S.B., Park K., Kim J.S., Lee S.J. TLR3-mediated signal induces proinflammatory cytokine and chemokine gene expression in astrocytes: differential signaling mechanisms of TLR3-induced IP-10 and IL-8 gene expression. Glia. 2006;53:248–256. doi: 10.1002/glia.20278. [DOI] [PubMed] [Google Scholar]
- 63.Hiura T.S., Kempiak S.J., Nel A.E. Activation of the human RANTES gene promoter in a macrophage cell line by lipopolysaccharide is dependent on stress-activated protein kinases and the IkappaB kinase cascade: implications for exacerbation of allergic inflammation by environmental pollutants. Clin Immunol. 1999;90:287–301. doi: 10.1006/clim.1998.4659. [DOI] [PubMed] [Google Scholar]
- 64.Adachi T., Choudhury B.K., Stafford S., Sur S., Alam R. The differential role of extracellular signal-regulated kinases and p38 mitogen-activated protein kinase in eosinophil functions. J Immunol. 2000;165:2198–2204. doi: 10.4049/jimmunol.165.4.2198. [DOI] [PubMed] [Google Scholar]
- 65.Schoemaker M.H., Gommans W.M., Conde de la Rosa L., Homan M., Klok P., Trautwein C., van Goor H., Poelstra K., Haisma H.J., Jansen P.L., Moshage H. Resistance of rat hepatocytes against bile acid-induced apoptosis in cholestatic liver injury is due to nuclear factor-kappa B activation. J Hepatol. 2003;39:153–161. doi: 10.1016/s0168-8278(03)00214-9. [DOI] [PubMed] [Google Scholar]
Associated Data
This section collects any data citations, data availability statements, or supplementary materials included in this article.
Supplementary Materials
Genes Analyzed by qPCR