

Abstract
Objective
To assess the impact of diabetic retinopathy (DR) and its severity on health-related quality of life (HRQOL) in a population-based sample of Latinos with type 2 diabetes mellitus.
Design
Cross-sectional population-based study, the Los Angeles Latino Eye Study (LALES).
Participants
1,064 LALES participants with diabetes mellitus.
Methods
HRQOL was measured by the 25 item National Eye Institute Visual Function Questionnaire (NEI-VFQ-25) and the Medical Outcomes Study 12-Item Short Form Health Survey (SF-12). DR was assessed by masked standardized grading of stereoscopic photographs from 7 standard fields. Severity of DR in eyes was graded using a modified Airlie House classification. The severity scores from each eye were then concatenated to create a single per person grade ranging from 1(no DR in either eye) to 15 (bilateral PDR). Multiple linear regression analyses were performed to determine the independent relationship between severity of DR and HRQOL after adjusting for covariates.
Main Outcome Measures
NEI-VFQ-25 and SF-12 scores.
Results
More severe DR was associated with worse HRQOL scores on all of the NEI VFQ-25 and SF-12 subscales (P<0.05). Individuals with DR from grade 2 (minimum NPDR) through grade 8 (unilateral moderate NPDR) show a modest decline in HRQOL. However, the decline become significantly steeper between steps 8 (unilateral moderate NPDR) and 9-15 (bilateral moderate NPDR to bilateral PDR). The domains with the most significant impact were for vision-related daily activities, dependency and mental health.
Conclusion
Greater severity of DR was associated with lower general and vision-specific HRQOL. Persons with bilateral moderate NPDR had the most substantial decrease in quality of life compared to those with less severe DR. The prevention of incident DR and more importantly its progression from unilateral to bilateral NPDR is likely to have a positive impact on a person’s HRQOL and should be considered an important goal in management of individuals with diabetes mellitus.
INTRODUCTION
Diabetic retinopathy (DR) is a serious microvascular complication of diabetes and is one of the leading causes of blindness in the United States (U.S.) for persons 20–74 years of age.1 Among the estimated 10 million adults in the United States over the age of 40 years with type 2 diabetes mellitus (T2DM), approximately 40% have been diagnosed with DR and 8% have had vision-threatening retinopathy.2,3 In the U.S. Latinos have a higher prevalence of diabetes mellitus (DM) and its related complications when compared to non-Hispanic Whites and African Americans. DR is a leading cause of low vision and blindness, with higher prevalence reported in U.S. Latinos compared to other racial/ethnic groups.4–7
Diabetic retinopathy has been associated with both qualitative and quantitative losses in health-related quality of life (HRQOL).2 Diabetic retinopathy can result in vision impairment, which in turn has been linked to reduced physical activity, dependency in activities of daily living and social isolation.8–12 The impact of DR on visual function has been evaluated in several studies using different instruments to evaluate HRQOL. While recent studies have demonstrated reduction in HRQOL in persons with DR,13–17 the impact of severity of DR on patients’ visual function has not been well documented. With many treatments now available for the management of DR, the impact of increasing severity of DR on HRQOL may help to inform the clinician’s decision on when to begin treatment and in monitoring treatment response.
The Los Angeles Latino Eye Study (LALES) is a population-based cohort study designed to study the prevalence and incidence of ocular disease in adult Latinos, to evaluate risk indicators of ocular disease, and to measure the impact of ocular disease on HRQOL. The objectives of the current analyses are to examine the association between DR and HRQOL as measured by the National Eye Institute Vision Specific Questionnaire (NEI-VFQ-25) and Short Form 12-item Health Survey (SF-12), and to evaluate the relationship between severity of DR and HRQOL.
METHODS
Design and Sample
The data for these analyses was collected as part of a population-based cohort study of adults. Details of the study design, sampling plan, and baseline data have been previously reported.18 In brief, a door-to-door census of all residents living within 6 census tracts in La Puente, California was conducted between February 2000 and May 2003 to identify eligible individuals. Demographic and socioeconomic characteristics of Latinos in the 6 census tracts of La Puente were similar to those of the Latino populations in Los Angeles County. All eligible participants (40 years or older at the time of the census and self-identified as Latino) were informed of the study and invited to participate in both a home interview and a clinical eye examination. Institutional Review Board (IRB) approval was obtained from the Los Angeles County/University of Southern California Medical Center Institutional Review Board. All study procedures adhere to the principles outlined in the Declaration of Helsinki for research involving human subjects.
Socio-demographic and Clinical Data
After informed consent was obtained, an in-home interview was conducted to obtain demographic information, history of ocular and medical conditions, access to care, acculturation, and insurance status.19 Operational definitions for these variables paralleled those used in the Hispanic Health and Nutrition Examination Survey.20,21 Acculturation was measured using the short-form Cuellar Acculturation Scale,21 with scale scores ranging from 1 to 5 (5 representing the highest level of acculturation). The systemic co-morbidity summation score was used to measure 12 self-reported medical conditions, including diabetes mellitus, arthritis, stroke or brain hemorrhage, high blood pressure, angina, heart attack, heart failure, asthma, skin cancer, other cancers, back problems, and deafness or hearing problems.22–24 A subsequent detailed eye examination was performed in a standardized manner at the LALES Local Eye Examination Center.18
Clinical Procedures
The clinical procedures have been previously described in detail.6 A random blood glucose and glycosylated hemoglobin were measured for purposes of identifying participants with diabetes using the Hemocue B-Glucose Analyzer (Hemocue Inc., Lake Forest, CA) and the DCA 2000+ System (Bayer Corporation, Tarrytown, NY), respectively. Participants were identified as having diabetes (see definition below) before obtaining fundus photographs. All persons who were identified as having diabetes underwent stereoscopic photography of 7 standard Early Treatment Diabetic Retinopathy Study fields of the fundus for each eye after maximal dilation with the Topcon TRC 50EX Retinal Camera (Topcon Corporation of America, Paramus, NJ) using Kodak (Rochester, NY) Ektachrome 100 film. The fields were as follows: field 1, the center of the optic disc; field 2, the center of the macula; field 3, temporal to the macula; field 4, temporal superior; field 5, temporal inferior; field 6, nasal superior; and field 7, nasal inferior. The fundus photographs were graded in a masked manner at the Ocular Epidemiology Grading Center at the University of Wisconsin, Madison, Wisconsin.
Definition of Diabetes
A participant was considered to have definite diabetes mellitus if any of the following criteria were met6: (i) had a history of diabetes and was being treated with oral hypoglycemic medications, insulin, or diet alone; (ii) hemoglobin A1c was measured at 7.0% or higher; or (iii) had a random blood glucose of 200 mg/100 ml or higher. If the participant was diagnosed with diabetes before 30 years of age and was receiving insulin therapy then the diabetes was considered as Type I diabetes. Otherwise, the diabetes was considered to be Type II.
Definition and Grading of Diabetic Retinopathy
Diabetic retinopathy was defined as retinopathy consistent with diabetic disease in persons with definite diabetes mellitus. Grading protocols for DR were modifications of the Early Treatment Diabetic Retinopathy Study (ETDRS) adaptation of the modified Airlie House classification of DR.6 For each eye, the maximum grade in any of the seven standard photographic fields was determined for each of the lesions. Eyes were graded according to the following criteria: (i) no DR (levels 10 through 13), or (ii) any DR (levels 14 through 85). Diabetic retinopathy was then classified as (i) no DR (levels 10 through 13); (ii) unilateral or bilateral non-proliferative DR (NPDR; levels 14 through 53); or (iii) unilateral or bilateral proliferative DR (PDR; levels 60 through 85). Levels of DR for a participant was derived using method previously described by Klein et al.25 In brief, the severity of DR for a participant was derived by combining the severity levels for each eye but giving greater weight to the eye with higher level. This resulted in a 15-step scale; (10/10, 21/<21, 21/21, 31/<31, 31/31, 37/<37, 37/37, 43/<43, 43/43, 47/<47, 47/47, 53/<53, 53/53, ≥60/<60, ≥60/≥60). If the severity of retinopathy could not be graded in one of the eyes, the individual was considered to have a score equivalent to that in the other eye. Photographs underwent a preliminary and detailed grading for the presence of DR and its severity. Any discrepancy between gradings was evaluated by senior grader. If discrepancies still existed after 3 gradings, the case was adjudicated by a senior ophthalmologist (RK). The weighted Kappa (κ) statistics, calculated for inter-grader and intra-grader were κ = 0.70 and k=51 to 0.81, respectively.
Assessment of Health Related Quality of Life
HRQOL was evaluated using general and vision-specific instruments. Interviewers administered the questionnaires in either English or Spanish (according to participant preference) prior to the clinical examination at the LALES Local Eye Examination Center. General HRQOL was assessed by the Short Form 12-item Health Survey (SF-12), version 1.26 The standard U.S. norm-based SF-12 Physical Component Summary (PCS) and Mental Component Summary (MCS) scores were calculated,27 where higher scores represent better HRQOL. Self-reported vision-related HRQOL was assessed by the National Eye Institute Visual Function Questionnaire (NEI-VFQ-25),13,28 a disease-targeted set of measures designed to complement SF-12 by focusing on aspects of HRQOL particularly relevant to visually impaired adults, regardless of the cause of visual disability.13,29 The NEI-VFQ-25 is composed of 12 vision-targeted scales: general vision, general health, near and distance vision activities, ocular pain, vision-related social function, vision-related role function, vision-related mental health, vision-related dependency, driving difficulties, color vision, and peripheral vision. The standard algorithm was used to calculate the scale scores, which have a possible range from 0 to 100. Eleven of the 12 scale scores (excluding the general health rating question) were averaged to yield a composite score,28 where higher scores represent better visual functioning and well-being.
Statistical Analyses
To contrast socio-demographic factors across subgroups defined by status of DR (DR versus no DR), t-test were used for continuous variables and chi-square analyses were used for discrete variables. Wilcoxon rank sum test was used to compare the median HRQOL score by status of DR. Regression analyses was used to evaluate the potential linear relationship between HRQOL and severity of DR. Covariates associated with visual functioning and well-being such as: age, gender, education, employment status, income, acculturation, co-morbidities, health insurance, and vision insurance were included in the model.30, 31 Due to the non-normal distribution of HRQOL scores, a logarithmic transformation was performed to approximate the normal distribution during analysis and back transformed for reporting the results. Differences in HRQOL with relation to DR severity were evaluated using two approaches, (i) traditional approach, to examine HRQOL across the traditional five groups of DR (no DR, mild NPDR, moderate NPDR, severe NPDR and PDR6, 32 and, (ii) novel approach, to examine HRQOL across the 15 levels concatenated scale of DR severity as described by Klein et al.25 To examine the possible non-linear independent relationship between severity of DR and HRQOL, predicted QOL values for driving, composite, mental, and physical scores were obtained through a regression model conditioned on an individual’s severity of DR (i.e., no diabetes, minimum, mild, moderate, severe, or proliferative DR). Regression was adjusted for duration of diabetes and other covariates.33 Due to the non-normal distribution of QOL scores, median values were reported for raw and predicted scores by clinical severity as a robust measure for characterizing the trend in HRQOL scores.
In order to examine the rate of QOL descent and to determine the ‘turning point’ at which there is a considerable decrease in driving or composite QOL, we computed the slope m between all consecutive points (yi,yi+1) of the LOWESS curve determined by the 15-step predicted median values, where 1 ≤ i ≤ 15 and 0 ≤ y ≤ 100. The consecutive tangent slope values for any two pairs of points (xi, yi), (xi+1, yi+1) on the LOWESS curve are given by mi,i+1 = (yi+1 – yi)/(xi+1 – xi). The slope measure takes into account the change in both the dependent and independent variables (i.e., HRQOL and DR severity, respectively), thus best describing the magnitude of change in HRQOL between consecutive steps of severity. Finally, we compared the change in slope values for each pair of consecutive points by measuring the decrease in consecutive slopes. All analyses were conducted using SAS software 9.1 (SAS Institute, Inc., Cary, NC), at the significance level of 0.05.
RESULTS
Description of Study Cohort
Of the 7,789 eligible participants identified for LALES, 6,357 (82%) completed an ophthalmic examination and of these, 1,263 were identified as having definite type 2 DM. Of the 1,263 participants, 1,064 (84%) were included in the analyses, as they had a gradable fundus photograph and completed the SF-12 and NEI-VFQ-25 questionnaires. Of the 199 excluded from the analysis, 46 participants did not have gradable fundus photograph, and 153 did not complete the SF-12 and NEI-VFQ-25 questionnaires. Of the 1,064 participants included in the analysis, 578 (54%) had no DR; 166 (16%) had unilateral NPDR, 268 (25%) had bilateral NPDR; 23 (2%) had unilateral PDR; 29 (3%) had bilateral PDR.
Socio-demographic and clinical characteristics of the study participants are presented in Table 1. Participants with DR had a statistically significant higher age, more co-morbidities and a higher proportion of unemployed participants compared to participants with no DR (all p<0.05). No significant differences were found for acculturation score, gender, income, education, health insurance and vision insurance.
Table 1.
Socio-demographic Characteristics of Persons with Type 2 Diabetes Mellitus in the Los Angeles Latino Eye Study Stratified by Presence of Diabetic Retinopathy (N=1064)
| Variables | No DR* N=578 | DR* N=486 | P-value |
|---|---|---|---|
| Age | 58.2 (10.3) | 59.6 (9.9) | 0.0254 |
| Acculturation Score‡ | 1.9 (1.0) | 1.86 (0.96) | 0.5148 |
| Co-morbidities§ | 2.5 (1.8) | 3.0 (1.6) | <.0001 |
| Gender: Female | 340 (58.8) | 263 (54.1) | 0.1226 |
| Unemployed | 356 (61.8) | 340 (70.3) | 0.0039 |
| Income <$20,000 | 286 (49.5) | 233 (47.9) | 0.6170 |
| Education<12 years | 400 (69.4) | 342 (70.5) | 0.7047 |
| Health Insurance: Yes | 398 (69.0) | 341 (70.3) | 0.6384 |
| Vision Insurance: Yes | 326 (56.5) | 279 (57.9) | 0.7215 |
Data are presented as mean (standard deviation) for age, acculturation, and co-morbidities; frequency (%) for all other variables. Frequency is based on the total number of participants for each item and varies depending on missing data for a specific item. P-values were calculated using t-test for continuous variables and chi-square for categorical variables.
Acculturation was measured using the short-form Cuellar Acculturation Scale.
Number of self-reported co-morbidities (arthritis, stroke/brain hemorrhage, high blood pressure, angina, heart attack, heart failure, asthma, skin cancer, other cancer, back problems, hearing problems and other major health problems).
DR=Diabetic Retinopathy
Health related Quality of Life and Diabetic Retinopathy
There was a statistically significant lower NEI-VFQ25 Composite score (p=0.04) and the SF-12 PCS (p=0.007) score by status of DR after adjusting for age, gender, education, employment status, income, acculturation, co-morbidities, health insurance, and vision insurance (table not shown).
The linear regression beta (β) coefficients between severity levels of DR (ETDRS severity scale) and HRQOL scores (table not shown), demonstrates statistically significant decreasing trend in all subscales of NEI-VFQ-25 scores (p<0.0008 for all subscales) with increase in severity levels of DR. β coefficients were largest for, vision related dependency (−1.34), vision related mental health (−1.34) driving difficulties (−1.29), and general health (−1.25). The covariate adjusted median scores of NEI-VFQ scores across severity levels of DR were lower for participants with DR compared to participants with no DR and were lower with more severe DR. Further, participants with PDR, showed a significantly lower HRQOL scores for most of the NEI-VFQ-25 sub-scales compared to participants without DR. A similar trend was observed between DR severity levels and the SF-12 PCS and MCS, such that participants with more severe DR had a lower HRQOL scores. The β coefficients were statistically significant for both subscales of SF-12. The covariate adjusted median SF-12 scores across severity levels of DR (table not shown) showed significant differences in HRQOL by severity of DR for PCS (p=0.01) but not for MCS (p=0.89).
LOWESS (Locally weighted Scatter plot Smoothing) plots for NEI-VFQ-25 driving, composite and SF-12 PCS and MCS were fitted using the 15 HRQOL median predictors (Figures 1 and 2). Slopes corresponding to the consecutive HRQOL median estimates are summarized in Table 2. Change in slopes between two consecutive steps of DR severity was relatively consistent till step 8. However, a sharp decrease in HRQOL was noted between steps 8 and 9 for both driving and composite scores (slope m8,9 = −2.99 and −1.80, respectively). Similarly, a sharp decrease in HRQOL between steps 8 and 9 was observed for the PSC and MCS (slope m8,9 = −0.94 and −0.46, respectively). Moreover, the change in slope continued to dramatically decrease between steps 9 to 15 for all score types. In addition, the overall change in composite, driving, mental, and physical scores between steps 1–8, 9–14, and 14–15 confirms the dramatic slope difference in HRQOL before and after both eyes become affected by moderate DR. This trend is also depicted in most of the other HRQOL subscales, Figure 3 (available online at http://aaojournal.org). To assess the statistical significance of the turn-point, the Wilcoxon test was applied to compare the HRQOL scores by severity of DR (group2 – 8 vs. group9 – 15). The p-values were <0.0001 for both NEI-VFQ driving and composite scores. In addition, there was a significant differences in predicted HRQOL for severe vs. proliferative DR (p= <0.0001 for both). However, when we restricted the analysis to participants with PDR, we found that compared to people with no DR or unilateral PDR, those with bilateral PDR had statistically significantly lower scores in all subscales of NEI-VFQ-25.
Figure 1.
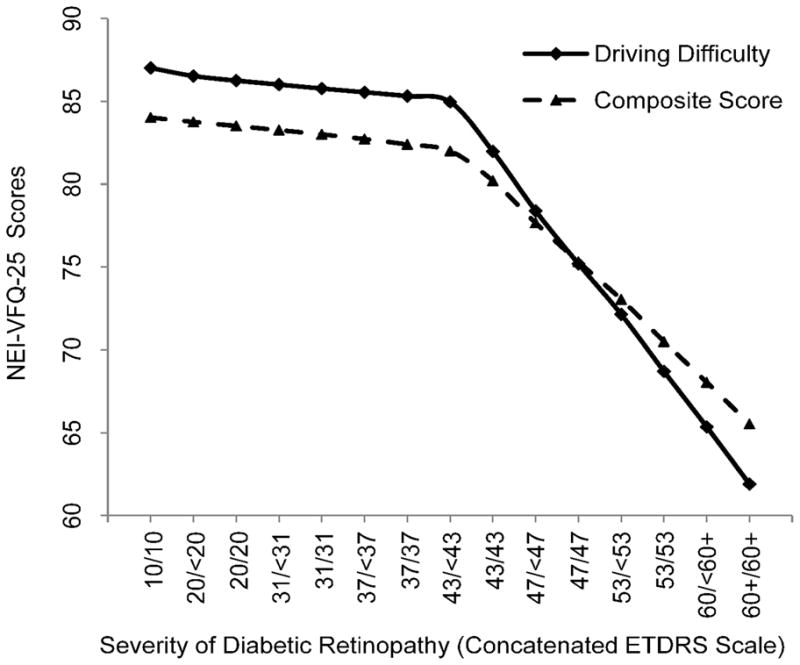
Relationship between National Eye Institute-Visual Function Questionnaire-25 (NEI-VFQ25) driving difficulty subscale and composite score and severity of diabetic retinopathy (DR) based on the concatenated scale with a locally weighted regression plot (LOWESS). Early Treatment Diabetic Retinopathy Study (ETDRS) scores correspond to the following clinical severity levels: No DR (levels 10 through 13; unilateral or bilateral nonproliferative DR (NPDR; levels 14 through 53); unilateral or bilateral proliferative DR (PDR; levels 60 through 85). DR Severity Concantenated scale step 9 (43/43) corresponds to bilateral moderate NPDR. The NEIVFQ25 scores have been adjusted for covariates.
Figure 2.

Relationship between Short Form 12 (SF-12) physical and mental health component subscale scores and severity of diabetic retinopathy (DR) based on the concantenated scale with a locally weighted regression plot (LOWESS). Early Treatment Diabetic Retinopathy Study (ETDRS) scores correspond to the following clinical severity levels: No DR (levels 10 through 13; unilateral or bilateral nonproliferative DR (NPDR; levels 14 through 53); unilateral or bilateral proliferative DR (PDR; levels 60 through 85). DR Severity Concantenated scale step 9 (43/43) corresponds to bilateral moderate NPDR. The SF12 scores have been adjusted for covariates.
Table 2.
National Eye Institute Visual Function 25 (NEI-VFQ-25) Composite and Driving Difficulty Subscale Scores and the Short Form 12 (SF-12) Physical and Mental Component Subscale Scores at Each Severity level of Diabetic Retinopathy. The Slopes for the Relationship between Severity of Diabetic Retinopathy and the NEI-VFQ-25 and SF-12 QOL scores are also presented.
| NEI-VFQ-25 | SF-12 | ||||||||
|---|---|---|---|---|---|---|---|---|---|
| DR Severity Concatenated scale steps* | ETDRS Score in the two eyes | Driving Difficulty Sub-scale | NEIVFQ25 Composite | Physical Component | Mental Component | ||||
| Score | Slope | Score | Slope | Score | Slope | Score | Slope | ||
| 1 | 10/10 | 87.02 | 84.02 | 44.85 | 49.24 | ||||
| 2 | 20/<20 | 86.53 | −0.49 | 83.76 | −0.27 | 44.31 | −0.55 | 48.98 | −0.25 |
| 3 | 20/20 | 86.26 | −0.28 | 83.52 | −0.24 | 43.95 | −0.35 | 48.85 | −0.13 |
| 4 | 31/<31 | 86.02 | −0.24 | 83.27 | −0.25 | 43.64 | −0.31 | 48.73 | −0.12 |
| 5 | 31/31 | 85.78 | −0.24 | 83.01 | −0.26 | 43.35 | −0.29 | 48.61 | −0.12 |
| 6 | 37/<37 | 85.55 | −0.23 | 82.72 | −0.28 | 43.08 | −0.27 | 48.49 | −0.12 |
| 7 | 37/37 | 85.32 | −0.23 | 82.40 | −0.32 | 42.83 | −0.25 | 48.37 | −0.12 |
| 8 | 43/<43 | 84.97 | −0.35 | 82.00 | −0.40 | 42.58 | −0.25 | 48.19 | −0.18 |
| 9 | 43/43 | 81.98 | −2.99 | 80.21 | −1.80 | 41.64 | −0.94 | 47.73 | −0.46 |
| 10 | 47/<47 | 78.39 | −3.59 | 77.66 | −2.54 | 40.62 | −1.01 | 47.06 | −0.68 |
| 11 | 47/47 | 75.20 | −3.19 | 75.31 | −2.35 | 39.73 | −0.89 | 46.41 | −0.65 |
| 12 | 53/<53 | 72.15 | −3.05 | 73.05 | −2.26 | 38.89 | −0.85 | 45.77 | −0.64 |
| 13 | 53/53 | 68.70 | −3.44 | 70.50 | −2.55 | 37.97 | −0.92 | 45.06 | −0.71 |
| 14 | 60+/<60+ | 65.35 | −3.35 | 68.04 | −2.46 | 37.03 | −0.93 | 44.38 | −0.68 |
| 15 | 60+/60+ | 61.90 | −3.46 | 65.53 | −2.51 | 36.07 | −0.97 | 43.69 | −0.69 |
QOL: Quality of Life
Early Treatment Diabetic Retinopathy Study (ETDRS) scores correspond to the following clinical severity levels: Level 10–13: No Diabetic Retinopathy (DR), Levels 14–31: Mild Non-proliferative Diabetic Retinopathy (NPDR), Levels 35–47 Moderate NPDR, Level 53: Severe NPDR, Levels 60 and higher PDR. DR Severity Concatenated scale step 9 (43/43) corresponds to bilateral moderate NPDR. The NEIVFQ25 and SF12 scores have been adjusted for covariates.
DISCUSSION
In this study we found that participants with DR had lower NEI-VFQ-25 and SF-12 scores compared to participants without DR and this association was impacted both by severity and laterality of disease, such that participants with more severe DR had lower HRQOL scores and participants with bilateral disease had lower scores compared to those with unilateral disease. This pattern was observed with or without adjusting for visual impairment. In overall comparisons, differences between persons with unilateral and bilateral moderate NPDR is the largest and most substantial across the spectrum of DR severity (P<0.05). Hence, the prevention of both DR and its progression from unilateral to bilateral NPDR is likely to have a positive impact on their HRQOL.
We observed a strong, inverse association between severity of DR (which includes laterality) and HRQOL. This inverse relationship between HRQOL and DR severity is more pronounced for driving difficulty, with the lowest QOL scores found for severe DR. These results are similar to those reported by Coyne et al34 where they found that visual impairment among individuals with moderate and severe NPDR and PDR was significantly associated with HRQOL, particularly in areas of independence, mobility, leisure and self-care activities. In that study, loss of independence related to driving had a profound impact on social activities. One likely explanation for driving problems in this DR patient population is disease associated visual impairment.
We employed an adjusted regression analysis in order to predict quality of life as a function of severity of diabetic retinopathy. In addition, we examined the dependency between predicted QOL scores and DR severity through computation of LOWESS trend-line slopes and through non-parametric Wilcoxon tests of individual predictors. Notably, we observe a similarity in QOL trends across composite, driving, mental, and physical scores. However, the overall QOL trend does not follow a monotonically linear model but changes slope sharply once both eyes become affected by moderate DR. Thus, while individuals diagnosed with DR within steps 2 through 8 (minimum DR to 1-eye moderate DR) show a small but constant decline in QOL, we detect a substantial decrease between steps 8 and 9, when moderate DR progresses from one eye to both eyes (Figures 1 and 2; Table-2). Notably, this trend in QOL change is similar for most of the other HRQOL subscales.
A comparison of individual driving and composite QOL predictors between the two DR groups (2–8 vs. 9–15) gave highly significant differences (p-value =<0.001). Thus, provided that the moderate DR impairment of one eye is compensated by a better eye, DR affected individuals sustain relatively high QOL standards and report somewhat incremental losses in either composite or driving scores. The monotonically mild decrease in predicted QOL is also supported by the non-significant difference in p-values for both step-wise and clinical DR severity consecutive pairs. Finally, in accord with the severe slope descent for driving and composite QOL within steps 9 to 15, we obtained statistically significant differences between individual predictors of severe NPDR vs. proliferative DR (p-value =<0.001 for both). Furthermore, these results are in agreement with the differences observed through the original regression model. Diabetic retinopathy results in visual impairment which has been previously reported to be associated with dependency in activities of daily living, social isolation and reduced physical activity, all of which result in decrease in HRQOL scores. Our data shows similar results, for with and without adjustment for visual impairment. Another point of interest in our results is the difference in the HRQOL score between step 8 and step 9 and beyond. Step 8 corresponds to the level 43 of Airlie House classification scheme for retinopathy, which clinically corresponds with microaneurysms plus 1 or more of the following: retinal hemorrhage/microaneurysms/microaneurysms greater than or equal to standard photograph 2A in 1 field, intraretinal microvascular abnormalities in 1 to 3 fields. Step 9 and higher all have more severe changes in the retina and presumably retinal function (including visual field loss, loss in contrast sensitivity). 35–37 This may provide another explanation for the lower HRQOL scores for step 9 and higher.
In our study, participants with bilateral moderately severe NPDR and worse had a lower HRQOL scores compared to participants with unilateral NPDR or no DR. This finding is further supported by previous work by us and others that has suggested that bilateral eye disease has a greater impact on HRQOL than unilateral eye disease. 31,38 Our finding, that bilateral NPDR significantly impacts visual functioning and HRQOL, underscores the need to employ appropriate screening, monitoring, and intervention to prevent or reduce the risk of developing bilateral moderately severe PDR.
Other studies have also reported on the negative influence of hyperglycemia and diabetic complications on the NEI-VFQ-25, SF-36, and SF-20 scores.39–42
While our overall sample of DR was large compared to previous studies, we did not have a large number of participants with severe DR (unilateral and bilateral PDR) to appropriately explore the association between PDR and HRQOL. As might be expected, the score differences between unilateral and bilateral PDR and no DR were large in magnitude. Another limitation of our study is the use of prevalent data which does not allow us to evaluate longitudinal changes in the impact of increasing severity of DR on HRQOL over time.
Because our study focused primarily on the adult Latino population in Los Angeles County, our findings may not be generalizable to the entire adult U.S. population or U.S. Latinos who are not of Mexican ancestry. Cultural differences may influence how participants respond to items in standardized survey instruments. Additional research on a more diverse population or other sub-populations is needed to complement our study findings.
In summary, patients with DR have a measurable decline in HRQOL early in the disease process and this decline is much greater in persons with bilateral moderately severe NPDR or worse DR compared to those with no DR or less severe DR. While most of the current guidelines suggest laser photocoagulation or other interventions (vitrectomy) in persons with severe NPDR to prevent the development of PDR or other ocular complications, our data suggest that earlier intervention should be considered to prevent the development of bilateral moderately severe NPDR as it is at this severity level that the impact on a person’s HRQOL begins to decline at a more rapid trajectory than those with less severe or no DR.
Supplementary Material
Acknowledgments
Funding/Support: Grants EY-11753 and EY-03040 from the National Eye Institute and the National Center on Minority Health and Health Disparities, National Institutes of Health, Bethesda, Maryland, and an unrestricted grant from Research to Prevent Blindness, New York, NY. Rohit Varma is a Research to Prevent Blindness Sybil B. Harrington Scholar.
Footnotes
Conflict of Interest: The authors have no proprietary or commercial interest in any materials discussed in the manuscript.
“This article contains additional online-only material. The following should appear online-only: Figure 3.”
Publisher's Disclaimer: This is a PDF file of an unedited manuscript that has been accepted for publication. As a service to our customers we are providing this early version of the manuscript. The manuscript will undergo copyediting, typesetting, and review of the resulting proof before it is published in its final citable form. Please note that during the production process errors may be discovered which could affect the content, and all legal disclaimers that apply to the journal pertain.
References
- 1.Woodcock A, Bradley C, Plowright R, et al. The influence of diabetic retinopathy on quality of life: interviews to guide the design of a condition-specific, individualised questionnaire: the RetDQoL. Patient Educ Couns. 2004;53:365–83. doi: 10.1016/j.pec.2003.10.007. [DOI] [PubMed] [Google Scholar]
- 2.Sharma S, Oliver-Fernandez A, Liu W, et al. The impact of diabetic retinopathy on health-related quality of life. Curr Opin Ophthalmol. 2005;16:155–9. doi: 10.1097/01.icu.0000161227.21797.3d. [DOI] [PubMed] [Google Scholar]
- 3.Eye Diseases Prevalence Research Group. The prevalence of diabetic retinopathy among adults in the United States. Arch Ophthalmol. 2004;122:552–63. doi: 10.1001/archopht.122.4.552. [DOI] [PubMed] [Google Scholar]
- 4.Harris MI. Epidemiological correlates of NIDDM in Hispanics, whites and blacks in the U.S. population. Diabetes Care. 1991;14:639–48. doi: 10.2337/diacare.14.7.639. [DOI] [PubMed] [Google Scholar]
- 5.Harris MI, Klein R, Cowie CC, et al. Is the risk of diabetic retinopathy greater in non-Hispanic blacks and Mexican Americans than in non-Hispanic whites with type 2 diabetes? A U.S. populations study. Diabetes Care. 1998;21:1230–5. doi: 10.2337/diacare.21.8.1230. [DOI] [PubMed] [Google Scholar]
- 6.Varma R, Torres M, Pena F, et al. Los Angeles Latino Eye Study Group. Prevalence of diabetic retinopathy in adult Latinos: the Los Angeles Latino Eye Study. Ophthalmology. 2004;111:1298–306. doi: 10.1016/j.ophtha.2004.03.002. [DOI] [PubMed] [Google Scholar]
- 7.Cotter SA, Varma R, Ying-Lai M, et al. Los Angeles Latino Eye Study Group. Causes of low vision and blindness in adult Latinos: the Los Angeles Latino Eye Study. Ophthalmology. 2006;113:1574–82. doi: 10.1016/j.ophtha.2006.05.002. [DOI] [PubMed] [Google Scholar]
- 8.Jette AM, Branch LG. Impairment and disability in the aged. J Chronic Dis. 1985;38:59–65. doi: 10.1016/0021-9681(85)90008-6. [DOI] [PubMed] [Google Scholar]
- 9.West SK, Munoz B, Rubin GS, et al. SEE Project Team. Function and visual impairment in a population-based study of older adults: the SEE Project. Invest Ophthalmol Vis Sci. 1997;38:72–82. [PubMed] [Google Scholar]
- 10.Carabellese C, Appollonio I, Rozzini R, et al. Sensory impairment and quality of life in a community elderly population. J Am Geriatr Soc. 1993;41:401–7. doi: 10.1111/j.1532-5415.1993.tb06948.x. [DOI] [PubMed] [Google Scholar]
- 11.Thompson JR, Gibson JM, Jagger C. The association between visual impairment and mortality in elderly people. Age Ageing. 1989;18:83–8. doi: 10.1093/ageing/18.2.83. [DOI] [PubMed] [Google Scholar]
- 12.Hakkinen L. Vision in the elderly and its use in the social environment. Scand J Soc Med Suppl. 1984;35:5–60. [PubMed] [Google Scholar]
- 13.Mangione CM, Lee PP, Pitts J, et al. NEI-VFQ Field Test Investigators. Psychometric properties of the National Eye Institute Visual Function Questionnaire (NEI-VFQ) Arch Ophthalmol. 1998;116:1496–504. doi: 10.1001/archopht.116.11.1496. [DOI] [PubMed] [Google Scholar]
- 14.Brown MM, Brown GC, Sharma S, Shah G. Utility values and diabetic retinopathy. Am J Ophthalmol. 1999;128:324–30. doi: 10.1016/s0002-9394(99)00146-4. [DOI] [PubMed] [Google Scholar]
- 15.Hanninen J, Takala J, Keinanen-Kiukaanniemi S. Quality of life in NIDDM patients assessed with the SF-20 questionnaire. Diabetes Res Clin Pract. 1998;42:17–27. doi: 10.1016/s0168-8227(98)00085-0. [DOI] [PubMed] [Google Scholar]
- 16.Klein R, Moss SE, Klein BE, et al. The NEI-VFQ-25 in people with long-term type 1 diabetes mellitus: the Wisconsin Epidemiologic Study of Diabetic Retinopathy. Arch Ophthalmol. 2001;119:733–40. doi: 10.1001/archopht.119.5.733. [DOI] [PubMed] [Google Scholar]
- 17.Cusick M, SanGiovanni JP, Chew EY, et al. Central visual function and the NEI-VFQ-25 near and distance activities subscale scores in people with type 1 and 2 diabetes. Am J Ophthalmol. 2005;139:1042–50. doi: 10.1016/j.ajo.2005.01.008. [DOI] [PubMed] [Google Scholar]
- 18.Varma R, Paz SH, Azen SP, et al. Los Angeles Latino Eye Study Group. The Los Angeles Latino Eye Study: design, methods, and baseline data. Ophthalmology. 2004;111:1121–31. doi: 10.1016/j.ophtha.2004.02.001. [DOI] [PubMed] [Google Scholar]
- 19.Globe DR, Schoua-Glusberg A, Paz S, et al. Using focus groups to develop a culturally sensitive methodology for epidemiological surveys in a Latino population: findings from the Los Angeles Latino Eye Study (LALES) Ethn Dis. 2002;12:259–66. [PubMed] [Google Scholar]
- 20.Solis JM, Marks G, Garcia M, Shelton D. Acculturation, access to care, and use of preventive services by Hispanics: findings from HHANES 1982–84. Am J Public Health. 1990;80(suppl):11–9. doi: 10.2105/ajph.80.suppl.11. [DOI] [PMC free article] [PubMed] [Google Scholar]
- 21.Marks G, Garcia M, Solis JM. Health risk behaviors of Hispanics in the United States: findings from HHANES, 1982–84. Am J Public Health. 1990;80(suppl):20–6. doi: 10.2105/ajph.80.suppl.20. [DOI] [PMC free article] [PubMed] [Google Scholar]
- 22.Linn BS, Linn MW, Gurel L. Cumulative illness rating scale. J Am Geriatr Soc. 1968;16:622–6. doi: 10.1111/j.1532-5415.1968.tb02103.x. [DOI] [PubMed] [Google Scholar]
- 23.Brody BL, Gamst AC, Williams RA, et al. Depression, visual acuity, comorbidity, and disability associated with age-related macular degeneration. Ophthalmology. 2001;108:1893–900. doi: 10.1016/s0161-6420(01)00754-0. discussion 1900–1. [DOI] [PubMed] [Google Scholar]
- 24.Globe DR, Varma R, Torres M, et al. Los Angeles Latino Eye Study Group. Self-reported comorbidities and visual function in a population-based study: the Los Angeles Latino Eye Study. Arch Ophthalmol. 2005;123:815–21. doi: 10.1001/archopht.123.6.815. [DOI] [PubMed] [Google Scholar]
- 25.Klein R, Klein BE, Moss SE. How many steps of progression of diabetic retinopathy are meaningful? The Wisconsin Epidemiologic Study of Diabetic Retinopathy. Arch Ophthalmol. 2001;119:547–53. doi: 10.1001/archopht.119.4.547. [DOI] [PubMed] [Google Scholar]
- 26.Ware J, Jr, Kosinski M, Keller SD. A 12-item short-form health survey: construction of scales and preliminary tests of reliability and validity. Med Care. 1996;34:220–33. doi: 10.1097/00005650-199603000-00003. [DOI] [PubMed] [Google Scholar]
- 27.Ware JE, Kosinski M, Keller SD. SF-12: How to Score the SF-12 Physical and Mental Health Summary Scales. 2. Boston, MA: The Health Institute, New England Medical Center; 1995. [Google Scholar]
- 28.Mangione CM, Lee PP, Gutierrez PR, et al. National Eye Institute Visual Function Questionnaire Field Test Investigators. Development of the 25-item National Eye Institute Visual Function Questionnaire. Arch Ophthalmol. 2001;119:1050–8. doi: 10.1001/archopht.119.7.1050. [DOI] [PubMed] [Google Scholar]
- 29.Hays R. Generic versus disease-targeted instruments. In: Fayers PM, Hays RD, editors. Assessing Quality of Life in Clinical Trials: Methods and Practice. 2. New York: Oxford University Press; 2005. pp. 3–8. [Google Scholar]
- 30.Globe DR, Wu J, Azen SP, et al. Los Angeles Latino Eye Study Group. The impact of visual impairment on self-reported visual functioning in Latinos: the Los Angeles Latino Eye Study. Ophthalmology. 2004;111:1141–9. doi: 10.1016/j.ophtha.2004.02.003. [DOI] [PubMed] [Google Scholar]
- 31.Varma R, Wu J, Chong K, et al. Los Angeles Latino Eye Study Group. Impact of severity and bilaterality of visual impairment on health-related quality of life. Ophthalmology. 2006;113:1846–53. doi: 10.1016/j.ophtha.2006.04.028. [DOI] [PubMed] [Google Scholar]
- 32.Hsu JC, Nelson B. Multiple comparisons in the general linear model. J Comput Graph Stat. 1998;7:23–41. [Google Scholar]
- 33.Cohen J. Statistical Power Analysis for the Behavioral Sciences. 2. Hillsdale, NJ: L. Earlbaum Associates; 1988. pp. 20–74. [Google Scholar]
- 34.Coyne KS, Margolis MK, Kennedy-Martin T, et al. The impact of diabetic retinopathy: perspectives from patient focus groups. Fam Pract. 2004;21:447–53. doi: 10.1093/fampra/cmh417. [DOI] [PubMed] [Google Scholar]
- 35.Henricsson M, Heijl A. Visual fields at different stages of diabetic retinopathy. Acta Ophthalmol (Copenh) 1994;72:560–9. doi: 10.1111/j.1755-3768.1994.tb07180.x. [DOI] [PubMed] [Google Scholar]
- 36.Kern TS, Barber AJ. Retinal ganglion cells in diabetes. J Physiol. 2008;586:4401–8. doi: 10.1113/jphysiol.2008.156695. [DOI] [PMC free article] [PubMed] [Google Scholar]
- 37.Pahor D. Reduction of retinal light sensitivity in diabetic patients [in German] Klin Monbl Augenheilkd. 2003;220:868–72. doi: 10.1055/s-2003-812556. [DOI] [PubMed] [Google Scholar]
- 38.Knudtson MD, Klein BE, Klein R, et al. Age-related eye disease, quality of life, and functional activity. Arch Ophthalmol. 2005;123:807–14. doi: 10.1001/archopht.123.6.807. [DOI] [PubMed] [Google Scholar]
- 39.Rubin RR, Peyrot M. Quality of life and diabetes. Diabetes Metab Res Rev. 1999;15:205–18. doi: 10.1002/(sici)1520-7560(199905/06)15:3<205::aid-dmrr29>3.0.co;2-o. [DOI] [PubMed] [Google Scholar]
- 40.Broman AT, Munoz B, Rodriguez J, et al. The impact of visual impairment and eye disease on vision-related quality of life in a Mexican-American population: Proyecto VER. Invest Ophthalmol Vis Sci. 2002;43:3393–8. [PubMed] [Google Scholar]
- 41.Klein BE, Klein R, Moss SE. Self-rated health and diabetes of long duration: the Wisconsin Epidemiologic Study of Diabetic Retinopathy. Diabetes Care. 1998;21:236–40. doi: 10.2337/diacare.21.2.236. [DOI] [PubMed] [Google Scholar]
- 42.Klein R, Klein BE. Relation of glycemic control to diabetic complications and health outcomes. Diabetes Care. 1998;21(suppl):C39–43. doi: 10.2337/diacare.21.3.c39. [DOI] [PubMed] [Google Scholar]
Associated Data
This section collects any data citations, data availability statements, or supplementary materials included in this article.