

Abstract
Depicting the salvageable tissue is increasingly used in the clinical setting following stroke. As absolute cerebral blood flow (CBF) is difficult to measure using perfusion magnetic resonance or computed tomography and has limitations as a penumbral marker, time-based variables, particularly the mean transit time (MTT), are routinely used as surrogates. However, a direct validation of MTT as a predictor of the penumbra threshold using gold-standard positron emission tomography (PET) is lacking. Using 15O-PET data sets obtained from two independent acute stroke samples (N=7 and N=30, respectively), we derived areas under the curve (AUCs), optimal thresholds (OTs), and 90%-specificity thresholds (90%-Ts) from receiver operating characteristic curves for absolute MTT, MTT delay, and MTT ratio to predict three penumbra thresholds (‘classic': CBF <20 mL/100 g per min; ‘normalized': CBF ratio <0.5; and ‘stringent': both CBF <20 mL/100 g per min and oxygen extraction fraction >0.55). In sample 1, AUCs ranged from 0.79 to 0.92, indicating good validity; OTs ranged from 7.8 to 8.3 seconds, 2.8 to 4.7 seconds, and 151% to 267% for absolute MTT, MTT delay, and MTT ratio, respectively, while as expected, 90%-Ts were longer. There was no significant difference between sample 1 and sample 2 for any of the above measurements, save for a single MTT parameter with a single penumbra threshold. These consistent findings from gold-standard PET obtained in two independent cohorts document that MTT is a very good surrogate to CBF for depicting the penumbra threshold.
Keywords: acute stroke, brain ischemia, cerebral blood flow, neurophysiology, positron emission tomography
Introduction
The ischemic penumbra refers to the severely hypoperfused, neurophysiologically silent brain tissue at risk of infarction but still salvageable if reperfused early enough (Astrup et al, 1981; Baron, 2001a; Heiss, 2000; Jones et al, 1981). The penumbra is the target of reperfusion therapy such as intravenous thrombolysis, and identifying it is an important goal. The penumbra is caused by a marked reduction in cerebral perfusion pressure beyond the autoregulation range (Baron, 2001b), causing a reduction in cerebral blood flow (CBF) below a certain threshold (Donnan and Davis, 2002).
Positron emission tomography (PET) using oxygen 15-labeled tracers (15O-PET) is considered the most reliable method for detecting the penumbra because it allows a fully quantitative measurement of CBF, cerebral blood volume (CBV), oxygen extraction fraction (OEF), and cerebral metabolic rate of oxygen (Baron et al, 1989; Frackowiak et al, 1980). Using this technique, the CBF penumbra threshold has been found to stand ∼20 mL/100 g per min in humans, consistent with early reports using various perfusion techniques (Baron, 2001b; Donnan and Davis, 2002; Heiss, 2000), and accordingly, this flow threshold is widely used as a gold standard (Olivot et al, 2009; Sobesky et al, 2004; Takasawa et al, 2008; Zaro-Weber et al, 2009, 2010a). However, using absolute CBF to define the penumbra in acute stroke does have two main limitations. First, the penumbra threshold may differ between the gray and white matter (Bristow et al, 2005; Marcoux et al, 1982), which can be partially controlled by normalizing absolute CBF by contralateral values (Heiss et al, 2001). Second, even early after stroke, low CBF below the penumbra threshold may represent partially reperfused irreversibly damaged tissue, in which the paradoxically low CBF is a result of very low metabolic activity (Sette et al, 1989). However, this potentially misleading situation may be distinguished from true penumbral flow by also considering the OEF, which in partial reperfusion is not as high as would be expected in persistent occlusion. Thus, combining the usual CBF penumbra threshold with a high OEF threshold should help exclude the partially reperfused tissue with paradoxically low CBF (Furlan et al, 1996; Takasawa et al, 2008).
These two limitations of CBF do not apply to the vascular mean transit time (MTT), i.e., the local CBV/CBF ratio (Grubb et al, 1974), making it appealing as a potential surrogate of CBF to predict the penumbra. Thus, unlike CBF, the MTT (1) is almost uniformly distributed across the gray and white matter (Bristow et al, 2005; Ito et al, 2003; Sette et al, 1989) and (2) monotonously increases in proportion to cerebral perfusion pressure decreases (Gibbs et al, 1984; Schumann et al, 1998; Sette et al, 1989). As a result, it quickly returns to normal or even abnormally short values with reperfusion (Kidwell et al, 2001), presumably even in the above situation of partially reperfused core. Intriguingly, despite this potential interest, the validity of MTT to predict the penumbra flow threshold has not so far been assessed using gold-standard PET.
Perfusion magnetic resonance (pMR) and perfusion computed tomography (pCT) are increasingly used in the clinical setting to select patients appropriate for thrombolysis, particularly beyond the recommended time window or when the time of onset is unclear (Wardlaw, 2010; Wintermark et al, 2008). However, because of intrinsic method characteristics, the absolute CBF values derived from these two techniques are considered unreliable (Calamante et al, 2002). For this reason, other perfusion-related variables, particularly time-based variables such as the MTT, have been widely assessed as predictors of the at-risk tissue, and several pMR and pCT studies (Takasawa et al, 2008; Zaro-Weber et al, 2010a) have suggested that the MTT may reliably predict the penumbra flow threshold. However, although better than for CBF, the accuracy of pMR- and pCT-derived MTT remains suboptimal because of inaccuracies in arterial input function determination and issues with delay and dispersion of the tracer before arrival to the ischemic tissue (Calamante et al, 2002; Donnan et al, 2009; Wintermark et al, 2008; Wu et al, 2003). To optimally address the fundamental issue of whether the MTT reliably predicts the penumbra flow threshold, it would therefore be desirable to use PET-derived MTT, rather than pMR- or pCT-derived MTT, and to use PET-derived CBF as reference—a study not carried out so far.
In this study, we used receiver operating characteristic (ROC) analysis to determine the validity of PET-derived MTT for predicting the penumbra threshold, also defined using PET. As the primary aim, we tested the validity of MTT using ROC-derived areas under the curve (AUCs). As the penumbra threshold, we used not only the classic absolute threshold of CBF <20 mL/100 g per min but also a relative CBF threshold (<50% of contralateral) and the more stringent combined CBF/OEF threshold (i.e., CBF <20 mL/100 g per min and OEF>0.55). Finally, for validation of the results, the analysis was repeated in two independent cohorts of patients with acute middle cerebral artery stroke.
Patients and methods
First Cohort (‘Cambridge Data Set')
Patients
The clinical material consists of seven consecutive acute middle cerebral artery stroke patients (mean age 62.2±20.2 years; 3 women) admitted to the Cambridge University Hospitals and in whom a technically satisfactory 15O-PET was obtained. They underwent acute 15O-PET as part of a prospective research protocol. Data obtained from six of these seven patients have been published previously (Guadagno et al, 2006), but this study addressed an entirely different topic. Exclusion criteria were previous stroke, lacunar syndrome, hemorrhagic stroke on admission CT, anticoagulation or thrombolytic therapy (because arterial cannulation was required to obtain quantitative PET data), inability to cooperate, organ failure, and recent myocardial infarction. The National Institutes of Health stroke scale (NIHSS) was prospectively administered to all patients. The Cambridgeshire Regional Ethics Committee approved the protocol, and informed consent was obtained from each patient (or from the next of kin); all patient data were anonymized before analysis.
Methods
Data Acquisition: Positron emission tomography studies were performed at a mean 18.6±5.0 hours (range: 8.5 to 22.5) after stroke on a GE Advance scanner (General Electrics, Milwaukee, WI, USA) with a 15.3-cm axial field of view, using the steady-state method (Baron et al, 1989). Emission data were acquired in a three-dimensional mode during a 10-minute steady-state intravenous infusion of H215O, followed by a 10-minute steady-state inhalation of 15O2 in the two-dimensional mode, and finally after a 60-second inhalation of C15O in the two-dimensional mode. Images were reconstructed into 2.34 × 2.34 × 4.25 mm3 voxels and were corrected for attenuation, scatter, randoms, and dead time. Before further processing, images were smoothed using an isotropic 4-mm Gaussian filter, resulting in a final spatial resolution of ∼7 mm. Parametric maps of CBF, cerebral metabolic rate of oxygen, OEF, and CBV were generated by inputting simultaneous PET and arterial tracer activity measurements into standard models (Guadagno et al, 2006). Magnetic resonance images were obtained before PET studies on a 3-T whole-body magnet in 6/7 patients and a 1.5-T scanner in 1. A structural dual T2-weighted fast spin echo was used for coregistration to PET maps using SPM2 (Welcome Department of Imaging Neuroscience, London, UK).
Regions of Interest: Using Analyze 7.0 (Biomedical Imaging Resource, Mayo Clinic, MN, USA), circular regions of interest (ROIs), all of identical size (16 mm diameter), were drawn contiguous to each other over the cortical ribbon and insula, as well as over the basal ganglia and white matter areas on the coregistered axial T2 image; the set of ROIs was then copied by symmetry over the affected hemisphere. Approximately 100 ROIs were drawn on each side of the brain in each patient (see the ‘Results' section). From each ROI, the mean values for CBF, CBV, and OEF were extracted, and the MTT was calculated as CBV/CBF.
Outcome Measures: Three distinct penumbra thresholds were tested (see the ‘Introduction' section):
CBF <20 mL/100 g per min (i.e., ‘Classic');
CBF ratio (affected ROI CBF/paired unaffected ROI CBF) <0.5 (i.e., ‘Normalized'); and
Both CBF <20 mL/100 g per min and relative OEF >0.55 (i.e., ‘Stringent').
Statistical Analysis
Comparing the MTT values with the corresponding state variable for each ROI, ROC curves were plotted and the AUC was calculated to assess the reliability of MTT for predicting each of the three penumbra thresholds. As the secondary objective, MTT thresholds were also derived.
Determination of the Merits of Mean Transit Time to Identify the Penumbra Threshold:
MTT variables: In addition to the absolute MTT (in seconds) for each ROI, we also calculated for each pair of ROIs the ‘MTT delay' (i.e., MTTaffected−MTTunaffected) and the ‘MTT ratio' (i.e., MTTaffected/MTTunaffected), because these metrics have been used in previous pMR and pCT studies.
ROC curves: ROCs for each of the three MTT parameters and each penumbra threshold were determined separately. This was first performed using all ROIs across all seven patients, and second on an individual patient basis. From each ROC, the AUC was extracted and rated as ‘excellent' (>0.9), ‘good' (0.8 to 0.9), or ‘fair' (0.7 to 0.8) based on published criteria (Tape, 2004).
Comparison among the three MTT parameters: To compare merits among the three MTT parameters, two different methods were used: (1) In the first method, we determined the AUC for each MTT parameter using all ROIs across all patients. The AUCs obtained for absolute MTT, MTT delay, and MTT ratio were then compared pairwise by calculating the s.e. of the difference between each pair of AUCs (A1 and A2) as:
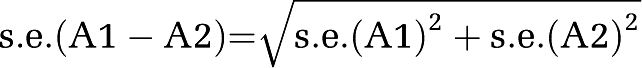 , and then by calculating the statistic as
  ; the two AUCs were considered significantly different when Z>1.96 (Hanley and McNeil, 1983; McNeil et al, 1983). This was performed for each of the three penumbra thresholds. (2) In the second method, we determined the individual AUCs for absolute MTT, MTT delay, and MTT ratio for each patient separately and then compared their means and s.d. using two-sample t-tests for each of the three penumbra thresholds separately.
MTT thresholds: We then determined from each ROC curve the classic ‘optimal threshold' (OT) (Hanley and McNeil, 1982), defined as the value closest to the point that perfectly differentiates ROIs above or below the penumbra threshold (i.e., the theoretical point with specificity and sensitivity of 100% at the left-superior corner of the ROC coordinates) (Zweig and Campbell, 1993). The OT corresponds to the MTT value that minimizes the following equation:
 . We also determined the MTT threshold corresponding to a specificity of 90% (to be referred to as 90%-T), which has stronger clinical relevance than the OT because it affords near certainty about the presence of the penumbra for decision making (Christensen et al, 2009).
Second Cohort (‘Caen Data Set')
Patients and Methods
To validate the results obtained in the first cohort, the analysis carried out in the first cohort was repeated in a second, independent, cohort, and results were directly compared between the two cohorts using appropriate tests. The ‘Caen data set' consists of 30 acute middle cerebral artery stroke patients who also underwent steady-state 15O-PET (axial brain coverage: 72 mm). The Regional Ethics Committee of Basse-Normandie approved the protocol, and informed consent was obtained from each patient (or from the next of kin); all patient data were anonymized before analysis. This cohort has been the subject of several previous publications (see for instance, Furlan et al (1996) and Marchal et al (1995, 1996)), but none of these earlier articles dealt with the topic of this study. The inclusion and exclusion criteria were similar to the Cambridge data set, and the 15O-PET method has been described in detail elsewhere (Furlan et al, 1996; Marchal et al, 1995).
Statistical Analysis
To compare the results obtained from these two data sets, the individual AUCs, 90%-Ts, and OTs were compared for each MTT parameter between the Caen and Cambridge data sets, using Student's t-tests with SPSS Version 15.0 (IBM Corporation, Somers, NY, USA). The significance level was set at P<0.05 (two tailed).
Results
Cambridge Data Set
Patients
Patient characteristics are presented in Table 1. The total number of ROIs was 748 on each side of the brain (107±25 per patient). Out of these, 188, 69, and 81 ROIs/ROI pairs were below the classic, normalized, and stringent penumbra thresholds, respectively. An illustration of the relationship between the CBF and MTT ROI data is presented in Figure 1.
Table 1. Baseline characteristics of patients.
| Patient | Gender | Age (years) | HTN | HC | DM | CS | Side | NIHSS | Time to PET (hours) |
Carotid artery |
|
|---|---|---|---|---|---|---|---|---|---|---|---|
| Ipsi. | Contra | ||||||||||
| 1 | M | 53 | − | − | − | − | L | 16 | 8.5 | Diss. | NL |
| 2 | M | 66 | + | − | − | − | L | 9 | 20.5 | NL | NL |
| 3 | F | 74 | + | − | − | + | L | 6 | 17 | 80% to 95% | NL |
| 4 | M | 64 | + | − | − | − | R | 10 | 17 | 70% to 79% | NL |
| 5 | F | 84 | − | − | − | − | R | 10 | 22 | NL | NL |
| 6 | M | 22 | − | − | − | − | L | 18 | 22.5 | NL | NL |
| 7 | F | 73 | − | − | − | − | L | 17 | 22.5 | NL | NL |
Contra, contralateral; CS, cigarette smoking; Diss., dissection; DM, diabetes mellitus; F, female, HC, hypercholesterolemia; HTN, arterial hypertension; Ipsi., ipsilateral; L, left; M, male; MCA, middle cerebral artery; −, absent; NIHSS, National Institute of Health Stroke Scale; NL, nil significant; +, present; PET, possitron emission tomography; R, right.
Figure 1.

Illustrative case. Relationship (A) between CBF and absolute MTT and (B) between CBF ratio and MTT ratio in patient 1 (left MCA stroke, see Table 1 for clinical details), showing the expected increase in MTT as CBF decreases, particularly clear below 20 mL/100 g per min absolute or 50% ratio. (C) Quantitative maps of MTT (in seconds), CBF (in mL/100 g per min), and OEF (in %) in an illustrative axial slice through the basal ganglia in the same patient; the pseudo-color scale on the left of each map shows the quantitative scale for each voxel. CBF, cerebral blood flow; MCA, middle cerebral artery; MTT, mean transit time; OEF, oxygen extraction fraction.
Value of the Mean Transit Time to Predict the Penumbra Threshold
(1) Using all ROIs across patients
Overall, the AUCs were very similar across analyses, ranging from 0.79 to 0.89, indicating a good to very-good value of MTT to predict the penumbra threshold, regardless of the MTT parameter tested and the penumbra threshold used as a gold standard (Table 2; Figure 2). Although overall the AUCs were slightly higher for absolute MTT, and the highest AUCs were observed for MTT delay and MTT ratio for the normalized penumbra threshold, there were no statistically significant differences among the three MTT parameters (all Z<1.96).
Table 2. Comparison among AUCs derived from the analysis using all ROIs across all seven patients (Cambridge data set).
| Penumbra thresholda |
AUC |
MTT threshold |
Comparison | Zb | ||
|---|---|---|---|---|---|---|
| AUC | CI | OT | 90%-T | |||
| Classic | ||||||
| MTT Abs | 0.81 | 0.76–0.85 | 7.8 seconds | 8.6 seconds | Abs versus delay | 0.56 |
| MTT delay | 0.79 | 0.74–0.84 | 2.8 seconds | 4.3 seconds | Abs versus ratio | 0.52 |
| MTT ratio | 0.79 | 0.75–0.83 | 151% | 214% | Delay versus ratio | 0.06 |
| Normalized | ||||||
| MTT delay | 0.89 | 0.84–0.94 | 4.3 seconds | 5.2 seconds | ||
| MTT ratio | 0.89 | 0.85–0.94 | 186% | 223% | Delay versus ratio | 0.15 |
| Stringent | ||||||
| MTT Abs | 0.84 | 0.79–0.90 | 8.1 seconds | 9.5 seconds | Abs versus delay | 0.68 |
| MTT delay | 0.82 | 0.77–0.86 | 2.8 seconds | 5.4 seconds | Abs versus ratio | 1.28 |
| MTT ratio | 0.79 | 0.76–0.88 | 169% | 232% | Delay versus ratio | 0.55 |
Abs, absolute; AUC, area under the curve; CI, confidence interval; MTT Abs, absolute MTT value; OT, optimal threshold; 90%-T, 90% specificity threshold (see text); ROI, region of interest.
See the ‘Methods' section for details.
Z-scores <1.96 are not statistically significant.
Figure 2.

ROC curves of the three MTT parameters to identify the three penumbra thresholds using all ROIs across all seven patients. The ROC for absolute MTT versus the normalized penumbra threshold was believed to be inappropriate for the purposes of this study; hence, it is missing from this graph. The corresponding AUCs are listed in Table 2.
The OTs ranged from 7.8 to 8.1 seconds, 2.8 to 4.3 seconds, and 151% to 186% for absolute MTT, MTT delay and MTT ratio, respectively, depending on the penumbra threshold tested. The 90%-Ts ranged from 8.6 to 9.5 seconds, 4.3 to 5.4 seconds, and 214% to 232%, respectively.
(2) Using the individual patient data
Overall, the mean individual AUCs ranged from 0.79 to 0.92, i.e., very similar to those computed by merging all ROIs across patients (Table 3). Again, there was no significant difference between AUCs among the three MTT parameters regardless of the penumbra threshold, although as above, the highest AUCs were obtained with the absolute MTT and the classic penumbra thresholds. Similarly, the mean OTs and 90%-Ts derived from the individual analysis were close to those found by merging all ROIs across all patients.
Table 3. Comparison of AUCs, optimal thresholds (OTs), and 90%-specificity thresholds (90%-Ts) derived from the individual subject analysis between the Caen and the Cambridge data sets for the three penumbra thresholds.
|
Classic penumbra threshold |
Normalized penumbra threshold |
Stringent penumbra threshold |
|||||||
|---|---|---|---|---|---|---|---|---|---|
| Cambridge | Caen | P-value | Cambridge | Caen | P-value | Cambridge | Caen | P-value | |
| AUC | |||||||||
| MTT Abs | 0.86±0.09 | 0.82±0.15 | 0.6 | NA | NA | NA | 0.84±0.08 | 0.67±0.15 | 0.2 |
| MTT delay | 0.82±0.08 | 0.75±0.19 | 0.7 | 0.85±0.17 | 0.91±0.07 | 0.2 | 0.84±0.08 | 0.67±0.18 | 0.1 |
| MTT ratio | 0.82±0.08 | 0.75±0.19 | 0.2 | 0.92±0.09 | 0.91±0.07 | 0.7 | 0.79±0.11 | 0.76±0.15 | 0.2 |
| OT | |||||||||
| MTT Abs (seconds) | 8.3±1.3 | 11.0±1.9 | 0.004 | NA | NA | NA | 9.4±2.0 | 11.0±2.7 | 0.2 |
| MTT delay (seconds) | 3.1±2.4 | 3.5±3.3 | 0.6 | 4.3±2.2 | 6.3±3.3 | 0.2 | 4.7±2.5 | 2.7±5.8 | 0.5 |
| MTT ratio (%) | 177±43 | 149±59 | 0.3 | 222±31 | 188±48 | 0.2 | 267±161 | 148±65 | 0.2 |
| 90%-T | |||||||||
| MTT Abs (seconds) | 8.6±1.4 | 13.8±3.5 | 0.002 | NA | NA | NA | 10.3±1.8 | 21.4±16.9 | 0.2 |
| MTT delay (seconds) | 5.3±1.8 | 6.2±3.9 | 0.6 | 6.4±3.4 | 7.4±3.5 | 0.5 | 12.5±12.0 | 19.9±25.0 | 0.6 |
| MTT ratio (%) | 234±58 | 196±71 | 0.3 | 229±64 | 207±76 | 0.5 | 407±331 | 407±424 | 1.0 |
Abs, absolute; AUC, area under the curve; MTT Abs, absolute MTT value; NA, not assessed.
Statistically significant differences are shown in bold face.
Caen Data Set
The main patient characteristics of the Caen sample, as compared with those of the Cambridge sample, are presented in Table 4. The only significant differences between the two samples were with regard to time since onset (shorter in the Caen sample) and age of patients (slightly older). The total number of ROIs was 2,580 on each side of the brain (86±8 per patient). Out of these, 1,224, 462, and 772 ROIs/ROI pairs were below the classic, normalized, and stringent penumbra thresholds, respectively.
Table 4. Descriptive characteristics of the patients in the Caen data set as compared with those in the Cambridge samples.
| Caen (n=30) | Cambridge (n=7) | P-value | |
|---|---|---|---|
| Age, years | 73.6±10.2 | 62.2±20.2 | 0.04 |
| Gender, male | 14 (47%) | 4 (57%) | 0.7 |
| Risk factors | |||
| Hypertension | 17 (57%) | 3 (50%) | 0.7 |
| Hypercholesterolemia | 4 (13%) | 1 (17%) | 1.0 |
| Diabetes | 3 (10%) | 0 (0%) | 1.0 |
| Stroke onset to PET, hours | 10.7±3.6 | 18.6±5.0 | <0.001 |
| Side (left/right) | 15/15 | 2/5 | 0.4 |
| NIHSS scorea | 10 (4–18) | 10 (9–17) | 0.6 |
| Ipsilateral carotid diseaseb | 0.7 | ||
| <50% | 21 (72%) | 5 (57%) | |
| 50% to 99% | 6 (21%) | 2 (29%) | |
| Occlusion | 2 (7%) | 0 | |
NIHSS, National Institutes of Health Stroke Scale; PET, positron emission tomography.
Data are presented as mean±s.d. for continuous variables or n (%) for scale variables.
Clinical scores for the Caen data originally obtained with the Orgogozo scale have been converted to NIHSS scores; data presented are median and interquartile ranges.
One Cambridge patient had an ipsilateral carotid dissection and one from Caen was not assessed.
The means for individual AUCs, OTs, and 90%-Ts for both the Cambridge and Caen data sets are presented in Table 3. There was no significant difference between the individual AUCs from the two samples. With regard to OTs and 90%-Ts, there was again no significant difference between the two samples, save for the absolute MTT for the classic threshold only.
Discussion
In this study, using data derived from quantitative steady-state 15O-PET, we found the MTT to be overall a very good predictor of the penumbra threshold. Indeed, AUCs ranged from 0.79 to 0.92, varying only slightly with the MTT parameter being tested, the penumbra threshold used as reference, and the method of analysis, i.e., individual or common. Importantly, all three MTT parameters tested performed equally well across the three penumbral thresholds, and directly comparing among them using either all ROIs across the whole Cambridge sample or individual subject analysis revealed no statistically significant difference, even though absolute MTT seemed to perform slightly better than the other two. The ‘optimal threshold' was on average ∼8 seconds, 4 seconds, and 200% for absolute MTT, MTT delay, and MTT ratio, respectively, increasing with stringency of the penumbra threshold used. The 90%-Ts were as expected much longer than their OT counterparts. The very good consistency between MTT thresholds computed from the within- and across-subject analyses points to their overall reliability. Finally, the validity of these findings, regarding both AUCs and MTT thresholds, was confirmed using an independent and larger patient sample, with no significant differences between the two cohorts emerging for any variable tested—save for a single MTT parameter against a single penumbra threshold.
As this study is the first to use PET-derived MTT to assess the predictive value of MTT as a surrogate for the penumbra flow threshold, a direct comparison with previous similar work is not possible. However, it is of interest to compare our results with those previous studies that have assessed pMR- and pCT-derived MTT as a potential penumbral marker, some of which used PET- (Takasawa et al, 2008; Zaro-Weber et al, 2010a) or XenonCT-derived CBF (Olivot et al, 2009), and others used diffusion weighted imaging lesion growth (Grandin et al, 2002; Thijs et al, 2001) or final infarction in nonrecanalizing patients (Christensen et al, 2009; Wintermark et al, 2006), as reference. Below, we will first discuss those studies that have assessed AUCs, and then those that have assessed MTT thresholds.
Four previous studies have used AUCs to assess the merits of MTT for identifying the penumbra flow threshold. In one study, comparing pMR with 15O-PET-derived penumbra threshold defined as CBF <20 mL/100 g per min, the AUC for the absolute MTT was 0.86 (Zaro-Weber et al, 2010a). In an ROI-based study using pMR, the AUC for absolute MTT to discriminate diffusion weighted imaging lesion growth from areas of viable hemodynamic disturbances in the diffusion–perfusion mismatch was 0.71 (Grandin et al, 2002). In another similar pMR study, the AUC for MTT delay was 0.78 (Christensen et al, 2009). Our AUCs were overall lower than the former, but higher than the latter two pMR studies. The fourth study, based on pCT (Wintermark et al, 2006), reported an inordinately high AUC of 0.96 for the MTT ratio. Overall, therefore, the AUCs found in this study are well within the range reported in earlier pMR or pCT studies, in turn further supporting the validity of MTT for predicting the penumbra flow threshold.
Our MTT thresholds are generally close to or within previously reported ranges for pMR- or pCT-derived MTT thresholds. For instance, OTs for absolute MTT of 5.3 seconds (Zaro-Weber et al, 2010a), 7 seconds (Wintermark et al, 2006), and 10 seconds (Olivot et al, 2009) have been reported. One study reported an MTT delay threshold of 7.8 seconds (Grandin et al, 2002) and another (Thijs et al, 2001) of >4 to 6 seconds, to be associated with diffusion weighted imaging lesion growth. With regard to MTT ratio, optimal cutoffs of 145% (Wintermark et al, 2006) and 163% (Rohl et al, 2001) have been reported. Our OT values for absolute, delay, and ratio MTT (∼8 seconds, 4 seconds, and 150% to 200%, respectively) are overall comparable with these earlier pMR- or pCT-derived thresholds. This overall consistency between PET and previous pMR and pCT literature strengthens the idea that MTT is a reasonably reliable surrogate for CBF to predict the penumbra flow threshold. In this respect, high specificity thresholds such as the 90%-Ts derived in this study may have a greater clinical relevance than classical OTs, because they imply more stringent criteria for the penumbra before making therapeutic decision (Christensen et al, 2009).
The strengths of this study include the formal validation of the results afforded by the comparison of two distinct and independently acquired patient samples (one of which is of substantial size), otherwise essentially identical with regard to inclusion/exclusion criteria and 15O-PET methodology. Using MTT delay and MTT ratio, no statistically significant difference in AUCs, OTs, or 90%-Ts was found between the two samples for any of the three penumbra thresholds. Using absolute MTT, again there was no significant difference between the two samples for any variable tested apart from the OT and 90%-T for the classic penumbra threshold only (Table 3). This isolated finding may represent a play of chance from multiple comparisons, or small differences in population characteristics (see Table 4) and PET axial field of view. Regardless, the results from the validation cohort do provide strong support to the overall validity of our findings, namely that the MTT is a very good predictor of the penumbra flow threshold, and that all three MTT parameters work equally well. For optimal comparisons between centers, it may however be best to use MTT delay or MTT ratio than absolute MTT as the perfusion variable.
One limitation of this study is that patients were studied a number of hours after stroke onset, which is inevitable when using fully quantitative PET because of the limited accessibility of the technique and the exclusion criteria which for instance include thrombolysis (see the ‘Methods' section). This delay does not undermine the validity of our findings because the penumbra threshold—contrary to the infarction threshold—has been shown to be time independent in nonhuman primates (Astrup et al, 1981; Jones et al, 1981). It is presumed to be so in humans too, based on good evidence from studies using various perfusion modalities and timescales after stroke onset (Baron, 2001b; Heiss, 1992, 2000; Zaro-Weber et al, 2010b). However, the late imaging in our population may have decreased the number of ROIs with penumbral characteristics; therefore, increasing the potential errors in estimating the predictive value of MTT especially when applied at the individual patient level.
In addition to testing using gold-standard PET, the fundamental pathophysiological issue of whether the MTT can reliably predict the penumbra flow threshold in acute stroke, our secondary, more clinical, aim was to inform MR- and CT-based perfusion mapping in the acute setting. Our results suggesting that the MTT is indeed a reasonably reliable surrogate of the penumbra flow threshold provide support to time-based perfusion mapping using MR or CT in the clinical setting—provided appropriate stringent thresholds are used (Donnan et al, 2009). As with MR, the diffusion weighted imaging lesion may represent not only the core but also the penumbral tissue (Guadagno et al, 2006), whereas with CT perfusion, there are inconsistencies regarding a CBV threshold for the core tissue (Murphy et al, 2008; Wintermark et al, 2006), clinically reliable maps of the penumbra and core compartments are still awaited. Defining reliable core markers is therefore an important issue to address in future work.
The authors declare no conflict of interest.
Footnotes
EC was supported by a research grant from the Swiss National Science Foundation (PASSMP3-124262). This study was funded by the Medical Research Council (Grants G0001219 and G0500874 to J-CB). PSJ was supported by the NIHR Cambridge Biomedical Research Centre grant.
References
- Astrup J, Siesjo BK, Symon L. Thresholds in cerebral ischemia—the ischemic penumbra. Stroke. 1981;12:723–725. doi: 10.1161/01.str.12.6.723. [DOI] [PubMed] [Google Scholar]
- Baron JC. Mapping the ischaemic penumbra with PET: a new approach. Brain. 2001a;124:2–4. doi: 10.1093/brain/124.1.2. [DOI] [PubMed] [Google Scholar]
- Baron JC. Perfusion thresholds in human cerebral ischemia: historical perspective and therapeutic implications. Cerebrovasc Dis. 2001b;11 (Suppl 1:2–8. doi: 10.1159/000049119. [DOI] [PubMed] [Google Scholar]
- Baron JC, Frackowiak RS, Herholz K, Jones T, Lammertsma AA, Mazoyer B, Wienhard K. Use of PET methods for measurement of cerebral energy metabolism and hemodynamics in cerebrovascular disease. J Cereb Blood Flow Metab. 1989;9:723–742. doi: 10.1038/jcbfm.1989.105. [DOI] [PubMed] [Google Scholar]
- Bristow MS, Simon JE, Brown RA, Eliasziw M, Hill MD, Coutts SB, Frayne R, Demchuk AM, Mitchell JR. MR perfusion and diffusion in acute ischemic stroke: human gray and white matter have different thresholds for infarction. J Cereb Blood Flow Metab. 2005;25:1280–1287. doi: 10.1038/sj.jcbfm.9600135. [DOI] [PubMed] [Google Scholar]
- Calamante F, Gadian DG, Connelly A. Quantification of perfusion using bolus tracking magnetic resonance imaging in stroke: assumptions, limitations, and potential implications for clinical use. Stroke. 2002;33:1146–1151. doi: 10.1161/01.str.0000014208.05597.33. [DOI] [PubMed] [Google Scholar]
- Christensen S, Mouridsen K, Wu O, Hjort N, Karstoft H, Thomalla G, Rother J, Fiehler J, Kucinski T, Ostergaard L. Comparison of 10 perfusion MRI parameters in 97 sub-6-hour stroke patients using voxel-based receiver operating characteristics analysis. Stroke. 2009;40:2055–2061. doi: 10.1161/STROKEAHA.108.546069. [DOI] [PubMed] [Google Scholar]
- Donnan GA, Baron JC, Ma H, Davis SM. Penumbral selection of patients for trials of acute stroke therapy. Lancet Neurol. 2009;8:261–269. doi: 10.1016/S1474-4422(09)70041-9. [DOI] [PubMed] [Google Scholar]
- Donnan GA, Davis SM. Neuroimaging, the ischaemic penumbra, and selection of patients for acute stroke therapy. Lancet Neurol. 2002;1:417–425. doi: 10.1016/s1474-4422(02)00189-8. [DOI] [PubMed] [Google Scholar]
- Furlan M, Marchal G, Viader F, Derlon JM, Baron JC. Spontaneous neurological recovery after stroke and the fate of the ischemic penumbra. Ann Neurol. 1996;40:216–226. doi: 10.1002/ana.410400213. [DOI] [PubMed] [Google Scholar]
- Gibbs JM, Leenders KL, Wise RJ, Jones T. Evaluation of cerebral perfusion reserve in patients with carotid-artery occlusion. Lancet. 1984;1:182–186. doi: 10.1016/s0140-6736(84)92110-x. [DOI] [PubMed] [Google Scholar]
- Grandin CB, Duprez TP, Smith AM, Oppenheim C, Peeters A, Robert AR, Cosnard G. Which MR-derived perfusion parameters are the best predictors of infarct growth in hyperacute stroke? Comparative study between relative and quantitative measurements. Radiology. 2002;223:361–370. doi: 10.1148/radiol.2232010673. [DOI] [PubMed] [Google Scholar]
- Grubb RL, Jr, Raichle ME, Eichling JO, Ter-Pogossian MM. The effects of changes in PaCO2 on cerebral blood volume, blood flow, and vascular mean transit time. Stroke. 1974;5:630–639. doi: 10.1161/01.str.5.5.630. [DOI] [PubMed] [Google Scholar]
- Guadagno JV, Warburton EA, Jones PS, Day DJ, Aigbirhio FI, Fryer TD, Harding S, Price CJ, Green HA, Barret O, Gillard JH, Baron JC. How affected is oxygen metabolism in DWI lesions? A combined acute stroke PET-MR study. Neurology. 2006;67:824–829. doi: 10.1212/01.wnl.0000233984.66907.db. [DOI] [PubMed] [Google Scholar]
- Hanley JA, McNeil BJ. The meaning and use of the area under a receiver operating characteristic (ROC) curve. Radiology. 1982;143:29–36. doi: 10.1148/radiology.143.1.7063747. [DOI] [PubMed] [Google Scholar]
- Hanley JA, McNeil BJ. A method of comparing the areas under receiver operating characteristic curves derived from the same cases. Radiology. 1983;148:839–843. doi: 10.1148/radiology.148.3.6878708. [DOI] [PubMed] [Google Scholar]
- Heiss WD. Experimental evidence of ischemic thresholds and functional recovery. Stroke. 1992;23:1668–1672. doi: 10.1161/01.str.23.11.1668. [DOI] [PubMed] [Google Scholar]
- Heiss WD. Ischemic penumbra: evidence from functional imaging in man. J Cereb Blood Flow Metab. 2000;20:1276–1293. doi: 10.1097/00004647-200009000-00002. [DOI] [PubMed] [Google Scholar]
- Heiss WD, Kracht LW, Thiel A, Grond M, Pawlik G. Penumbral probability thresholds of cortical flumazenil binding and blood flow predicting tissue outcome in patients with cerebral ischaemia. Brain. 2001;124:20–29. doi: 10.1093/brain/124.1.20. [DOI] [PubMed] [Google Scholar]
- Ito H, Kanno I, Takahashi K, Ibaraki M, Miura S. Regional distribution of human cerebral vascular mean transit time measured by positron emission tomography. Neuroimage. 2003;19:1163–1169. doi: 10.1016/s1053-8119(03)00156-3. [DOI] [PubMed] [Google Scholar]
- Jones TH, Morawetz RB, Crowell RM, Marcoux FW, FitzGibbon SJ, DeGirolami U, Ojemann RG. Thresholds of focal cerebral ischemia in awake monkeys. J Neurosurg. 1981;54:773–782. doi: 10.3171/jns.1981.54.6.0773. [DOI] [PubMed] [Google Scholar]
- Kidwell CS, Saver JL, Mattiello J, Starkman S, Vinuela F, Duckwiler G, Gobin YP, Jahan R, Vespa P, Villablanca JP, Liebeskind DS, Woods RP, Alger JR. Diffusion-perfusion MRI characterization of post-recanalization hyperperfusion in humans. Neurology. 2001;57:2015–2021. doi: 10.1212/wnl.57.11.2015. [DOI] [PubMed] [Google Scholar]
- Marchal G, Furlan M, Beaudouin V, Rioux P, Hauttement JL, Serrati C, de la Sayette V, Le Doze F, Viader F, Derlon JM, Baron JC. Early spontaneous hyperperfusion after stroke. A marker of favourable tissue outcome. Brain. 1996;119 (Pt 2:409–419. doi: 10.1093/brain/119.2.409. [DOI] [PubMed] [Google Scholar]
- Marchal G, Rioux P, Serrati C, Furlan M, Derlon JM, Viader F, Baron JC. Value of acute-stage positron emission tomography in predicting neurological outcome after ischemic stroke: further assessment. Stroke. 1995;26:524–525. [PubMed] [Google Scholar]
- Marcoux FW, Morawetz RB, Crowell RM, DeGirolami U, Halsey JH., Jr Differential regional vulnerability in transient focal cerebral ischemia. Stroke. 1982;13:339–346. doi: 10.1161/01.str.13.3.339. [DOI] [PubMed] [Google Scholar]
- McNeil BJ, Hanley JA, Funkenstein HH, Wallman J. Paired receiver operating characteristic curves and the effect of history on radiographic interpretation. CT of the head as a case study. Radiology. 1983;149:75–77. doi: 10.1148/radiology.149.1.6611955. [DOI] [PubMed] [Google Scholar]
- Murphy BD, Fox AJ, Lee DH, Sahlas DJ, Black SE, Hogan MJ, Coutts SB, Demchuk AM, Goyal M, Aviv RI, Symons S, Gulka IB, Beletsky V, Pelz D, Chan RK, Lee TY. White matter thresholds for ischemic penumbra and infarct core in patients with acute stroke: CT perfusion study. Radiology. 2008;247:818–825. doi: 10.1148/radiol.2473070551. [DOI] [PubMed] [Google Scholar]
- Olivot JM, Mlynash M, Zaharchuk G, Straka M, Bammer R, Schwartz N, Lansberg MG, Moseley ME, Albers GW. Perfusion MRI (Tmax and MTT) correlation with xenon CT cerebral blood flow in stroke patients. Neurology. 2009;72:1140–1145. doi: 10.1212/01.wnl.0000345372.49233.e3. [DOI] [PMC free article] [PubMed] [Google Scholar]
- Rohl L, Ostergaard L, Simonsen CZ, Vestergaard-Poulsen P, Andersen G, Sakoh M, Le Bihan D, Gyldensted C. Viability thresholds of ischemic penumbra of hyperacute stroke defined by perfusion-weighted MRI and apparent diffusion coefficient. Stroke. 2001;32:1140–1146. doi: 10.1161/01.str.32.5.1140. [DOI] [PubMed] [Google Scholar]
- Schumann P, Touzani O, Young AR, Morello R, Baron JC, MacKenzie ET. Evaluation of the ratio of cerebral blood flow to cerebral blood volume as an index of local cerebral perfusion pressure. Brain. 1998;121 (Pt 7:1369–1379. doi: 10.1093/brain/121.7.1369. [DOI] [PubMed] [Google Scholar]
- Sette G, Baron JC, Mazoyer B, Levasseur M, Pappata S, Crouzel C. Local brain haemodynamics and oxygen metabolism in cerebrovascular disease. Positron emission tomography. Brain. 1989;112 (Pt 4:931–951. doi: 10.1093/brain/112.4.931. [DOI] [PubMed] [Google Scholar]
- Sobesky J, Zaro Weber O, Lehnhardt FG, Hesselmann V, Thiel A, Dohmen C, Jacobs A, Neveling M, Heiss WD. Which time-to-peak threshold best identifies penumbral flow? A comparison of perfusion-weighted magnetic resonance imaging and positron emission tomography in acute ischemic stroke. Stroke. 2004;35:2843–2847. doi: 10.1161/01.STR.0000147043.29399.f6. [DOI] [PubMed] [Google Scholar]
- Takasawa M, Jones PS, Guadagno JV, Christensen S, Fryer TD, Harding S, Gillard JH, Williams GB, Aigbirhio FI, Warburton EA, Ostergaard L, Baron JC. How reliable is perfusion MR in acute stroke? Validation and determination of the penumbra threshold against quantitative PET. Stroke. 2008;39:870–877. doi: 10.1161/STROKEAHA.107.500090. [DOI] [PubMed] [Google Scholar]
- Tape TG.2004Interpreting Diagnostic Tests University of Nebraska Medical Center; ; http://darwin.unmc.edu/dxtests / [Google Scholar]
- Thijs VN, Adami A, Neumann-Haefelin T, Moseley ME, Marks MP, Albers GW. Relationship between severity of MR perfusion deficit and DWI lesion evolution. Neurology. 2001;57:1205–1211. doi: 10.1212/wnl.57.7.1205. [DOI] [PubMed] [Google Scholar]
- Wardlaw J. Neuroimaging in acute ischemic stroke: insights into unanswered questions of pathophysiology. J Int Med. 2010;267:172–190. doi: 10.1111/j.1365-2796.2009.02200.x. [DOI] [PubMed] [Google Scholar]
- Wintermark M, Albers GW, Alexandrov AV, Alger JR, Bammer R, Baron JC, Davis S, Demaerschalk BM, Derdeyn CP, Donnan GA, Eastwood JD, Fiebach JB, Fisher M, Furie KL, Goldmakher GV, Hacke W, Kidwell CS, Kloska SP, Kohrmann M, Koroshetz W, Lee TY, Lees KR, Lev MH, Liebeskind DS, Ostergaard L, Powers WJ, Provenzale J, Schellinger P, Silbergleit R, Sorensen AG, Wardlaw J, Wu O, Warach S. Acute stroke imaging research roadmap. Stroke. 2008;39:1621–1628. doi: 10.1161/STROKEAHA.107.512319. [DOI] [PubMed] [Google Scholar]
- Wintermark M, Flanders AE, Velthuis B, Meuli R, van Leeuwen M, Goldsher D, Pineda C, Serena J, van der Schaaf I, Waaijer A, Anderson J, Nesbit G, Gabriely I, Medina V, Quiles A, Pohlman S, Quist M, Schnyder P, Bogousslavsky J, Dillon WP, Pedraza S. Perfusion-CT assessment of infarct core and penumbra: receiver operating characteristic curve analysis in 130 patients suspected of acute hemispheric stroke. Stroke. 2006;37:979–985. doi: 10.1161/01.STR.0000209238.61459.39. [DOI] [PubMed] [Google Scholar]
- Wu O, Ostergaard L, Koroshetz WJ, Schwamm LH, O'Donnell J, Schaefer PW, Rosen BR, Weisskoff RM, Sorensen AG. Effects of tracer arrival time on flow estimates in MR perfusion-weighted imaging. Magn Reson Med. 2003;50:856–864. doi: 10.1002/mrm.10610. [DOI] [PubMed] [Google Scholar]
- Zaro-Weber O, Moeller-Hartmann W, Heiss WD, Sobesky J. The performance of MRI-based cerebral blood flow measurements in acute and subacute stroke compared with 15O-water positron emission tomography: identification of penumbral flow. Stroke. 2009;40:2413–2421. doi: 10.1161/STROKEAHA.108.540914. [DOI] [PubMed] [Google Scholar]
- Zaro-Weber O, Moeller-Hartmann W, Heiss WD, Sobesky J. MRI perfusion maps in acute stroke validated with 15O-water positron emission tomography. Stroke. 2010a;41:443–449. doi: 10.1161/STROKEAHA.109.569889. [DOI] [PubMed] [Google Scholar]
- Zaro-Weber O, Moeller-Hartmann W, Heiss WD, Sobesky J. A simple positron emission tomography-based calibration for perfusion-weighted magnetic resonance maps to optimize penumbral flow detection in acute stroke. Stroke. 2010b;41:1939–1945. doi: 10.1161/STROKEAHA.110.584029. [DOI] [PubMed] [Google Scholar]
- Zweig MH, Campbell G. Receiver-operating characteristic (ROC) plots: a fundamental evaluation tool in clinical medicine. Clin Chem. 1993;39:561–577. [PubMed] [Google Scholar]