Abstract
Introduction. Hepatitis C virus (HCV)–specific T lymphocyte responses have been demonstrated in peripheral blood from injection drug users (IDUs) persistently HCV antibody and RNA negative despite high-risk behavior. We have termed these apparently HCV resistant cases “Exposed Uninfecteds” (EUs), and have studied the evolution of T-cell responses to determine if they are protective in nature.
Methods. Twenty-one EU cases were studied using a questionnaire to ascertain injecting behavior details. Peripheral blood mononuclear cells were isolated from whole blood and an interferon-gamma (IFN-γ) enzyme-linked immunosorbent spot (ELISPOT) assay used to detect T-cell responses to a panel of HCV proteins. EU cases were subdivided by injecting drug patterns into (1) cases in rehabilitation who stopped injecting, (2) prisoners (infrequent/noninjectors), and (3) cases who continued to inject.
Results. EUs continuing to inject had significantly stronger (P < .01) and more frequent (P < .05) HCV-specific IFN-γ ELISPOT responses than controls or noninjecting EUs. EUs in rehabilitation lost their T-cell responses during follow-up, while those continuing to inject maintained them.
Conclusions. HCV-specific T-cell responses in EU cases wane within months of cessation of injection drug use. Maintenance of these T-cell responses appears to be dependent on continuing HCV exposure through injection drug use.
Hepatitis C virus (HCV) infection in developed nations is principally acquired through injection drug use with HCV prevalence rates of up to 90% in some cohorts of injection drug users (IDUs) [1]. We and others have described IDUs who remain uninfected by HCV despite many risk factors and who appear to be resistant to HCV infection [2, 3]. These resistant individuals remain aviremic and seronegative (HCV RNA negative and HCV AB negative) despite a long duration of injecting drug use and likely recurrent HCV exposure. HCV-specific T-cell responses to both structural and nonstructural antigens are often detectable in these individuals, indicating the presence of primed cellular immune responses despite the absence of any evidence of infection [4–9]. These T-cell responses are typically weak, and it remains unclear if they are simply an immunological footprint of HCV exposure or whether they are sufficient to provide some protection from HCV infection.
In an attempt to answer this important question, we have prospectively studied a cohort of aviremic, seronegative injection drug users (hereafter termed exposed uninfecteds or EUs) to define the evolution and maintenance of HCV-specific responses according to current injecting behavior and any association between HCV-specific reactivity and ongoing absence of HCV infection.
METHODS
Study Design and Settings
This study was conducted at the Institute of Bio-Medical Sciences, Peninsula Medical School, in collaboration with the South West Liver Unit at Derriford Hospital (both Plymouth, UK) and continued from our published cross-sectional study [4].
Study Subjects
Study subjects were recruited between January 2005 and January 2008 from a number of sources, including a local prison (Dartmoor Prison) and various needle exchange and community drug services in Plymouth, UK. Only HCV antibody and HCV RNA negative individuals with a substantial history of past or present intravenous drug use and sharing of needles or other drug injection equipment were included. Demographics and details of drug injecting behavior were ascertained by means of a confidential interview with a structured questionnaire, and gathered prospectively into a database. This included age at first injection, duration of injecting behavior, frequency of injecting episodes, current injecting behavior, frequency of sharing intravenous paraphernalia (needles, syringes, filters, spoons, and water), frequency of sharing with a contact known to have HCV infection, and risk of non-IDU HCV exposure.
Exposed uninfected cases were further subdivided into 3 groups by ongoing risk of HCV exposure: Group 1 were cases in a formal rehabilitation program, Group 2 were prisoners, and Group 3 were cases who continued to inject throughout the period of study. Group 1 cases were enrolled in a residential drug rehabilitation program and were not injecting and therefore were unlikely to have ongoing exposure to HCV. Since Group 2 were prison inmates and it is known that prisoners do inject drugs [10–14], these cases may still have been injecting but if so were only likely to be able to do so sporadically due to the limited supply of needles and drugs in prison. Hence, HCV exposure in this group during the period of study was likely to be infrequent. Group 3 continued to inject drugs regularly with the sharing of injecting paraphernalia and therefore were still at risk of recent and regular exposure to HCV.
Virological Testing
The presence or absence of HCV antibodies was determined by third-generation enzyme-linked immunosorbent spot (ELISA) assay (Abbott IMx, Abbott Diagnostics), and HCV RNA by commercially available qualitative PCR (Amplicor, Roche) with a lower detection limit of 50 IU/mL. HCV testing was done on the same day as the ELISPOT assay.
Isolation of Peripheral Blood Mononuclear Cells
Methods used in the isolation of peripheral blood mononuclear cells (PBMCs), cell culture, and ELISPOT analysis and readings were as previously described [4]. Briefly, PBMCs were isolated from fresh whole blood and cultured in RPMI 1640 media (Invitrogen) supplemented with 10% Human AB serum (Gemini Bio Products), 1% benzyl penicillin, 1% l-glutamine (Invitrogen), 23 mmol/L of HEPES solution, and 6 mmol/L sodium hydroxide. PBMCs were cultured in 96-well round-bottomed plates with recombinant hepatitis C proteins at a final concentration of 2 μg/mL. The HCV antigens were purified recombinant proteins from genotype 1B. The proteins used were Core (aa1-115), NS3 (aa1007-1534), NS4 (aa1617-1864), and NS5a (aa2006-2264) (Mikrogen). Diftavax (adsorbed diphtheria and tetanus vaccine; Aventis Pasteur MSD) and phytohaemagglutinin (PHA; Sigma) were used as positive controls at concentrations of .016 IU and 1 μg/ml, respectively. Unstimulated cells with media only were used as negative controls. Cells were incubated between 18 and 22 h in a 5% CO2 incubator at 37°C.
ELISPOT Assay and Interpretation
The ELISPOT plates (MAIPS4510) were prepared according to the manufacturer's instructions (BD Biosciences) and PBMCs were transferred after incubation. The plates were washed and blocked the next day, and underwent a series of steps of layering the plates with secondary antibodies, streptavidin, and aminoethyl-carbazole (AEC) reagent. Spots were counted with an automated AutoImmun Diagnostika GMBH counter. Studies where negative control wells (medium alone) had more than 5 spots were excluded from the analysis to prevent over-interpretation of nonspecific cell activation and cytokine production. The mean number of spots from each triplicate of control wells were subtracted from the mean number of spots from the antigen-stimulated wells, and the results were expressed as spot-forming units (SFUs) per million cells. Responses were deemed positive if the mean number of spots in the antigen-treated wells was greater than the mean plus 2 standard deviations of that in corresponding controls cases. An ELISPOT assay for an individual was considered positive if any of the HCV antigen-treated wells were above this defined threshold. For the evolution of HCV-specific T-cell responses, the sum of ELISPOT responses to all 4 antigens were compared, both between the EU groups and with the control group who had no risk of HCV exposure. This was done as the ELISPOT responses to individual antigens were weak in all study groups.
Statistical Analysis
The SPSS (Statistical Package for Social Sciences) software, version 14.0 was used for all analyses. Statistical analysis was done using the Mann-Whitney and Kruskal-Wallis tests for nonparametric data, and chi-square and Fisher exact tests for categorical data. P values of <.05 were considered statistically significant and reported as follows: *P < .05, ** P < .01, and ***P < .001.
Ethics
This study was approved by the local research ethics committee; informed consent was obtained from study subjects, healthy volunteers, and HCV infected comparison groups.
RESULTS
Study Subjects
Exposed Uninfecteds.
In total, 21 EU cases (3 females and 18 males) agreed to participate and attended for longitudinal study with serial testing for HCV-specific cellular immune responses. They were divided into 3 groups of 7 according to likely ongoing HCV exposure.
Of the 60 ELISPOT assays undertaken, 4 were discounted as the control wells (without antigen) had greater than 5 spots, indicating nonspecific cell activation and cytokine secretion. This left 56 assays for analysis from 21 individuals, who were studied between 2 and 6 times each (median 2). The maximum duration of follow-up was 12 months with a mean interval between observations of 15 weeks (range 5–37 weeks). Mean duration of IDUs was 8.6 years with a median of over 8500 injection episodes (see Table 1 for details).
Table 1.
Demographic Details of EU Cases and Controls
| Variable measured | Exposed uninfecteds (n = 21) | Controls (n = 7) |
| Age (mean [SD], range) | 29.7 ± 5.9 | 28.3 ± 4.3 |
| Gender (male:female) | 18:3 | 6:1 |
| Number of test | 56 | 20 |
| Number of observations [median, (range)] | 2 (2–6) | 3 (2–3) |
| Interval between studies (range) | 5 weeks to 9 months | 3 weeks to 15 months |
| Duration of IDU [mean (SD), (range)] | 8.6 ± 7.4 (0.5–26 years) | |
| Lifetime injecting episodes [median, (range)] | 8760 (548–28,470) | |
| Sharing injecting paraphernalia | 21 (100%) | |
| Shared needles | 18 (85%) | |
| Shared with a confirmed source of HCV | 9 (43%) |
NOTE. EU: exposed uninfected; HCV: hepatitis C virus.
Healthy controls.
Seven healthy volunteers, matched for sex distribution (1 female, 6 males), were recruited from medical school and hospital staff, and 20 ELISPOT assays performed. Six were studied on 3 occasions and 1 was tested twice. The total follow-up period was up to 15 months. The demographic details of the recruited cases and controls are tabulated in Table 1 for comparison.
Results of IFN-γ ELISPOT Responses
Frequency of Positive IFN-γ ELISPOT Responses.
EU cases were significantly more likely to have demonstrable HCV-specific T-cell responses than controls—33% (18/56) of ELISPOT assays were positive in EUs compared with 10% (2/20) of controls (P < .05). An ELISPOT assay was considered positive if any of the 4 HCV antigens induced a response. Each of the ELISPOT assays looked at responses to 4 HCV antigens; for EU cases overall, 224 (4 × 56) ELISPOT responses were measured and 80 (4 × 20) were measured for controls. In EU cases, 12% (29/224) of all ELISPOT responses to individual antigens elicited a positive test compared with 4% (3/80) in controls (P < .05) (Table 2). Multispecific T-cell responses to 2 or more HCV antigens were seen in 8/56 (15%) studies compared with 1 of the 20 control studies (5%). NS3 (a nonstructural, HCV-encoded protein) elicited the strongest response in terms of SFU/million cells and also the greatest number of individual responses (see Table 2 for details).
Table 2.
Number of ELISPOT Positive Results to Individual Antigens (%) in Controls and E U Subgroups
| Study groups | Core | NS3 | NS4 | NS5 | Total |
| Controls | 1/20 (5) | 1/20 (5) | 1/20 (5) | 0/20 (0) | 3/80 (4) |
| Rehabilitation | 0/17 (0) | 0/17 (0) | 2/17 (12) | 1/17 (6) | 3/68 (4) |
| Prisoners | 1/23 (4) | 7/23 (30) | 3/23 (13) | 5/23 (21) | 16/92 (17) |
| Continued IDUs | 1/16 (6) | 5/16 (31) | 2/16 (13) | 2/16 (13) | 10/64 (16) |
| All EUs combined | 2/56 (4) | 12/56 (23) | 7/56 (13) | 8/56 (14) | 29/224 (13) |
NOTE. ELISPOT: Enzyme linked immunosorbent spot; EU: exposed uninfected; IDUs: intravenous drug users.
Frequency of IFN-γ ELISPOT Responses on Subset Analysis in Exposed Uninfecteds and Controls.
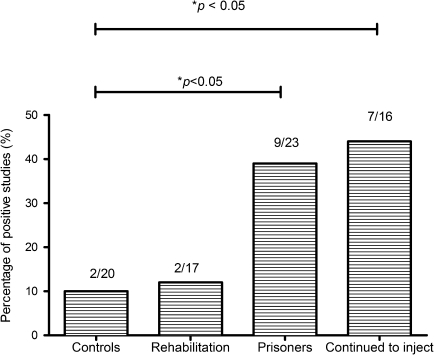
Figure 1 shows the breakdown of the total number of repeated tests and the proportions of positive IFN-γ ELISPOT assays among the 3 EU subsets. EUs who continued to inject drugs (9/23) or were in prison (7/16) had a significantly higher proportion of ELISPOT-positive responses to HCV antigens than either EUs in rehabilitation (2/17, P < .05) or controls (2/20).
Figure 1.
Breakdown of the total number of repeated tests and the proportions of positive IFN-γ assays among the 3 subsets. Those EUs who continued to inject or were in prison had a significantly higher proportion of ELISPOT positive assays to HCV antigens than EUs in rehabilitation or the controls (*P < .05).
NOTE. IFN-γ: interferon gamma; EUs: exposed uninfecteds; ELISPOT: Enzyme linked immunosorbent spot; HCV: hepatitis C virus; DU: drug user.
Evolution of IFN-γ ELISPOT Responses on Subset Analysis of Exposed Uninfecteds.
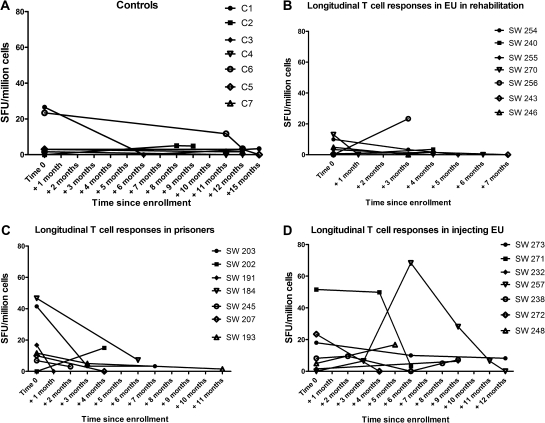
Figures 2A-D shows the sum of SFU counts and changes in HCV-specific T-cell responses with time. Only 2 controls demonstrated an ELISPOT response on first testing, and this was not found on subsequent testing. Overall, 7/35 repeat studies were positive in the 3 EU groups compared with 0/13 controls. Group 1 EU cases (rehabilitation) mostly lost IFN-γ responses, Group 2 cases (prisoners) demonstrated a reduction in the total IFN-γ responses, whereas Group 3 (ongoing IDUs) maintained detectable ELISPOT responses.
Figure 2.
(A) Longitudinal T-cell responses in controls. (B) Longitudinal T-cell responses in EUs in rehabilitation. (C) Longitudinal T-cell responses in EUs in prisons. (D) Longitudinal T-cell responses in EUs who continued to inject.
NOTE. EUs: exposed uninfecteds; SFU: spot-forming unit.
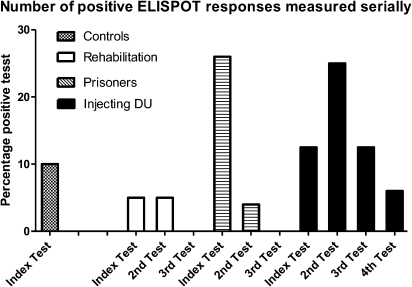
Figure 3 shows the proportion of positive tests at the index testing during the study period followed by the proportion of positive test on subsequent testing. Controls did not have any positive ELISPOT tests on subsequent testing. Group 1 (rehabilitation) and Group 2 (prisoners) cases had a smaller proportion of positive tests on subsequent testing, and those who continued to inject maintained detectable proportions of HCV-specific T-cell responses.
Figure 3.
Proportion of IFN-γ ELISPOT positive assays on repeat testing.
NOTE. IFN-γ: interferon gamma; ELISPOT: Enzyme linked immunosorbent spot; DU: drug user.
IFN-γ ELISPOT Responses and Time Since Last Injection Drug use and Possible HCV Exposure.
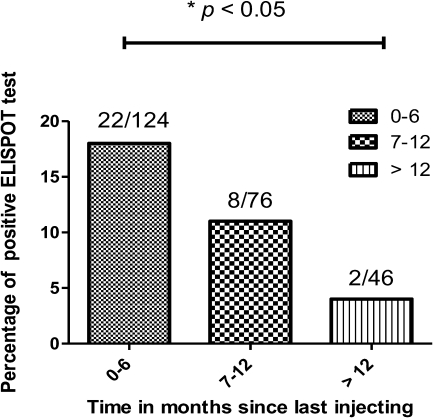
All 7 EUs in rehabilitation reported sharing needles or other drug injecting paraphernalia prior to entering the rehabilitation program but not while on the program. The time since cessation of injecting drug use ranged from 1 week to 36 months prior to entering rehabilitation. Self-reported injection drug use in prison was rare, with the one prisoner who reported injecting drugs in prison doing so only when an inmate he had been injecting with tested positive for HCV. However, full disclosure is unlikely and self-reporting is likely to underestimate their current injecting risk [15], although all reported injecting prior to incarceration (range 1–10 months prior to enrolment). Figure 4 shows the frequency of positive ELISPOT responses plotted against the time since last reported injection episode. ELISPOT responses were less frequent 6 months or more after last injection, with 8/76 (11%) positive responses compared with 22/124 (18%) of those who had injected within the last 6 months. Those who reported a period of greater than 12 months since last injection had 2/46 (5%) positive ELISPOT responses and were significantly less than those who injected within the last 6 months (22/124 [18%], P < .01).
Figure 4.
Frequency of ELISPOT positive responses in a time dependent manner. The frequency of positive responses decrease with time since last injection, and significantly less frequent after 12 months.
NOTE. ELISPOT: Enzyme linked immunosorbent spot.
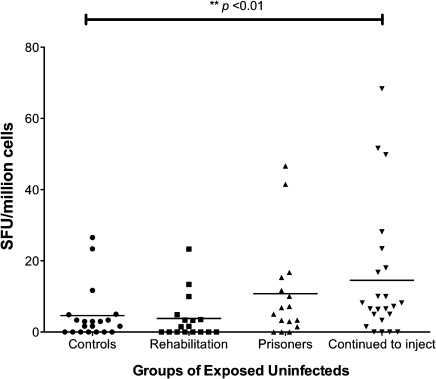
The cumulative strength of responses to HCV antigens were also analyzed and compared among controls and the 3 subsets of exposed uninfected cases. The overall strength of responses when measured as a continuous variable was significantly greater among EUs who continued to inject than controls, but not in those in rehabilitation or prison. Figure 5 shows a scatter plot diagram comparing the 4 groups.
Figure 5.
Sum of IFN-γ ELISPOT responses to all 4 HCV antigens among the 3 EU groups and controls at all time points. EU cases who continued to inject had a significantly stronger response to HCV antigens than the other groups (**P < .01).
NOTE. IFN-γ: interferon gamma; ELISPOT: Enzyme linked immunosorbent spot; HCV: hepatitis C virus; EU: exposed uninfected.
Longitudinal Virological Testing.
All EU cases were tested for detectable HCV RNA and HCV antibody at each study. No cases of HCV viremia were detected at any time point, and no cases of HCV antibody seroconversion occurred in any of the 3 exposed groups.
DISCUSSION
In the United Kingdom (UK), injection drug use remains the single most important risk factor for acquisition of hepatitis C infection, estimated to be responsible for more than 90% of all newly acquired infections [1]. Indeed, the prevalence of HCV amongst IDUs ranges between 40%–90% [1,16–18]. We actively sought, categorized, and prospectively followed up a cohort of seronegative, aviremic injecting drug users who remained uninfected by HCV despite high-risk injecting behavior. These apparently resistant, exposed uninfected cases were divided into three groups according to likely ongoing HCV exposure from their current pattern of drug use.
Using a sensitive ELISPOT assay, we have demonstrated that low-level IFN-γ responses to both structural and nonstructural HCV antigens are found significantly more frequently in EU cases than healthy controls. This is in line with previously reported work [4], but of interest is that the longitudinal study offers further confirmation that these HCV-specific responses are real and not simply cross-reactivity with some other homologous antigen, as they were present only on repeat testing of EU cases and not controls.
Among exposed uninfected cases, those individuals not in rehabilitation (ie, individuals who were still injecting or in prison) demonstrated significantly more frequent IFN-γ responses to HCV antigens than those that had stopped injecting. This suggests that ongoing injecting behavior in the community or in prison is priming these T-cell responses. Further, on longitudinal follow-up, EU cases continuing to inject were significantly more likely to maintain a detectable ELISPOT response than those who stopped injecting. Prisoners initially had similar levels of detectable responses to ongoing injection drug users, but these diminished on follow-up, consistent with the much reduced injection frequency or cessation of drug use they reported while in prison. Overall, the frequency of ELISPOT responses wanes with the time since last reported episode of injection drug use. Our findings suggest that both continued injecting behavior is required to maintain these weak HCV-specific T-cell responses, and that these responses are short-lived, being lost within months of ceasing drug injecting.
The relevance of these weak and temporary cellular immune responses to protective immunity is uncertain. No incident cases of HCV infection were identified in our longitudinal follow-up to ascertain if the presence or absence of such responses correlated. In the context of repeated exposure to small innocula of HCV from injection drug use, the T-cell response demonstrable in peripheral blood may be a marker of a primed response that can be rapidly augmented upon re-exposure, sufficient to provide a degree of protective immunity. With the loss of priming of this response in the absence of ongoing HCV exposure, the T-cell response becomes unmeasurable by our assay.
This longitudinal study suggests that these responses require constant priming from continued injection drug use in order to be maintained and to provide any role as protective immunity, and that without this priming effect, these responses may wane and render the individual just as susceptible to infection as others. Analogous studies in apparently HIV-resistant Kenyan sex workers are of interest. These sex workers lived and worked in an HIV endemic area and were noted to have weakly demonstrable T-cell responses to HIV. However, after abstinence from sexual activity for a period greater than 2 months, they lost their demonstrable anti-HIV T-cell responses, and in some cases underwent subsequent HIV seroconversion, suggesting that constant antigen exposure was required to maintain these potentially protective immune responses [19, 20].
It seems plausible that in our cohort, cellular immune responses in isolation represent HCV exposure without the establishment of overt infection, and that frequent priming may be required in order to maintain these responses. The weak nature and transience of these responses suggest that any protection provided could well be overcome with a larger inoculum or after a period away from injection drug use.
In conclusion, EU cases show weak HCV-specific T-cell responses to a variety of HCV antigens that wane within months of cessation of HCV exposure. Maintenance of these T-cell responses appears to be dependent on continuing HCV exposure through injection drug use. Whether these T-cell responses merely indicate priming of the immune system by a subinfectious inoculum of HCV or a response that is able to prevent infection becoming established still remains to be clarified.
Funding
This work was supported by a National Health Service Research and Development Grant R/19/04.01.
Acknowledgments
The authors would like to thank Dr. Shilpa Chokshi and Prof. Nikolai Naoumov from the Institute of Hepatology, University College London for their help in refining the ELISPOT assay.
References
- 1.Tseng FC, O'Brien TR, Zhang M, et al. Seroprevalence of hepatitis C virus and hepatitis B virus among San Francisco injection drug users, 1998 to 2000. Hepatology. 2007;46:666–71. doi: 10.1002/hep.21765. [DOI] [PMC free article] [PubMed] [Google Scholar]
- 2.Hegazy D, Thurairajah P, Metzner M, et al. Interleukin 12B gene polymorphism and apparent resistance to hepatitis C virus infection. Clin Exp Immunol. 2008;152:538–41. doi: 10.1111/j.1365-2249.2008.03655.x. [DOI] [PMC free article] [PubMed] [Google Scholar]
- 3.Zeremski M, Shu MA, Brown Q, et al. Hepatitis C virus-specific T-cell immune responses in seronegative injection drug users. J Viral Hepat. 2009;16:10–20. doi: 10.1111/j.1365-2893.2008.01016.x. [DOI] [PMC free article] [PubMed] [Google Scholar]
- 4.Thurairajah PH, Hegazy D, Chokshi S, et al. Hepatitis C virus (HCV)–specific T cell responses in injection drug users with apparent resistance to HCV infection. J Infect Dis. 2008;198:1749–55. doi: 10.1086/593337. [DOI] [PubMed] [Google Scholar]
- 5.Freeman AJ, French RA, Post JJ, et al. Prevalence of production of virus-specific interferon-gamma among seronegative hepatitis C-resistant subjects reporting injection drug use. J Infect Dis. 2004;190:1093–7. doi: 10.1086/422605. [DOI] [PubMed] [Google Scholar]
- 6.Koziel MJ, Wong DK, Dudley D, et al. Hepatitis C virus-specific cytolytic T lymphocyte and T helper cell responses in seronegative persons. J Infect Dis. 1997;176:859–66. doi: 10.1086/516546. [DOI] [PubMed] [Google Scholar]
- 7.Meyer MF, Lehmann M, Cornberg M, et al. Clearance of low levels of HCV viremia in the absence of a strong adaptive immune response. Virol J. 2007;4:58. doi: 10.1186/1743-422X-4-58. [DOI] [PMC free article] [PubMed] [Google Scholar]
- 8.Mizukoshi E, Eisenbach C, Edlin BR, et al. Hepatitis C virus (HCV)–specific immune responses of long-term injection drug users frequently exposed to HCV. J Infect Dis. 2008;198:203–12. doi: 10.1086/589510. [DOI] [PMC free article] [PubMed] [Google Scholar]
- 9.Post JJ, Pan Y, Freeman AJ, et al. Clearance of hepatitis C viremia associated with cellular immunity in the absence of seroconversion in the hepatitis C incidence and transmission in prisons study cohort. J Infect Dis. 2004;189:1846–55. doi: 10.1086/383279. [DOI] [PubMed] [Google Scholar]
- 10.Allwright S, Bradley F, Long J, et al. Prevalence of antibodies to hepatitis B, hepatitis C, and HIV and risk factors in Irish prisoners: results of a national cross sectional survey. BMJ. 2000;321:78–82. doi: 10.1136/bmj.321.7253.78. [DOI] [PMC free article] [PubMed] [Google Scholar]
- 11.Hellard ME, Hocking JS, Crofts N. The prevalence and the risk behaviours associated with the transmission of hepatitis C virus in Australian correctional facilities. Epidemiol Infect. 2004;132:409–15. doi: 10.1017/s0950268803001882. [DOI] [PMC free article] [PubMed] [Google Scholar]
- 12.Malliori M, Sypsa V, Psichogiou M, et al. A survey of bloodborne viruses and associated risk behaviours in Greek prisons. Addiction. 1998;93:243–51. doi: 10.1046/j.1360-0443.1998.9322438.x. [DOI] [PubMed] [Google Scholar]
- 13.Stark K, Bienzle U, Vonk R, et al. History of syringe sharing in prison and risk of hepatitis B virus, hepatitis C virus, and human immunodeficiency virus infection among injecting drug users in Berlin. Int J Epidemiol. 1997;26:1359–66. doi: 10.1093/ije/26.6.1359. [DOI] [PubMed] [Google Scholar]
- 14.Weild AR, Gill ON, Bennett D, et al. Prevalence of HIV, hepatitis B, and hepatitis C antibodies in prisoners in England and Wales: a national survey. Commun Dis Public Health. 2000;3:121–6. [PubMed] [Google Scholar]
- 15.Bird AG, Gore SM, Hutchinson SJ, et al. Harm reduction measures and injecting inside prison versus mandatory drugs testing: results of a cross sectional anonymous questionnaire survey. The European Commission Network on HIV Infection and Hepatitis in Prison. BMJ. 1997;315:21–4. doi: 10.1136/bmj.315.7099.21. [DOI] [PMC free article] [PubMed] [Google Scholar]
- 16.Backmund M, Meyer K, Wachtler M, et al. Hepatitis C virus infection in injection drug users in Bavaria: risk factors for seropositivity. Eur J Epidemiol. 2003;18:563–8. doi: 10.1023/a:1024603517136. [DOI] [PubMed] [Google Scholar]
- 17.Garfein RS, Doherty MC, Monterroso ER, et al. Prevalence and incidence of hepatitis C virus infection among young adult injection drug users. J Acquir Immune Defic Syndr Hum Retrovirol. 1998;1 doi: 10.1097/00042560-199802001-00004. [DOI] [PubMed] [Google Scholar]
- 18.Roy KM, Hutchinson SJ, Wadd S, et al. Hepatitis C virus infection among injecting drug users in Scotland: a review of prevalence and incidence data and the methods used to generate them. Epidemiol Infect. 2007;135:433–42. doi: 10.1017/S0950268806007035. [DOI] [PMC free article] [PubMed] [Google Scholar]
- 19.Kaul R, Dong T, Plummer FA, et al. CD8(+) lymphocytes respond to different HIV epitopes in seronegative and infected subjects. J Clin Invest. 2001;107:1303–10. doi: 10.1172/JCI12433. [DOI] [PMC free article] [PubMed] [Google Scholar]
- 20.Kaul R, Rutherford J, Rowland-Jones SL, et al. HIV-1 Env-specific cytotoxic T-lymphocyte responses in exposed, uninfected Kenyan sex workers: a prospective analysis. AIDS. 2004;18:2087–9. doi: 10.1097/00002030-200410210-00015. [DOI] [PubMed] [Google Scholar]


