Abstract
A segmented k-space acquisition technique using non-interleaved velocity encodings is presented to reduce spatial and temporal blur in phase-contrast cardiovascular magnetic resonance imaging. A translating phantom with pulsatile flow was used to simulate imaging of coronary arteries on a 1.5-T GE Echospeed scanner, using both interleaved and non-interleaved velocity encodings. The results demonstrate that the use of non-interleaved velocity encodings reduces spatial and temporal blur by improving the temporal resolution.
Keywords: phase contrast, coronary flow, blood flow, blood velocity, segmented k-space
Introduction
Phase-contrast MRI measurements of epicardial coronary artery flow are useful in identifying inappropriate augmentation of coronary blood flow after exercise or vasodilation induced stress1, 2. Absolute measures of arterial mean and phasic flow are difficult to acquire due to rapid motion of the heart (causing spatial blur) and rapid changes in the coronary artery flow waveform (causing temporal blur)3, 4. We propose a new segmented k-space gradient-echo acquisition technique using non-interleaved velocity encodings which improves the temporal resolution by a factor of two, thus reducing both spatial and temporal blur5.
Background and Theory
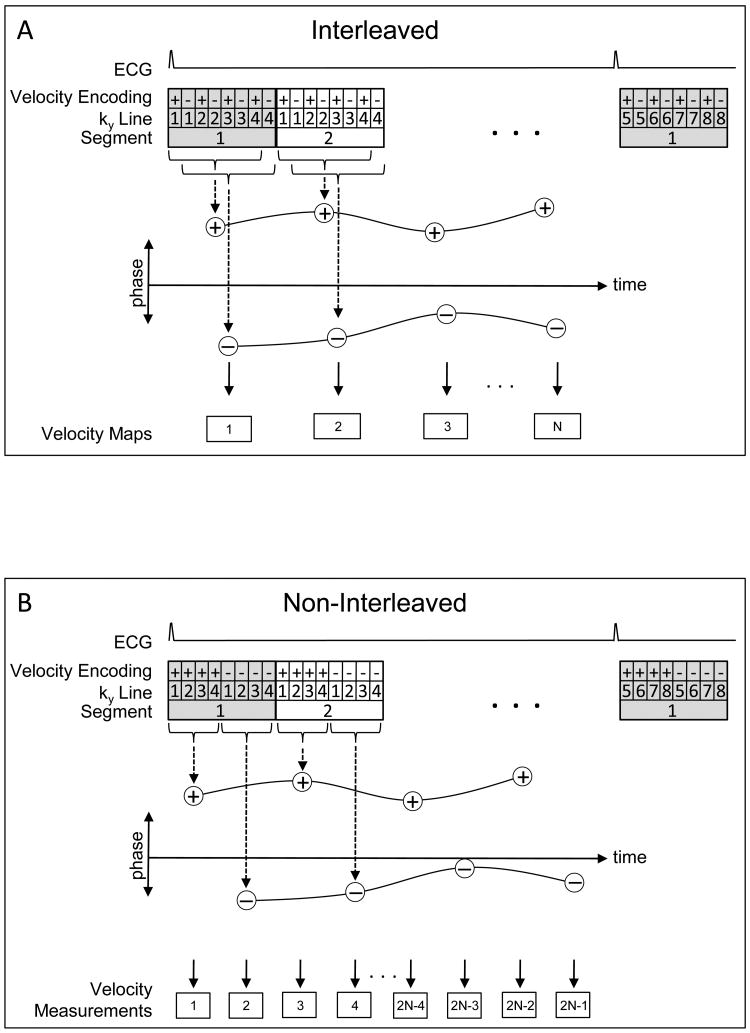
MR phase contrast coronary flow measurements typically utilize k-space segmentation in order to maintain a manageable breathhold time (10-20 seconds)6. As shown in Figure 1A, the positive (+) and negative (−) velocity encodings for a given segment (shown as 4 views per segment [VPS]) are typically interleaved, + − + − + − + −, producing a temporal window of 2×VPS× Repetition Time (TR). By interleaving the encodings, the 2 spatially reconstructed + and − velocity encoded images cover the same temporal span (offset by a single TR), thus providing temporally well-matched frames in the heart cycle, allowing straightforward phase subtraction.
Figure 1.
Comparison of the acquisition strategies for the interleaved (A) and non-interleaved (B) velocity encoding phase-contrast techniques. (A) Temporal window for each velocity/magnitude pair is 7 TRs (time to collect all positive or all negative encodings) with a 1TR offset between positively and negatively velocity encoded images, providing velocity measurements every 8 TRs. (B) Temporal window for each image is 4 TRs with a 4TR offset between positively and negatively velocity encoded images, which, with appropriate processing of ROIs, produces velocity measurements every 4 TRs. Phase-difference is derived from subtracting spline curves fit between the two sets of data points.
We propose the use of non-interleaved velocity encodings, + + + + − − − −, producing a reduced temporal window of VPS×TR for each positive and negative velocity encoded image. However, the two images now have a temporal separation of VPS×TR, precluding simple phase subtraction to generate a velocity map since the heart has moved. Since we are primarily interested in determining the average luminal velocity and flow, the procedure outlined in Figure 1B can be employed. After spatial reconstruction of the positive and negative velocity encoded images, a correlation-shift technique is employed in which the user places a region of interest (ROI), at 50% intensity, delineating the vessel lumen on the magnitude image of the first frame and a spatial cross-correlation is performed between that ROI's bounding box and a region of the second image that is twice as large. The peak of the cross-correlation identifies the location of the lumen in the second frame. The ROI is copied to this position in the second frame. This cross-correlation procedure is automatically repeated for all frames in the series.
Once the lumen is identified on all frames of the magnitude images, several options are possible for determining the mean luminal velocity and flow. The first method would register each pair of positive and negative encodings by shifting one of the images so that the lumens are at the same position and perform a standard phase subtraction to produce a velocity map for each temporal frame. This would result in velocity maps that are only registered at the lumen of the vessel. Another option would be to not produce velocity maps, but rather, determine the mean luminal velocities in the positive and negative encodings and subtract these two velocities to produce a single number for each frame, the mean luminal velocity.
Note that the previous two procedures would correct for motion blur by registration of the positive and negative encodings. They do not, however, correct for temporal blur of the phasic velocity waveform since the positive and negative encodings are separated in time by VPS×TR, thus different velocity distributions can be present in the positive and negative encodings. Recognizing this, the procedure of choice uses spline curves that are fit between the data points of the two sets of positive and negative mean luminal velocities (Figure 1B). The difference between the two spline curves is then calculated; this difference provides an estimate of the mean luminal velocity at all points in the simulated heart cycle, with improved temporal resolution over current techniques.
Materials and Methods
Imaging
Imaging was performed on a 1.5T GE Echospeed scanner (General Electric, Milwaukee, WI) equipped with 40 mT/m gradients of slew rate 150 mT/m/s. A computer-controlled flow pump7 (UHDC, Shelley Medical Imaging Technologies, Ontario, CA) was used to deliver pulsatile flow (peak flow of 20 ml/sec, corresponding to mean luminal velocity of 555 mm/sec) through a phantom (Figure 2A) consisting of a 6mm tube embedded in gelatin (Knox Gelatine, Kraft Foods, Glenview, IL) of concentration 7 gm gelatin per 250 ml water. The phantom was mounted on a motion platform and attached to a motor-driven cam using a 4 meter rigid plastic rod (Figure 2B). The motor and the scanner were triggered by the flow pump, thus synchronizing the scan acquisition to the motion of the phantom. The flow tube was oriented right-to-left in the bore, and sagittal phase-contrast images with 300 cm/sec velocity encoding (VENC) were acquired with both interleaved and non-interleaved velocity encodings in the z-direction. Twenty-six frames were acquired over a single simulated heart cycle with 80mm displacement for heart rates of sixty beats per minute (at 2 VPS) and thirty beats per minute (at 4 VPS). A third set of measurements were taken at an intermediate heart rate of forty-five beats per minutes with 34 frames acquired over a single simulated heart cycle with 80mm displacement at 2 VPS. The peak velocities of the phantom's cyclic motion for 30, 45, and 60 bpm were 116, 174, and 232 mm/sec respectively, corresponding to physiologic velocities of motion of coronary arteries3. Five measurements were performed at each heart rate for both interleaved and non-interleaved acquisitions. The three heart rates were selected due to limitations of the phantom hardware in achieving higher heart rates. Other parameters during the phase-contrast acquisitions included 256×256 matrix, 20cm field of view, 8mm slice thickness, flip angle of 30 degrees, a TR of 8.6 msec and a TE of 5.0 msec. The fluid was a 60% water and 40% glycerin mixture doped with Gd-DPTA to simulate the viscosity and MR relaxation properties of blood. A Transonic (Transonic Systems, Ithaca, NY) ultrasound flow meter captured the flow waveform at the inlet to the phantom (Figure 2B).
Figure 2.
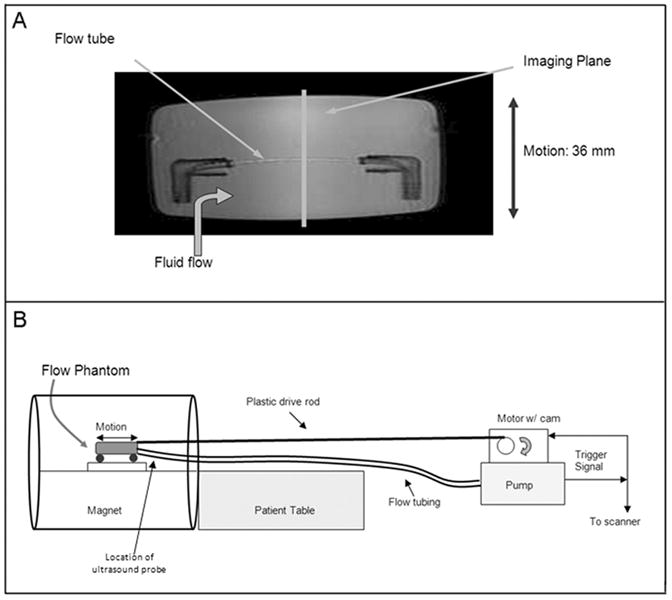
(A) A 6mm diameter flow tube was embedded in gelatin in a plastic container which could be moved in a back-and-forth manner by a motor triggered in synchrony with the flow. This phantom provides a simulation of both motion and pulsatile flow as exhibited by the coronary arteries. (B) The flow pump and motor were placed two meters beyond the foot of the patient table with the plastic drive shaft and flow tubing running to the phantom in the magnet. The flow pump triggered the scanner and the motor for synchronized flow, motion, and acquisition.
Analysis
Interleaved velocity encoded images were reconstructed on the scanner. The resultant magnitude and velocity images, along with the raw data for the non-interleaved images, were transferred to an offline computer for subsequent analysis using Matlab (The Mathworks, Natick, MA). The phase maps for the interleaved scans were analyzed in standard fashion to produce the phasic velocity and flow waveforms by placement of ROIs and extraction of mean velocity and area. After spatial reconstruction of the positive and negative encoded images of the non-interleaved scan, the procedure outlined in the previous section was applied to produce the non-interleaved phasic velocity and flow waveform.
Results
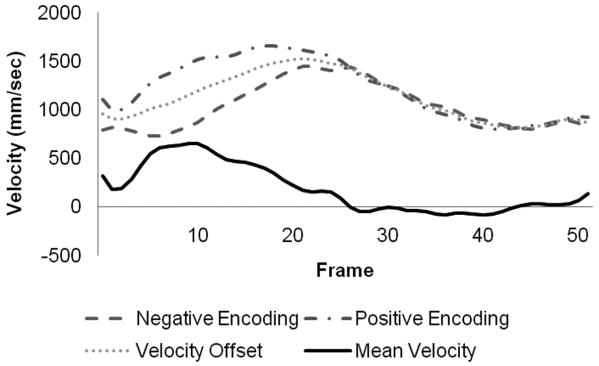
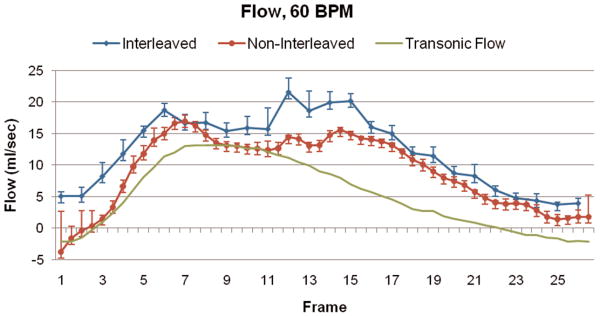
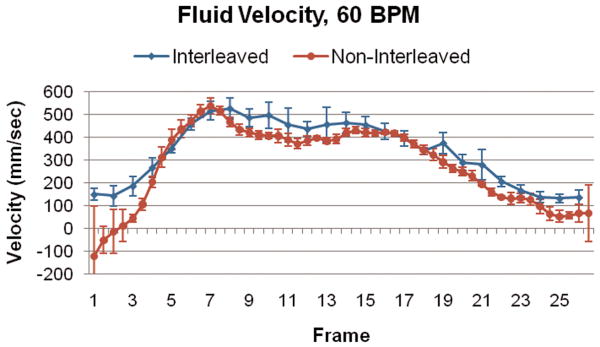
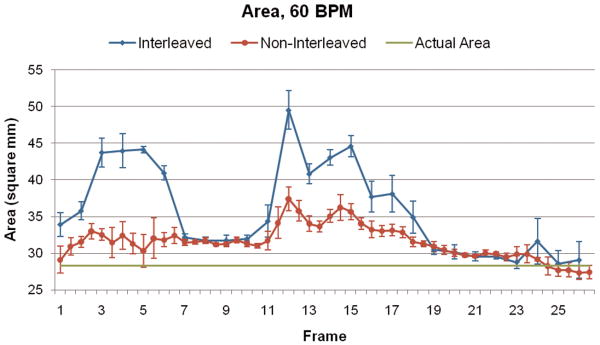
Figure 3 illustrates the spatial blur due to motion present in the image obtained using interleaved velocity encodings, and the significant reduction of spatial blur in the non-interleaved velocity encoding images. If the ROI is drawn at the point of 50% intensity, as is typical in flow analysis8, the ROI is highly elliptical in the interleaved image (Figure 3, left), resulting in overestimation of vessel area as well as inaccurate mean velocity, hence inaccurate flow. The non-interleaved strategy provides a less elliptical lumen (Figure 3, right) throughout the heart cycle, resulting in more accurate computation of lumen area, mean velocity and flow. Blurring of the noise (noise averaging) can be appreciated in the interleaved scan (Figure 3, left), however, this provides just modest additional noise averaging since lumen averaging of pixels is already being used for determination of lumen velocity and flow. The measured luminal velocity for each frame in the positive and negative encodings, as well as the difference between the two (the mean velocity of flow), are shown in Figure 4 for one of the 60 beats per minute experiments. Also shown is the midline of the two encodings, which is an estimate of the background phase shift. The results for the data taken at 60 beats per minute are shown in Figure 5 as mean ± std dev. Figure 5A presents the calculated flow for the interleaved and non-interleaved scans. The true flow, as delivered by the computer-controlled flow pump is shown as well (transonic flow). Figure 5B shows the velocity of motion of the phantom over the course of the simulated heart cycle. As expected, the larger temporal window of the interleaved scan results in underestimation of fluid velocity (Figure 5C), due to temporal blur, and overestimation of the area (Figure 5D), due to spatial blur. Note the severe overestimation of mean flow during high flow, which coincides with rapid motion of the phantom. Since flow is the product of area and velocity, the overestimation of the area during periods of high fluid velocity dominates the underestimation of mean lumen velocity, resulting in the flow being overestimated. The mean flow for all heart rates is shown in Figure 6 indicating the significant improvement in flow measurements using non-interleaved velocity encodings.
Figure 3.
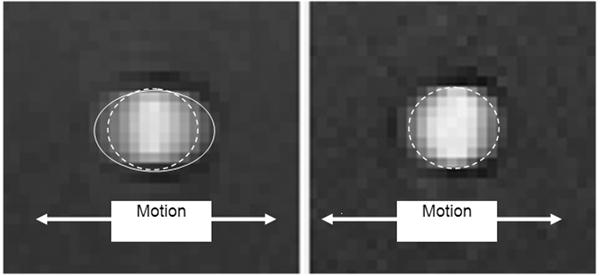
Standard interleaved velocity encodings (left) exhibit significant motion blur, with the apparent lumen shown by the solid elliptical line. The shorter acquisition windows for the non-interleaved encodings (right) produces much less blur and more accurate flow measurements. The true lumen size is shown by the dashed line in both images.
Figure 4.
Positive and negative velocity encodings measured with non-interleaved encodings, and the resultant mean luminal velocity.
Figure 5.
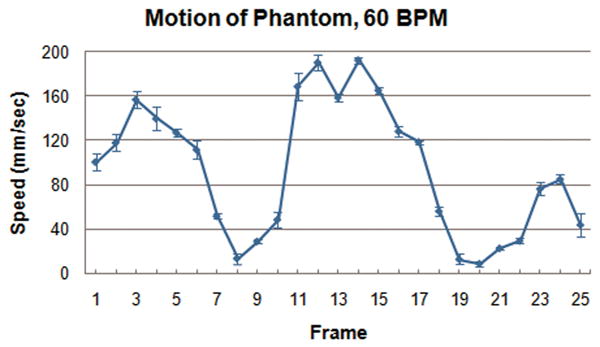
(A) Calculated flow over the heart cycle for the interleaved and non-interleaved scans, shown with the actual flow pump waveform. (B) Motion of the phantom in the scanner over the heart cycle. (C) Measured fluid velocity for the interleaved and non-interleaved scans. (D) Vessel area for the interleaved and non-interleaved scans. The velocity is underestimated, but the area is overestimated to a greater extent resulting in an overestimation of the flow. Non-interleaved acquisition reduces this overestimation by approximately a factor of two.
Figure 6.
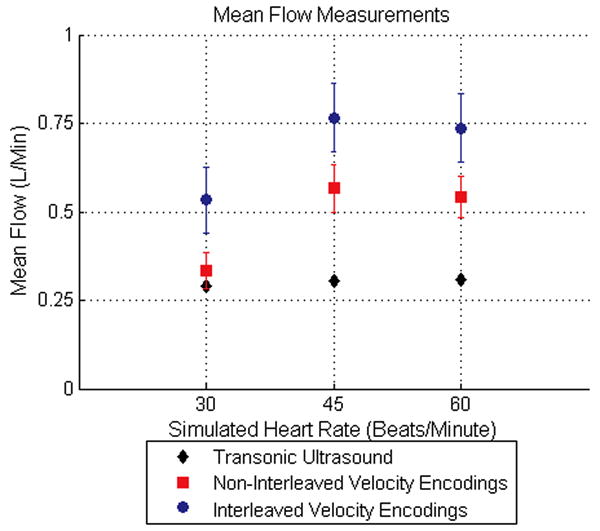
Mean flow measurements across all frames for the three heart rates simulated during the experiment are shown. The mean flow measured using non-interleaved velocity encodings reduces the error of the interleaved velocity encodings by approximately a factor of two.
Discussion
By improving the temporal resolution of phase-contrast segmented k-space acquisition, the use of non-interleaved velocity encodings provides two advantages over the interleaved approach. First, reduced motion blur provides more accurate lumen definition, which is important in vascular flow measurements, and second, reduced temporal blur provides more accurate depiction of the phasic velocity waveform over the cardiac cycle9,10. This new technique does have limitations. First, it requires analysis of twice as many images (both positive and negative encoded) as compared to standard interleaved data sets in which the phase subtraction has already been performed. The proposed automated cross-correlation technique reduces this labor intensive burden. Second, since the mean luminal velocity is extracted separately from each of the positive and negative velocity encoded images, there is no velocity map produced, which could provide useful information about other features in the image with vessel position different between the two. The phantom hardware in our experiments has two additional limitations as previously noted. The phantom is unable to simulate higher heart rates and cannot simulate very rapid changes in the flow waveform.
In conclusion, the use of non-interleaved velocity encodings produces more accurate measurements of mean luminal velocity and area due to a reduction in both spatial and temporal blur. Non-interleaved velocity encodings improve the temporal resolution by a factor of two and provides a more precise depiction of both mean and phasic flow than produced with traditional interleaved velocity encodings. This new technique may prove useful in providing more accurate coronary flow measurements. Furthermore, a more accurate depiction of the flow waveform may prove useful in all vascular territories involving rapid changes in flow, such as the femoral and carotid arteries.
Reference List
- 1.Hundley WG, Lange RA, Clarke GD, et al. Assessment of coronary arterial flow and flow reserve in humans with magnetic resonance imaging. Circulation. 1996 April 15;93(8):1502–8. doi: 10.1161/01.cir.93.8.1502. [DOI] [PubMed] [Google Scholar]
- 2.Davis CP, Liu PF, Hauser M, Gohde SC, von Schulthess GK, Debatin JF. Coronary flow and coronary flow reserve measurements in humans with breath-held magnetic resonance phase contrast velocity mapping. Magn Reson Med. 1997 April;37(4):537–44. doi: 10.1002/mrm.1910370410. [DOI] [PubMed] [Google Scholar]
- 3.Hofman MB, Wickline SA, Lorenz CH. Quantification of in-plane motion of the coronary arteries during the cardiac cycle: implications for acquisition window duration for MR flow quantification. J Magn Reson Imaging. 1998 May;8(3):568–76. doi: 10.1002/jmri.1880080309. [DOI] [PubMed] [Google Scholar]
- 4.Moran PR. A flow velocity zeugmatographic interlace for NMR imaging in humans. Magn Reson Imaging. 1982;1(4):197–203. doi: 10.1016/0730-725x(82)90170-9. [DOI] [PubMed] [Google Scholar]
- 5.Haacke EM, Bearden FH, Clayton JR, Linga NR. Reduction of MR imaging time by the hybrid fast-scan technique. Radiology. 1986 February;158(2):521–9. doi: 10.1148/radiology.158.2.3941881. [DOI] [PubMed] [Google Scholar]
- 6.Jahnke C, Paetsch I, Achenbach S, et al. Coronary MR imaging: breath-hold capability and patterns, coronary artery rest periods, and beta-blocker use. Radiology. 2006 April;239(1):71–8. doi: 10.1148/radiol.2383042019. [DOI] [PubMed] [Google Scholar]
- 7.Frayne R, Holdsworth DW, Gowman LM, et al. Computer-controlled flow simulator for MR flow studies. J Magn Reson Imaging. 1992 September;2(5):605–12. doi: 10.1002/jmri.1880020522. [DOI] [PubMed] [Google Scholar]
- 8.Pelc NJ, Sommer FG, Enzmann DR, et al. Accuracy and precision of phase contrast flow measurements. Radiology. 1991;181(P):189. [Google Scholar]
- 9.Iwakura K, Ito H, Nishikawa N, et al. Early temporal changes in coronary flow velocity patterns in patients with acute myocardial infarction demonstrating the “no-reflow” phenomenon. Am J Cardiol. 1999 August 15;84(4):415–9. doi: 10.1016/s0002-9149(99)00326-4. [DOI] [PubMed] [Google Scholar]
- 10.Kawamoto T, Yoshida K, Akasaka T, et al. Can coronary blood flow velocity pattern after primary percutaneous transluminal coronary angioplasty [correction of angiography] predict recovery of regional left ventricular function in patients with acute myocardial infarction? Circulation. 1999 July 27;100(4):339–45. doi: 10.1161/01.cir.100.4.339. [DOI] [PubMed] [Google Scholar]


