Abstract
Insulin was loaded into hydrogel microparticles after two hours with loading efficiencies greater than 70% for both poly(methacrylic acid-grafted-ethylene glycol) (P(MAA-g-EG)) and poly(methacrylic acid-grafted-ethylene glycol) functionalized with wheat germ agglutinin (P(MAA-g-EG) WGA). The pH-responsive release results demonstrated that the pH shift from the stomach to the small intestine can be used as a physiologic trigger to release insulin from P(MAA-g-EG) and P(MAA-g-EG) WGA microparticles, thus limiting release of insulin into the acidic environment of the stomach. Microplates were successfully treated with PGM to create a surface that allowed for specific binding between mucins and lectins. The 1% PGM treatment followed by a 2 h BSA blocking step gave the most consistent results when incubated with F-WGA. In addition, the PGM-treated microplates were shown to create specific interactions between F-WGA and the PGM by use of a competitive carbohydrate. The 1% PGM treated microplates were also used to show that adhesion was improved in the P(MAA-g-EG) WGA microparticles over the P(MAA-g-EG) microparticles. The interaction between the PGM-treated microplate and P(MAA-g-EG) WGA was again shown to be specific by adding a competitive carbohydrate, whilethe interaction between P(MAA-g-EG) and the PGM-treated microplate was nonspecific. Cellular monolayers were used as another method for demonstrating that the functionalized microparticles increase adhesion over the nonfunctionalized microparticles. This work has focused on improving the mucoadhesive nature of P(MAA-g-EG) by functionalizing these hydrogel carriers with wheat germ agglutinin (WGA) to create a specific mucosal interaction and then evaluating the potential of these carriers as oral insulin delivery systems by in vitro methods. From these studies, it is concluded that the addition of the WGA on the microparticles produces a specific adhesion to carbohydrate-containing surfaces and that P(MAA-g-EG) WGA shows great promise as an oral insulin delivery system.
Keywords: Complexation hydrogels, oral protein delivery, wheat germ agglutinin, insulin
Introduction
Hydrogels are three-dimensional polymer networks that are insoluble due to the presence of physical and/orchemical cross-links.1 In addition, hydrogels are often used in biomedical applications due to their biocompatibility and ability to imbibe large amounts of water. Complexation hydrogels are a specific class of hydrogels that form physical cross-links through noncovalent interactions, such as hydrogen bonding.2
Our laboratory has successfully developed a class of environmentally sensitive complexation hydrogels containing methacrylic acid (MAA) and poly(ethylene glycol) (PEG) tethers (designated as P(MAA-g-EG)).3, 4 More specifically, P(MAA-g-EG) is a pH responsive hydrogel that is capable of swelling and deswelling due to the formation of temporary physical cross-links, or interpolymer complexes, between the PMAA pendant groups and the tethered PEG chains. Complexation of the hydrogel carrier is attributed to the hydrogen bonding between the carboxyl group of the MAA and the etheric oxygen of the PEG chains. At a neutral pH, the carboxyl group of the MAA is deprotonated, thus creating ionic repulsion between the polymer chains (i.e., decomplexed state). Thus, the mesh size of the hydrogel network increases, allowing for release of an entrapped drug. These systems can therefore utilize the pH shift between the stomach and the small intestine (from pH 2 to 7) as an environmental trigger to release and deliver protein to the targeted site of delivery, which is the small intestine.
Lowman et al.5 demonstrated the potential of these environmentally sensitive complexation hydrogels to be used as a carrier for oral protein delivery, by delivering insulin to diabetic rats and lowering blood glucose levels. In addition, Madsen and Peppas6 determined that the calcium binding properties of ionized MAA inhibit some proteolytic degradation of the released protein, therefore increasing the amount of bioactive protein transported across the epithelial layer. Further investigation into the calcium chelating properties of MAA, revealed a reversible increase in the opening of the tight junctions. This helped support that the predominant transport mechanism of the studied proteins is by the paracellular route.7-9 Overall, this class of environmentally responsive complexation hydrogels is a promising candidate to deliver proteins by oral administration. The goal of this work was to improve the mucoadhesive properties of the delivery system by synthesizing the previously established system of P(MAA-g-EG) and functionalizing the carriers with wheat germ agglutinin (WGA), a class of lectins.
Mucoadhesive formulations seek to increase the residence time of a carrier at the site of absorption, thus increasing local concentrations of drug and improving drug bioavailability. Furthermore, mucoadhesion provides an intimate contact of the drug carrier with the intestinal mucosal layer, therefore minimizing exposure and degradation of the released drug by luminal proteolytic enzymes.10 Many polymers such as chitosan, polyacrylates and derivatives, and PEG have been shown to have mucoadhesive properties.11, 12 The interaction of these polymers with the mucosal layer is nonspecific, whereas lectin-mediated mucoadhesion provides a specific biological interaction to promote adherence to mucins within the mucosal layer. Lectins have the ability to bind carbohydrates of certain specificity and can therefore bind to glycoslyated surfaces (i.e., mucins) present in the mucosal layer.13 The concept of using lectins for drug delivery first came from Woodley and Naisbett in 1988 when they proposed using tomato lectin to bind to the luminal surface of the small intestine.14 WGA was previously shown to have the highest binding capacity to pig gastric mucin out of a panel of lectins (Solanum tuberosum lectin (STL), Dolichos biflorus agglutinin (DBA), Ulex europaeus isoagglutinin I (UEA I), and WGA) that all had different carbohydrate binding specificities.15 In addition, there is minimal binding of WGA to mucin at a low pH, indicating that there would be little binding of WGA to the stomach mucosa. This work has focused on improvingthe mucoadhesive nature of P(MAA-g-EG) by functionalizing these hydrogel carriers with wheat germ agglutinin (WGA) to create a specific mucosal interaction and then evaluating the potential of these carriers as oral insulin delivery systems byin vitro methods.
Materials and Methods
Hydrogel Synthesis
Hydrogels were prepared by UV-initiated free radical solution polymerization. The monomer mixture contained MAA (Sigma-Aldrich, St. Louis, MO), poly(ethylene glycol) monomethylether monomethacrylate (PEGMMA, molecular weight 1000) (Polysciences, Warrington, PA), tetraethylene glycol dimethacrylate (TEGDMA) (Sigma-Aldrich), Irgacure 184® (1-hydroxycyclohexyl phenyl ketone) (Sigma-Aldrich), water, and ethanol. MAA was vacuum distilled at 54 °C and 25 mm Hg prior to use in order to remove the inhibitor (hydroquinone). All other components were used as received.
The monomers were mixed in a 1:1 molar feed ratio of MAA:ethylene glycol units, thus in a typical reaction 3.6 g of MAA and 2.0 g of PEGMMA were used. The crosslinker, TEGDMA, was added in the amount of 1.0 mol% of total monomers and Irgacure® 184 was added in the amount of 1.0 wt% of total monomers to initiate the reaction. The solvent was a 50:50 w/w mixture of water and ethanol and was added in a 50:50 w/w ratio of total monomer to solvent.
Fluorescent microparticles were synthesized by adding PolyFluor™ 407 (9-anthracenylmethyl methacrylate) (Polysciences) to the monomer mixture prior to polymerization at an amount of 0.01 wt% of total monomer.
Monomers, crosslinker, initiator, and solvent were added to an amber bottle and sonicated for 15 minutes prior to polymerization. The monomer solution was then placed in a sealed glove box environment and purged with nitrogen for 20 minutes to remove oxygen, which is a free radical scavenger. After purging, the glove box remained sealed to ensure a nitrogen environment during polymerization. Two glass plates (15 cm × 15 cm × .3 cm) were separated by a 0.7 mm Teflon spacer and the monomer solution was carefully pipetted between the glass slides. The glass plates were exposed to UV light (Dymax 2000-EC Light Curing System, Torrington, CT) for 30 minutes at an intensity of 17.0 mW/cm2. The resulting polymer was removed from the glass plates and washed in deionized water for 7 days to remove any unreacted monomer. Drying of the polymer was done in a vacuum oven at 35 °C for 2 days. The polymer was then crushed and sieved into microparticles of various sizes. The subsequent polymer was composed of a MAA backbone with grafted PEG chains (P(MAA-g-EG)).
Carrier Functionalization
Hydrogel synthesis remained the same as previously described while the protocol for carrier functionalization took place in two distinct steps. P(MAA-g-EG) was functionalized with biotinylated-WGA (B-WGA) through a biotin-avidin linkage. The first step of the functionalization occurred before the polymerization, while the second step was performed after the gel was crushed into microparticles.
The first step of the reaction was to synthesize acryloyl-poly(ethylene glycol)-biotin (ACR-PEG-B) by previously established protocols 16, 17. Acryloyl-poly(ethylene glycol)-N-hydroxy succinimide (ACR-PEG-NHS, Molecular weight 3400) (Nektar Therapeutics, Huntsville, AL) was dissolved in 50 mM sodium bicarbonate buffer, pH 8.2, at a concentration of 86 mg/ml and reacted with EZ-Link® biotin-PEO-Amine (Pierce, Rockford, IL), which was separately dissolved in 50 mM sodium bicarbonate buffer, pH 8.2, at a concentration of 1 mg/ml. NHS esters react readily with primary amines, thus the reason that biotin functionalized with a single primary amine was selected.
ACR-PEG-NHS was added dropwise to the biotin solution to yield a 2:1 molar ratio of ACR-PEG-NHS:biotin-PEO-amine. The reaction was allowed to proceed for 2 h at room temperature, after which time the resulting product was placed in a -80 °C freezer for 30 minutes, lyophilized at -50 °C under vacuum (LabConco Model 77500, Kansas City, MO) for 2 days, and stored at -20 °C until use. The resulting dried product was ACR-PEG-B, which could then be added to the monomer solution before polymerization. A fluorescamine assay 18 was used to determine the efficiency of PEG functionalization with the biotin, which confirmed 90% of the PEG was functionalized with biotin.
The goal of the first step was to create a PEG tether that allowed for further functionalization after polymerization. When functionalized polymer was desired, hydrogel synthesis remained the same and lyophilized ACR-PEG-B was added to the prepolymer mixture in an amount to give a final density of 100 nmol biotin/cm3. After the resulting film was washed and dried, the gel was crushed and sieved into microparticles of the desired size (P(MAA-g-EG) PEG-B).
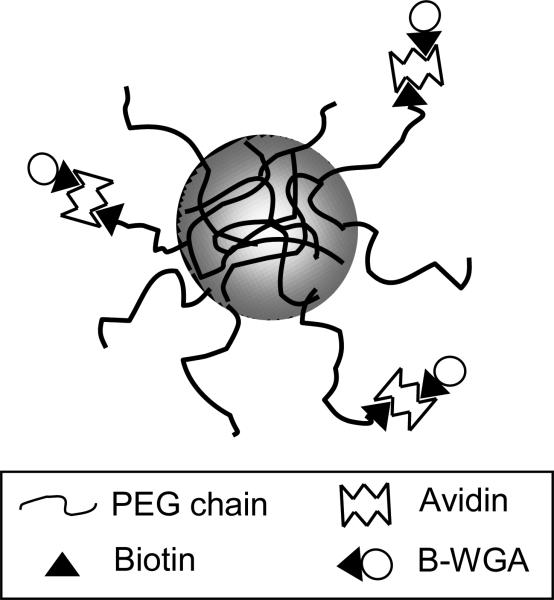
The second functionalization step involved adding avidin D (Vector Laboratories, Burlingame, CA) and B-WGA (Vector Laboratories) to the biotin functionalized PEG chains. To functionalize the microparticles with WGA, 100 mg of microparticles (90-150 μm) were added to 20 ml of 1X PBS, pH 7.4, while stirring in a beaker. Avidin was added to yield a 1:1 molar ratio of ACR-PEG-B:Avidin and the solution was then stirred for 30 minutes. The microparticles were then collapsed by the addition of 0.1 N HCl, filtered, and washed to remove any excess avidin. Microparticles were then resuspended in 1 X PBS, pH 7.4 and B-WGA was added in a 1.5:1 molar ratio of B-WGA:avidin. The reaction was allowed to proceed for 1 hour after which time the microparticles were again collapsed, filtered, and washed. Microparticles were then frozen, lyophilized, and stored at -20 °C until use. The final product resulted in P(MAA-g-EG) functionalized with WGA as shown in Figure 1.
Figure 1.
Schematic of P(MAA-g-EG) microparticle with PEG tethers that are functionalized with WGA through a biotin-avidin interaction.
During the course of the experiment, samples were taken of the supernatant and analyzed by HPLC (Waters 2695 Separations Module, Milford, MA) to determine avidin and B-WGA concentration. Decreases in the concentrations of avidin and B-WGA helped confirm that functionalization was occurring. Briefly, a mixture of 80% water/20% acetonitrile with 0.1% trifluoroacetic acid was used as the mobile phase in a Symmetry 300 C4 column. The 20 μL samples were injected and a flow rate of 1 mL/min was used.
Insulin Loading
Insulin loading was done by equilibrium partitioning, consisting of a 0.5 mg/ml bovine pancreatic insulin (Sigma-Aldrich, St. Louis, MO) solution and 140 mg of polymer microparticles sized 90-150 μm. All glassware was siliconized by Sigmacote (Sigma-Aldrich) prior to use to minimize protein and particle adsorption to the glassware.
An insulin stock solution was made with 80% v/v 1X phosphate buffered saline (PBS), pH 7.4, 10% v/v 0.1 N HCl, and 10% v/v 0.1 N NaOH. The insulin was dissolved in the acidified buffer and the NaOH was then added to return the pH of the solution to 7.4. A 140 mg sample of polymer microparticles was added to 20 ml of the insulin stock solution and stirred for 2 hours at room temperature. Before the addition of microparticles, a 200 μl sample was taken and filtered using a low protein binding 0.22 μm PVDF filter (Millipore, Bedford, MA) and then replaced with equal amounts of 1 X PBS, pH 7.4. An additional sample was taken in the same manner after loading. The particles were collapsed using 10 ml 0.1 N HCl, filtered with Whatman grade 4 filter paper, and washed with 20 ml of deionized water. After filtering, particles were frozen in a -80 °C freezer and lyophilized at -50 °C under vacuum (LabConco Model 77500) for 24 hours. Particles were stored at -20 °C until use.
Insulin concentration was determined using HPLC (Waters 2695 Separations Module, Milford, MA) analysis to calculate the loading efficiency. Briefly, a mixture of 70% water/30% acetonitrile with 0.1% trifluoroacetic acid was used as the mobile phase in a Symmetry300™ C4 column. The 20 μl samples were injected and a flow rate of 1 ml/min. was used.
Insulin Release
Release studies were performed using a dissolution apparatus (Distek model 2100B, North Brunswick, NJ). A 10 mg sample of insulin-loaded microparticles was added to a siliconized vessel containing 50 ml of 0.1 M dimethylglutaric acid buffer (DMGA), pH 3.2. The solution was stirred at 100 rpm and maintained at 37 °C. After 60 minutes, pH was raised to 7.0 by the addition of 5 N NaOH. 0.5 ml samples were taken over the course of 3 hours and filtered using a 0.22 μm PVDF filter. Samples were replaced with an equal volume of the appropriate pre-warmed buffer. Determination of insulin concentration was done using HPLC.
Coating Microplates with PGM
Black, polystyrene 96-well plates (high protein binding capacity) (Thermo Electron, Milford, MA) were coated with pig gastric mucin Type II (PGM) (Sigma, St. Louis, MO). A 100 μl sample of 0.1%, 1%, or 10% of a PGM-solution in PBS, pH 7.4, was added to each well of the 96-well plate and incubated for 24 hours at 4 °C. The PGM solution was removed and the plate was washed 3 times with 100 μl of PBS. A 100 μl sample of a 1% bovine serum albumin solution (Fraction V) (Sigma) in PBS was incubated with each well for 2 hours at 37 °C to block free binding sites. The BSA solution was removed and the plate was washed 3 times with 100 μl of PBS. Plates were stored at 4 °C with 100 μl of PBS in each well until use. Protocols for this study were similar to protocols established by Wirth et al. 15 for examining binding capacity of a variety of fluorescent lectins using PGM-treated microplates.
To confirm the PGM coating, fluorescein labeled wheat germ agglutinin (F-WGA) (Vector Laboratories, Burlingame, CA) was incubated with microplates that were pre-treated with 0.1%, 1%, and 10% PGM and blocked with BSA, as described above. A 50 μl sample of a serial dilution of F-WGA in PBS (80 – 2.5 μg/ml) was added to each well and incubated for 2 hours at 37 °C. Control wells were incubated with 50 μl of PBS containing no F-WGA. The F-WGA was removed and the plate was washed 3 times with 100 μl of PBS. The fluorescent intensity of each well was determined by a microplate reader (Bio-Tek Synergy HT, Winooski, VT) at an excitation of 385 nm and an emission of 425 nm. Autofluorescence of the coated wells was subtracted from each well by determining fluorescent intensity of the control wells.
An untreated microplate and a microplate that was blocked with 1% BSA for 2 hours (no PGM) were also tested as control microplates. The microplates followed the same experimental protocol for FWGA binding as the PGM-coated microplates.
A competitive carbohydrate, N,N′,N″-triacetyl-chitotriose (Sigma), was used to confirm that the binding of F-WGA was specific to the PGM-coated 96-well plate 19. Each well of a 96-well plate, pre-treated with 0.1%, 1%, and 10% PGM and blocked with BSA, was incubated with 50 μl of a 40 μg/ml solution of F-WGA in PBS for 1 hour at 37 °C. After 1 hour, 50 μl of a serial dilution of N,N′,N″-triacetyl-chitotriose (1.0 – 0.0625 mg/ml) was added to each well and incubated for 1 hour at 37 °C. The microplate was then washed 3 times with 100 μl of PBS to remove N,N′,N″-triacetyl-chitotriose and unbound F-WGA. Control wells were incubated with 50 μl of PBS containing no F-WGA. The fluorescent intensity of each well was determined by a microplate reader (Bio-Tek Synergy HT) at an excitation of 385 nm and an emission of 425 nm. Autofluorescence of the coated wells was subtracted from each well by determining fluorescent intensity of the control wells.
An untreated microplate and a microplate that was blocked with 1% BSA for 2 hours (no PGM) were also tested as control microplates. The microplates followed the same experimental protocol for F-WGA and competitive carbohydrate binding as the PGM-coated microplates.
PGM Binding Capacity of P(MAA-g-EG) and P(MAA-g-EG) WGA
P(MAA-g-EG)-PolyFluor™ 407 and P(MAA-g-EG)-PolyFluor™ 407-WGA microparticles were suspended in PBS, pH 7.4, at concentrations of 1.0 and 0.5 mg/ml. A 50 μl sample of either 1.0 mg/ml or 0.5 mg/ml microparticles was incubated with a BSA-blocked 1% PGM plate for 2 hours at 37 °C. The initial fluorescent intensity of each well was determined by a microplate reader (Bio-Tek Synergy HT) at an excitation of 362 nm and an emission of 407 nm. The microplate was then washed with 100 μl of PBS to remove unbound microparticles. Fluorescent intensity of each well was again determined after washing. Control wells were incubated with 50 μl of PBS containing no microparticles. Autofluorescence of the coated wells was subtracted from each well by determining fluorescent intensity of the control wells.
The percentage of bound particles was determined as follows:
where RFIAW is the fluorescent intensity after washing each well and RFIBW is the fluorescent intensity before washing. Calculating the percentage of bound particles by this method eliminated any potential differences in the pipetting of microparticles into each well.
Specificity of P(MAA-g-EG) and P(MAA-g-EG) WGA Binding
P(MAA-g-EG)-PolyFluor™ 407 and P(MAA-g-EG)-PolyFluor™ 407-WGA microparticles were suspended in PBS, pH 7.4, at concentrations of 1.0 and 0.5 mg/ml. A 50 μl sample of either 1.0 mg/ml or 0.5 mg/ml microparticles was incubated with a BSA-blocked 1% PGM plate for 1 hour at 37 °C. After 1 hour, 50 μl of a serial dilution of N,N′,N″-triacetyl-chitotriose (1.0 – 0.0625 mg/ml) was added to each well and incubated for 1 hour at 37 °C. The microplate was then washed 2 times with 100 μl PBS to remove N,N′,N″-triacetyl-chitotriose and unbound microparticles. Control wells were incubated with 50 μl of PBS containing no microparticles. The fluorescent intensity of each well was determined by a microplate reader (Bio-Tek Synergy HT) at an excitation of 362 nm and an emission of 407 nm. Autofluorescence of the coated wells was subtracted from each well by determining fluorescent intensity of the control wells.
Adhesion of P(MAA-g-EG) and P(MAA-g-EG) WGA to Caco-2 Cells
Mucoadhesion of the WGA carrier was evaluated using human colon adenocarcinoma (Caco-2) cells. Caco-2 cells were obtained from American Type Culture Collection (ATCC, Rockwell, MD). Cells were cultured in Dulbecco's modified Eagle medium (DMEM) (Mediatech, Herndon, VA) supplemented with 10% heat-inactivated fetal bovine serum (Cambrex, East Rutherford, NJ), 1% non-essential amino acids (Mediatech), 100 U/ml penicillin, and 100 μg/ml streptomycin (Mediatech).
Cultures were maintained in T-75 flasks (Corning, Corning, NY) at 37 °C and a humidified environment of 5% CO2 in air. The medium was changed every other day. Cells were routinely passaged at 80% confluency, which occurred between 6 and 7 days after seeding. Prior to the experiment, cells were seeded at a density of 5.0 × 10⁴ cells/cm2 in 12 well plates and media was changed every other day until the cells reached confluency.
P(MAA-g-EG)-PolyFluor™ 407 and P(MAA-g-EG)-PolyFluor™ 407-WGA microparticles were suspended in DPBS, pH 7.4 (Mediatech, Herndon, VA), pre-warmed to 37 °C at a concentration of 1 mg/ml. The medium was aspirated from the cells and each well was washed with DPBS, pH 7.4, pre-warmed to 37 °C. A 1 ml sample of the microparticle suspension was incubated with the cellular monolayer for 30 minutes at 37 °C on a shaker plate. After incubation, non-adherent microparticles were removed by washing two times with 1 ml of Hank's balanced salt solution (HBSS) (Mediatech). Control wells contained cells that were incubated with microparticles, but did not undergo a wash step. The fluorescent intensity of each well was determined by a microplate reader (Bio-Tek Synergy HT) at an excitation of 362 nm and an emission of 407 nm.
Results and Discussion
Insulin Loading
An insulin loading optimization experiment was performed to determine the appropriate amount of time for loading of insulin into the microparticles. From the loading optimization experiment, it was concluded that loading for longer than two hours does not significantly increase the loading efficiency. Loading efficiency was defined as follows:
where Co is the initial insulin concentration and Cf is the final insulin concentration remaining in solution.
Loading efficiencies were determined both before and after the additional of HCl, which is added to collapse the microparticles and entrap insulin within the network, Table 1. Before the addition of HCl, P(MAA-g-EG) had a loading efficiency of 87.80 ± 1.31 and P(MAA-g-EG) WGA had a loading efficiency of 97.66 ± 0.19. It should be noted that loading efficiencies are always lower after the addition of the HCl because the collapse of the network forces some of the insulin out of the polymer. P(MAA-g-EG) had a final loading efficiency of 84.00 ± 0.90, whereas P(MAA-g-EG) WGA had a slightly lower final loading efficiency of 73.66 ± 1.12. Both of these loading efficiencies corresponded to about 5 wt % loading of insulin, which is defined as mg of insulin per mg of polymer.
Table 1.
Insulin Loading Efficiencies for P(MAA-g-EG) and P(MAA-g-EG) WGA
| Polymer Sample | Loading Efficiency Before HCl (%) | Loading Efficiency After HCl (%) | Wt % loaded (mg insulin/mg polymer) |
|---|---|---|---|
| P(MAA-g-EG) | 87.80 ± 1.31 | 84.00 ± 0.90 | 5.38 ± 0.38 |
| P(MAA-g-EG) WGA | 97.66 ± 0.19 | 73.66 ± 1.12 | 5.03 ± 0.11 |
Functionalizing the microparticles with WGA, a 36 kDa protein, leads to some interference in the loading process. Most likely, the avidin-WGA complex present on the surface of the microparticle interacts with the insulin while being loaded, which resulted in a higher loading efficiency before collapse of the network. The interaction of the avidin-WGA complex with the insulin would have then prevented diffusion of a certain percentage of the insulin into the polymer network, thus keeping more insulin at the surface of the microparticle. This insulin would therefore be washed off during the collapse of the microparticles, which would account for the lower loading efficiency in the WGA functionalized microparticles. It is possible that a longer loading time would compensate for this difference.
Insulin Release
Previous release studies looked at insulin release from microparticles at pH 1.2 and pH 6.8 in two separate experiments 20. In this release study, we wanted to simulate the pH changes the microparticle would experience in vivo when passing through the stomach and into the small intestine all in one experiment (i.e., from an acidic pH to a neutral pH). DMGA was chosen as the buffer because it is capable of buffering from pH 3.2 to pH 7.0.
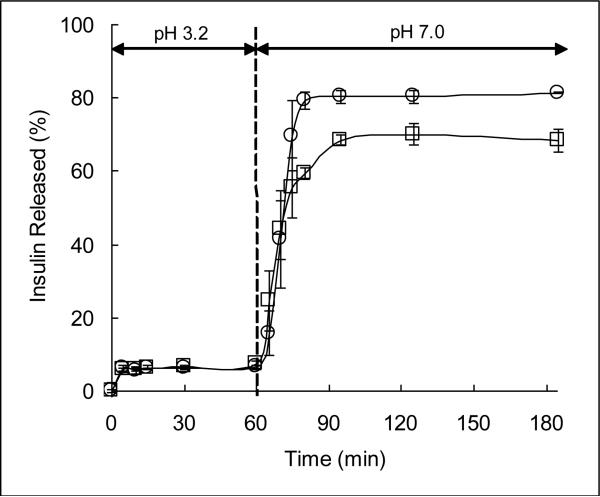
Figure 2 shows the results of insulin release from P(MAA-g-EG) and P(MAA-g-EG) WGA. The functionalization process does slightly reduce the amount of insulin released from the carrier.
Figure 2.
Insulin-loaded P(MAA-g-EG) (10 mg sample, ○) or insulin-loaded P(MAA-g-EG) WGA (10 mg sample, □) microparticles were placed in 50 mL of DMGA buffer, pH 3.2. After 60 min, the pH of the solution was raised to 7.0 by the addition of 5 N NaOH. Solutions were stirred at 100 rpm and maintained at 37 °C. Samples were taken over the course of 3 h and insulin concentration was determined by HPLC.
At a low pH, both P(MAA-g-EG) and P(MAA-g-EG) WGA limited release of insulin from the microparticles, with both releasing less than 10% of the loaded insulin. After 60 minutes, the pH was increased and insulin was rapidly released from both of the carriers. Functionalizing the microparticles with WGA decreased the amount of insulin released at pH 7.0, which is in agreement with the previous experiments. Both carriers reached the maximum amount of insulin release after 60 minutes in the pH 7.0 buffer, with P(MAA-g-EG) releasing 80% of the loaded insulin and P(MAA-g-EG) WGA releasing 70% of the loaded insulin.
This study demonstrated that insulin is quickly released from the carriers after the pH is increased above the pKa of MAA. In addition, results of this experiment show that the change in pH between the stomach and the small intestine can be used as a physiologic trigger to release insulin from the hydrogel microparticles. As the hydrogel carrier passes into the small intestine, it recognizes a pH shift to 7, which increases the mesh size (i.e., decomplexed state) and allows for quick release of drug at the targeted site of absorption.
PGM Binding Capacity of P(MAA-g-EG) and P(MAA-g-EG) WGA
All microparticle and PGM-binding studies were conducted with the 1% PGM pre-treated microplates, as these microplates gave the best results after incubation with the F-WGA (results not shown).
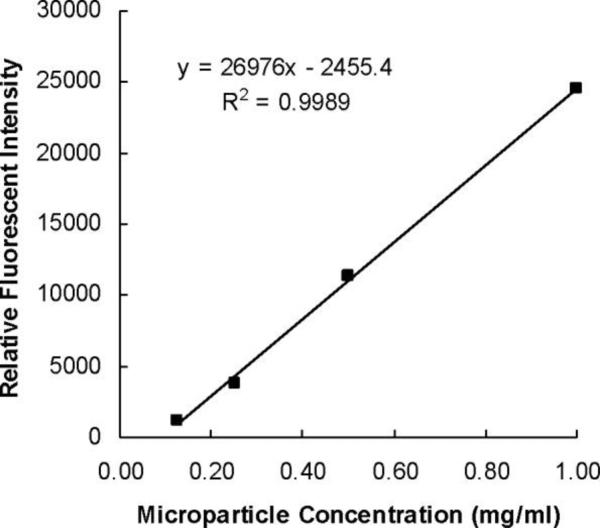
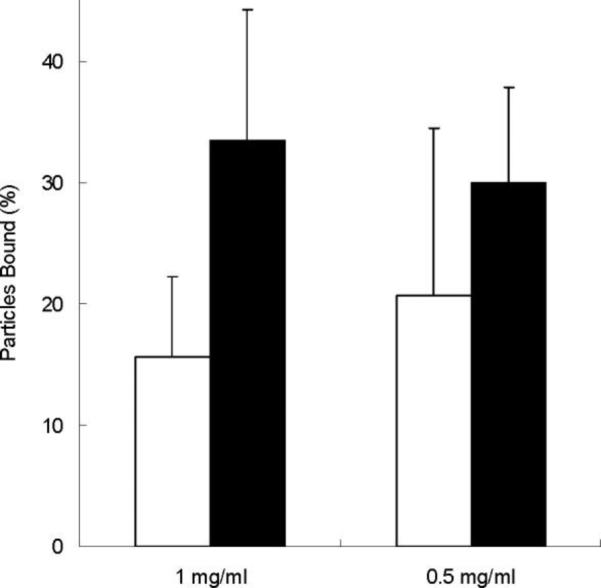
P(MAA-g-EG) and P(MAA-g-EG) WGA were suspended in PBS, pH 7.4 at concentrations of 1.0 mg/ml and 0.5 mg/ml and then incubated with the pre-treated microplate. The linear relationship between microparticle concentration and relative fluorescent intensity is depicted in Figure 3. The percentage of microparticles bound was determined by measuring fluorescent intensity in the wells before and after washing. Figure 4 shows the results of the adhesion experiment.
Figure 3.
Relative fluorescent intensity of microparticle concentrations between 0.2 and 1.0 mg/mL were measured in a 96-well plate.
Figure 4.
Pre-treated microplates were incubated with 1 mg/ml or 0.5 mg/ml of P(MAA-g-EG) (□) and P(MAA-g-EG) WGA (■) for 2 hours at 37 °C. Wells were washed with 100 μl of PBS to remove unbound microparticles. The percentage of bound particles was calculated by dividing the fluorescent intensity of each well after washing by the fluorescent intensity of each well before washing. n=6 ± SD
At a concentration of 1 mg/ml, P(MAA-g-EG) WGA significantly improved adhesion (p < 0.01) with 33.49% of the initial microparticles bound as compared to only 15.55% of the initial amount of P(MAA-g-EG) microparticles bound. P(MAA-g-EG) WGA (30.01%) also improved adhesion at a concentration of 0.5 mg/ml, with a 10% increase in binding over P(MAA-g-EG) (20.67%). These results were not statistically significant, but did show a trend of increased binding of P(MAA-g-EG) WGA to the PGM-treated microplates.
From this study, we did not see a concentration dependent increase in binding. This might be explained by some of the difficulty in consistently pipetting the same concentration of microparticles into each well. From analyzing the fluorescent intensity results before washing, there was a variation in the amount of microparticles in each well. To eliminate this variation, the percentage of bound microparticles was determined for each individual well as a function of the fluorescent intensity after washing divided by the fluorescent intensity before washing.
Specificity of P(MAA-g-EG) and P(MAA-g-EG) WGA Binding
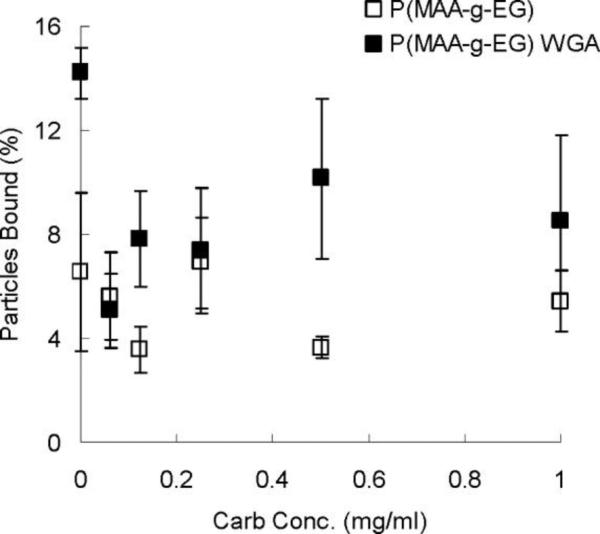
PGM-treated microplates were incubated with 1 mg/ml of P(MAA-g-EG) and P(MAA-g-EG) WGA microparticles for 1 hour at 37 °C. After 1 hour, a competitive carbohydrate was added to demonstrate that the binding of functionalized microparticles was specific and reversible. Figure 5 shows the results of this study.
Figure 5.
Pre-treated microplates were incubated with 1 mg/ml of P(MAA-g-EG) (□) and P(MAA-g-EG) WGA (■) for 1 hour at 37 °C. A competitive carbohydrate, N,N′,N″-triacetyl-chitotriose, was then added at various concentrations to each well and incubated for 1 hour at 37 °C. A wash step was performed to remove the competitive carbohydrate and unbound microparticles. The percentage of bound particles was calculated by dividing the fluorescent intensity of each well after washing by the fluorescent intensity of each well before washing. n=3 ± SD
The addition of the competitive carbohydrate had no effect on the wells containing P(MAA-g-EG). Because there is no specific interaction between P(MAA-g-EG) and the PGM, it was not expected that the competitive carbohydrate would decrease the amount of P(MAA-g-EG) binding. In contrast, adding the competitive carbohydrate to the wells containing P(MAA-g-EG) WGA did decrease binding of the microparticles. A concentration-dependent decrease in P(MAA-g-EG) WGA binding with an increase in the concentration of competitive carbohydrate was not seen as with the F-WGA binding to PGM (results not shown), but instead the competitive carbohydrate reduced the amount of binding almost equally in all wells as compared to wells that were not incubated with the competitive carbohydrate.
It is possible that the range of concentrations used for the competitive carbohydrate were too high to see a concentration-dependent reduction in binding and that at all concentrations used the specific binding was completely inhibited. From this study, we can say that P(MAA-g-EG) WGA binding to PGM-treated microplates is specific and reversible, while any binding of P(MAA-g-EG) to the microplates appears to be nonspecific.
Adhesion of P(MAA-g-EG) and P(MAA-g-EG) WGA to Caco-2 Cells
Caco-2 cells, which possess a glycocalyx layer containing carbohydrate moieties that WGA can bind, were used to confirm that P(MAA-g-EG) WGA can create an improved adhesion between the polymer and the mucosal layer. Specifically, WGA binds to N-acetyl-glucosamine and sialic acid, which are expressed by Caco-2 cells. Previous studies have shown that Caco-2 cells bind WGA and WGA-conjugates 19, 21-24. This experiment was done to look at adhesion of functionalized microparticles in an in vitro setting.
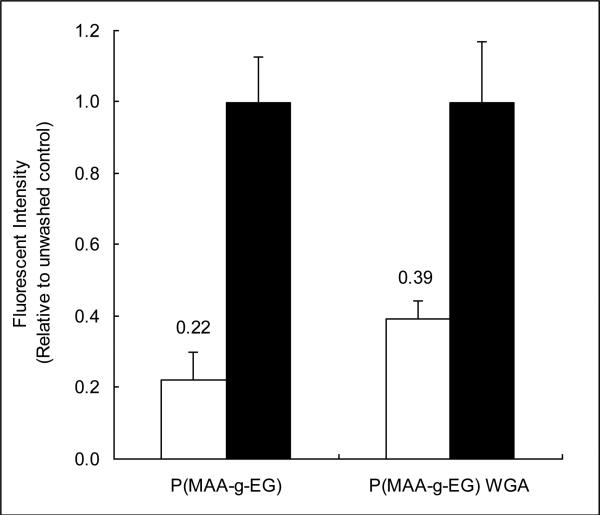
In comparison to unwashed control wells, P(MAA-g-EG) WGA adhesion (39.1 ± 5.3%) was significantly higher than P(MAA-g-EG) adhesion (22.2 ± 7.7%) (p<0.05) as shown in Figure 6. Adhesion was improved by 17% in wells containing the functionalized microparticles. This information suggests that WGA is able to improve the mucoadhesive characteristics of this delivery system.
Figure 6.
Caco-2 cells were cultured in a 12 well plate until confluency. Fluorescently labeled microparticles suspended in DPBS were incubated with the Caco-2 cells for 30 minutes. After incubation, wells were washed (□) twice with HBSS to remove non-adherent microparticles. Unwashed wells (■) were used as a control to determine the percentage of adherent microparticles. n=3 ± SD
This experiment demonstrates that WGA functionalized microparticles improve adhesion to a cellular monolayer and in conjunction with the PGM adhesion study confirms the improved mucoadhesive properties of the functionalized microparticles.
Conclusions
A novel class of pH-sensitive complexation hydrogels composed of methacrylic acid and functionalized poly(ethylene glycol) tethers, referred to as P(MAA-g-EG) WGA, was investigated as an oral protein delivery system. The PEG tethers were functionalized with wheat germ agglutinin (WGA), a lectin that can bind to carbohydrates in the intestinal mucosa, to improve residence time of the carrier and absorption of the drug at the delivery site. Insulin was effectively entrapped within the polymer network with a loading efficiency of 74%. Release studies with insulin-loaded P(MAA-g-EG) WGA showed that the carrier released less than 10% of the insulin at pH 3.2 after 60 min and 70% of the insulin at pH 7.0 after 60 min. Therefore, P(MAA-g-EG) WGA can protect insulin in the low pH of the stomach and that the pH change between the stomach and the small intestine can be used as a physiologic trigger to quickly release insulin. P(MAA-g-EG) WGA created a specific mucoadhesive interaction between mucin and WGA in in vitro experiments. In addition, it improved the overall adhesion of the carrier by 17% to a cellular monolayer, as compared to P(MAA-g-EG). These results confirmed that functionalizing P(MAA-g-EG) with WGA improved the mucoadhesive properties of the carrier.
Acknowledgements
This work was funded by NIH Grant EB No. 000246.
References
- 1.Peppas NA, Bures P, Leobandung W, Ichikawa H. Eur J Pharm Biopharm. 2000;50(1):27–46. doi: 10.1016/s0939-6411(00)00090-4. [DOI] [PubMed] [Google Scholar]
- 2.Lowman AM, Dziubla T, Bures P, Peppas NA. Structural and dynamic response of neutral and intelligent netwroks in biomedical environments. In: Peppas NA, Sefton M, editors. Molecular and cellular foundations of biomaterials. Vol. 29. Elsevier; San Diego: 2004. pp. 75–130. [Google Scholar]
- 3.Peppas NA, Klier J. J Controlled Release. 1991;16(1-2):203–214. [Google Scholar]
- 4.Bell CL, Peppas NA. Biomaterials. 1996;17(12):1203–1218. doi: 10.1016/0142-9612(96)84941-6. [DOI] [PubMed] [Google Scholar]
- 5.Lowman AM, Morishita M, Kajita M, Nagai T, Peppas NA. J Pharm Sci. 1999;88(9):933–937. doi: 10.1021/js980337n. [DOI] [PubMed] [Google Scholar]
- 6.Madsen F, Peppas NA. Biomaterials. 1999;20(18):1701–1708. doi: 10.1016/s0142-9612(99)00071-x. [DOI] [PubMed] [Google Scholar]
- 7.Ichikawa H, Peppas NA. J Biomed Mater Res A. 2003;67(2):617. doi: 10.1002/jbm.a.10128. [DOI] [PMC free article] [PubMed] [Google Scholar]
- 8.Torres-Lugo M, Garcia M, Record R, Peppas NA. Biotechnol Prog. 2002;18(3):612–616. doi: 10.1021/bp0101379. [DOI] [PMC free article] [PubMed] [Google Scholar]
- 9.Foss AC, Peppas NA. Eur J Pharm Biopharm. 2004;57(3):447–455. doi: 10.1016/j.ejpb.2004.02.008. [DOI] [PubMed] [Google Scholar]
- 10.Lehr C-M. J Controlled Release. 2000;65(1-2):19–29. doi: 10.1016/s0168-3659(99)00228-x. [DOI] [PubMed] [Google Scholar]
- 11.Peppas NA, Huang Y. Adv Drug Delivery Rev. 2004;56(11):1675–1687. doi: 10.1016/j.addr.2004.03.001. [DOI] [PubMed] [Google Scholar]
- 12.Luessen HL, Rentel C-O, Kotze AF, Lehr C-M, de Boer AG, Verhoef JC, Junginger HE. J Controlled Release. 1997;45(1):15–23. [Google Scholar]
- 13.Gabor F, Bogner E, Weissenboeck A, Wirth M. Adv Drug Delivery Rev. 2004;56(4):459–480. doi: 10.1016/j.addr.2003.10.015. [DOI] [PubMed] [Google Scholar]
- 14.Bies C, Lehr C-M, Woodley JF. Adv Drug Delivery Rev. 2004;56(4):425–435. doi: 10.1016/j.addr.2003.10.030. [DOI] [PubMed] [Google Scholar]
- 15.Wirth M, Gerhardt K, Wurm C, Gabor F. J Controlled Release. 2002;79(1-3):183–191. doi: 10.1016/s0168-3659(01)00538-7. [DOI] [PubMed] [Google Scholar]
- 16.Hern DL, Hubbell JA. J Biomed Mater Res. 1998;39(2):266–276. doi: 10.1002/(sici)1097-4636(199802)39:2<266::aid-jbm14>3.0.co;2-b. [DOI] [PubMed] [Google Scholar]
- 17.Behravesh E, Sikavitsas VI, Mikos AG. Biomaterials. 2003;24(24):4365–4374. doi: 10.1016/s0142-9612(03)00338-7. [DOI] [PubMed] [Google Scholar]
- 18.Bantan-Polak T, Kassai M, Grant KB. Anal Biochem. 2001;297(2):128–136. doi: 10.1006/abio.2001.5338. [DOI] [PubMed] [Google Scholar]
- 19.Gabor F, Wirth M, Jurkovich B, Haberl I, Theyer G, Walcher G, Hamilton G. J Controlled Release. 1997;49(1):27–37. [Google Scholar]
- 20.Wood KM, Stone G, Peppas NA. J Controlled Release. 2006;116(2):e66–e68. doi: 10.1016/j.jconrel.2006.09.053. [DOI] [PubMed] [Google Scholar]
- 21.Gabor F, Schwarzbauer A, Wirth M. Int J Pharm. 2002;237(1-2):227–239. doi: 10.1016/s0378-5173(02)00049-2. [DOI] [PubMed] [Google Scholar]
- 22.Weissenboeck A, Bogner E, Wirth M, Gabor F. Pharm Res. 2004;21(10):1917–1923. doi: 10.1023/b:pham.0000045247.09724.26. [DOI] [PubMed] [Google Scholar]
- 23.Weissenbock A, Wirth M, Gabor F. J Controlled Release. 2004;99(3):383–392. doi: 10.1016/j.jconrel.2004.07.025. [DOI] [PubMed] [Google Scholar]
- 24.Walter F, Scholl I, Untersmayr E, Ellinger A, Boltz-Nitulescu G, Scheiner O, Gabor F, Jensen-Jarolim E. Biochem Biophys Res Commun. 2004;315(2):281–287. doi: 10.1016/j.bbrc.2004.01.057. [DOI] [PubMed] [Google Scholar]


