

Abstract
Natural killer (NK) cells are essential for health, yet little is known about human NK turnover in vivo. In both young and elderly women, all NK subsets proliferated and died more rapidly than T cells. CD56bright NK cells proliferated rapidly, but died relatively slowly, suggesting that proliferating CD56bright cells differentiate into CD56dim NK cells in vivo. The relationship between CD56dim and CD56bright proliferating cells indicates that proliferating CD56dim cells both self renew and are derived from proliferating CD56bright NK cells. Our data suggests that some dying CD56dim cells become CD16+CD56− NK cells and that CD16−CD56low NK cells respond rapidly to cellular and cytokine stimulation. We propose a model in which all NK cell subsets are in dynamic flux. About half of CD56dim NK cells expressed CD57, which was weakly associated with low proliferation. Surprisingly, CD57 expression was associated with higher proliferation rates in both CD8+ and CD8− T cells. Therefore, CD57 is not a reliable marker of senescent, nonproliferative T cells in vivo. NKG2A expression declined with age on both NK cells and T cells. KIR expression increased with age on T cells, but not on NK cells. Although the percentage of CD56bright NK cells declined with age and the percentage of CD56dim NK cells increased with age, there were no significant age-related proliferation or apoptosis differences for these two populations or for total NK cells. In vivo human NK cell turnover is rapid in both young and elderly adults.
INTRODUCTION
Natural killer (NK) cells rapidly kill infected, damaged, and transformed cells. NK cells also secrete cytokines and chemokines that directly affect abnormal cells and shape subsequent adaptive immunity (1). Human NK cells can be divided into four subsets based on CD16 and CD56 expression. CD56bright (CD56++CD16lo/−) cells comprise a small fraction of blood NK cells, but are highly enriched in some tissues (1). They have limited cytotoxic activity, but secrete cytokines and chemokines upon stimulation. CD56dim (CD56+CD16+) are the major blood NK subset, spontaneously kill susceptible tumor cells, and rapidly secrete cytokines and chemokines (1, 2). At least some CD56dim NK cells are derived from differentiating CD56bright cells (1, 3–6). The poorly characterized CD16−CD56low population may include recently activated CD56dim NK cells, because CD16 is downregulated by various stimuli, but this population has not been thoroughly studied (7–9). CD16+CD56− NK cells are heterogeneous. These cells increase in HIV infection and are poorly functional, consistent with senescence (10, 11). However, NK cells with the CD16+CD56− cell surface phenotype are prevalent in neonates and differentiate into functional NK cells in vitro (12, 13). We know little of the stability of and flux between human NK subpopulations in vivo.
Unlike T and B lymphocytes, NK cell number is maintained in healthy aging and NK function is affected only modestly on a per cell basis (8, 14–16). Compared with the healthy elderly, frail elderly people are NK-deficient and are very susceptible to infections and cancer deaths, suggesting that NK cells are critical for healthy aging (14). At all ages, NK cell deficiency is associated with infectious diseases and with noninfectious diseases of several organs (1, 17–19).
Although important for health, relatively little is known about NK cell turnover. DNA labeling and cell cycle analysis showed that adult mouse splenic NK cells proliferate faster than total splenic T cells, but similar to NK1.1+ T cells (20). In comparison, 2H-DNA labeling studies in humans and primates suggested that NK cells proliferate more slowly (21, 22). Because human NK turnover is poorly characterized, we investigated proliferation and apoptosis among four NK subsets, in relation to aging.
MATERIALS AND METHODS
Donor recruitment
As approved by the human subjects institution review board, we deferred subjects with conditions that affect NK cells, acute illness, or abnormal vital signs, as described (23). Most studies were conducted on 38 young (median age 26.5, range 21–30) and 34 elderly (median age 81.2, range 74–96) women. CD57+ cell proliferation was assessed in 5 female and 7 male healthy subjects, ages 28–72 years. NK cell function was studied in 3 healthy males, ages 37–57. Blood from 1–3 subjects was collected into heparin by standard venipuncture and analyzed the same day.
Flow cytometry analysis
Peripheral blood mononuclear cells (PBMC) were pre-incubated with human IgG (Sigma-Aldrich, St. Louis, MO) to block nonspecific monoclonal antibody (mAb) uptake, and then stained with mAb to CD14 (Invitrogen, Carlsbad, CA), CD3 (Abcam, Cambridge, MA), CD16 (Invitrogen), CD56 (BioLegend, San Diego, CA), CD57 (BioLegend), and either NKG2A (BD Biosciences, San Jose, CA) or killer cell immunoglobulin-like receptor (KIR). The anti-KIR mAb cocktail consisted of NKVFS1 (Abcam), specific for KIR2DL1, KIR2DS1, KIR2DS2 and KIR2DS4, and DX9 (BD Biosciences), specific for KIR3DL1. After staining, washed cells were fixed with 2% paraformaldehyde and analyzed on a flow cytometer (LSRII, BD Biosciences). Live and apoptotic cells were distinguished by standard light scatter criteria (24). NK cells were identified as CD3− cells that expressed CD16, CD56, or both markers. NK subsets were identified as illustrated (Fig. 1). NK-like T (TNK) cells were defined as CD3+ cells that expressed CD16, CD56, or both markers, whereas CD3+conventional T (TCon) cells expressed neither marker.
Figure 1.

Flow cytometry gating and representative results. Shown are sample gating and Ki67 data for CD56bright and CD56dim NK cells from (A) a 24 year old subject and (B) a 77 year old subject. Cells were gated using DNA content (DAPI area) and pulse width (DAPI width) to exclude cell aggregates and debris (panel 1). Forward and side scatter were used to select lymphocytes (panel 2). After selection of CD3− cells (panel 3), NK cells were selected as cells that expressed either CD16 or CD56 or both, in the four boxed areas, excluding the left lower quadrant (panel 4). The CD56bright and CD56dim NK subpopulations and the percentage among total NK cells are denoted. Also shown in panel 4 are CD16−CD56low cells (dashed line box) and CD16+CD56− cells (dotted line box). Ki67 results are show for CD56bright and CD56dim populations (panels 5 and 6). Identical Ki67 gating was used for all NK and T cell populations.
For TUNEL and Ki67 assays, a separate aliquot of cells were stained as above, but without mAb to CD14 or CD57. Stained cells were fixed, washed, and then permeabilized in 70% ethanol on ice for 0.5 h and followed by −20°C overnight. For the TUNEL assay (24), washed cells were labeled for 1.25 h at 37°C with BrdU and terminal deoxytransferase (Invitrogen). Washed cells were incubated with FITC anti-BrdU or control mAb (Invitrogen). For the Ki67 assay, washed cells were incubated with FITC anti-Ki67 or control mAb (BD Biosciences). For both assays, cell clumps and debris were excluded from flow cytometry analysis using DAPI width, DAPI area, and light scatter characteristics by a scientist (A.K.) who was blinded to subject ages. Four elderly and two young donor samples were not analyzed for Ki67 and TUNEL either because of flow cytometer UV laser malfunction or because of mAb quality on the day of the experiment. An additional elderly sample was excluded as an outlier (54% Ki67+ among CD56dim NK cells compared to the elderly mean ± SD of 3.3 ± 2.1%). Representative examples of cell gating are shown in Figure 1. The range and median number of TUNEL+ events used to calculate proliferation in T and NK subsets were: total NK cells (60–20,602; 4,397), total T cells (210–82,617; 2,597), CD56dim NK cells (16–9,674; 646), CD56bright NK cells (0–561; 24), CD16+CD56− NK cells (30–19,166; 2,907), CD16−CD56low NK cells (4–3,847; 263), conventional T cells (TCon) (167–83,736; 1,919), and TNK (26–9,868; 571). For Ki67+ events: total NK cells (28–2,756; 382), total T cells (24–4,121; 792), CD56dim NK cells (15–1,297; 161), CD56bright NK cells (3–506; 61), CD16+CD56− NK cells (2–754; 110), CD16−CD56low NK cells (1–602; 49), TCon (20–3,829; 680), and TNK (3–656; 72). For CD57 proliferation studies, mAb to CD57 (12 subjects) and CD8 α (11 subjects; BioLegend) were added, while mAb to KIR and NKG2A were omitted.
For functional studies, NK cells were enriched using RosetteSep (StemCell Technologies, Vacouver, BC, Canada) to 92–98% purity with ≤ 1% T cells. NK cells (0.1 × 10⁶/well in 0.2 ml in 96-well V-bottom plates) were stimulated for 2 h with K562 cells (0.3 × 10⁶/well), IL-15 (100 ng/ml), or IL-12 (10 U/ml) plus IL-18 (100 ng/ml) in media containing RPMI-1640, 10% fetal bovine serum, amino acids, sodium pyruvate, and antibiotics. Cells were processed, stained with mAb to CD3, CD16, CD56, and CD69 (BioLegend), and analyzed by flow cytometry as described above, except that NK subset gates were adjusted to accommodate stimulation-induced changes in marker expression (Supplemental Fig. S1). For the cytotoxic granule exocytosis assay, anti-CD107a (BioLegend) and 0.2 μl monensin solution (GolgiStop™; BD Biosciences) were included in the culture medium and anti-CD69 was deleted from staining. Alternatively, cells were surface stained, fixed, permeabilized and stained with anti-interferon (IFN)-γ mAb (Beckman Coulter, Miami, FL) as described (25), except using permeabilization wash buffer (BioLegend).
Descriptive statistics included means and 95% confidence limits, and least squares analysis. Age group and lymphocyte subset differences were analyzed by a non-parametric Wilcoxon rank sum test. P-values greater than the overall alpha level of 5% were considered non-significant. Relationship between groups was assessed using the non-parametric Spearman’s rank correlation coefficient. Doubling time was calculated as Logx(2), where x = proliferation. For NK cells, Log1.0528(2) = 13.5 days.
RESULTS
Proliferation and Apoptosis
To estimate in vivo proliferation, we measured Ki67, which is expressed by cycling cells and which correlates well with in vivo DNA labeling (26). Unlike 2H-DNA labeling, Ki67 allows proliferation rates to be measured in minor lymphocyte subsets from many research subjects. Figure 1 shows sample flow cytometric plots from a young (A) and an elderly (B) subject. Figure 2 shows data pooled from young and elderly subjects. NK cells proliferated fast (5.3% Ki67+, Fig. 2A), with an estimated doubling time of 13.5 days. As a benchmark for NK proliferation, we compared these results with those of T cells in the same flow cytometry tube. Consistent with prior findings with CD4 T cells (27), total T cells were 1.2% Ki67+. Thus, NK proliferation was ~ 4-fold faster than that of total T cells. Cell death is another measure of turnover and we quantified apoptosis based on a modified TUNEL assay (Fig. 2B) and on light scatter characteristics (Fig. 2C). Because they were performed several hours after phlebotomy, these assays measured combined in vivo and in vitro apoptosis. In both assays, apoptosis was 3–4-fold greater in NK cells than in T cells (Fig. 2B, C). NK and T cell proliferation and apoptosis differences also were highly significant within each age group analyzed separately (data not shown). Thus proliferation and apoptosis assays gave consistent results, suggesting that human NK turnover is 3–4-fold greater than T cell turnover. The CD16 and CD56 markers that were used to identify NK subsets also allowed us to identify the small subset of CD3+ T cells expressing one or both of these NK-associated markers. These CD3+ “TNK” cells include a much broader set of T cells than the narrowly-defined “NKT” cells that have restricted TCR Vα24 gene expression or CD1d antigen specificity (28). TNK proliferation and apoptosis rates were considerably greater than those of CD16−CD56− conventional T cells (TCon) and were similar to those of NK cells (Fig. 2). Thus human NK cells resemble mouse splenic NK cells that proliferate much faster than total splenic T cells, but similar to NK1.1+ T cells (20).
Figure 2.
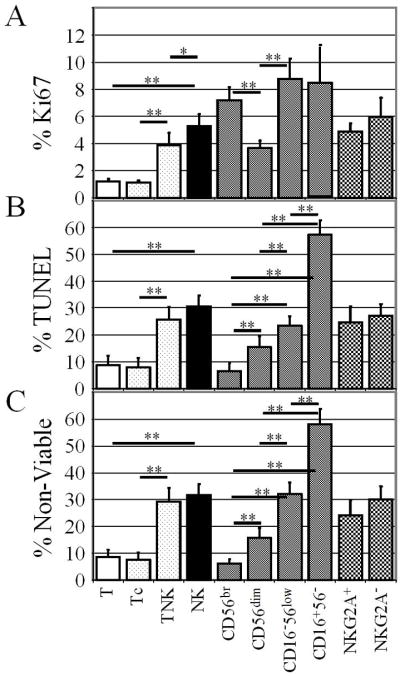
NK cells have high proliferation and apoptosis rates. PBMC were mAb stained and then permeabilized and stained for Ki67 expression (A) or treated with TUNEL reagents (B). Alternatively, viable and nonviable cells were assessed by forward and side scatter characteristics (C). Shown are means and 95% confidence limits for combined results with young and elderly subjects. Significance of differences between selected groups is indicated, *, p = 0.0003; **, p < 0.0001.
NK Subsets
CD56bright cells proliferated rapidly, but had relatively little apoptosis (Fig. 2). Imbalanced proliferation and death rates might indicate a net migration of CD56bright cells from blood to tissues. Alternatively, dividing CD56bright cells might differentiate into CD56dim cells, consistent with results of xenogeneic adoptive transfer studies and in vitro experiments (1, 3–5). CD56dim cells proliferated less than other NK cells and had a relatively low death rate, suggesting that this was the most stable NK subset (Fig. 2). Compared to CD56dim cells, CD16− CD56low NK cells had high rates of proliferation and apoptosis. CD16+CD56− cells were highly proliferative and very highly apoptotic (Fig. 2). These results are interpreted in the Discussion. KIR− cells proliferated faster than did KIR+ cells, but this was due to the fact that all 3 of the rapidly proliferating NK subsets expressed considerably less KIR than did the slower proliferating CD56dim subset (Table I). NK proliferation and apoptosis rates did not correlate significantly with NKG2A expression (Fig. 2).
Table I.
Age-related expression of MHC class I receptors on T and NK subsets
| Marker | Set | Young | Elderly | Age Effect * |
|---|---|---|---|---|
| NKG2A | T | 3.2% | 2.1% | 0.0008 |
| TNK | 34.6% | 15.7% | <0.0001 | |
| TCon | 1.9% | 1.1% | 0.0003 | |
| NK | 54.5% | 45.4% | 0.0018 | |
| CD56bright | 93.3% | 88.5% | 0.0037 | |
| CD56dim | 53.7% | 45.7% | 0.0133 | |
| CD16−CD56low | 38.3% | 44.9% | NS* | |
| CD16+CD56− | 30.0% | 23.6% | 0.0311 | |
| KIR | T | 1.6% | 2.4% | 0.0081 |
| TNK | 16.6% | 18.4% | NS* | |
| TCon | 0.7% | 1.3% | 0.0113 | |
| NK | 42.0% | 42.0% | NS* | |
| CD56bright | 12.1% | 15.1% | NS* | |
| CD56dim | 53.5% | 50.2% | NS* | |
| CD16−CD56low | 11.5% | 14.9% | NS* | |
| CD16+CD56− | 29.3% | 25.9% | NS* |
Wilcoxon signed-rank test p values; NS, not significant
Because CD16−CD56low and CD16+CD56− NK subsets in healthy subjects have received little attention, we studied function. Enriched blood NK cells were stimulated with K562 cells, IL-12/IL-18, and IL-15 and responses were assessed early (2 h) to limit modulation of NK subset markers. CD107a expression indicated cytotoxic granule exocytosis; CD69 and intracellular IFN-γ also were measured (Fig. 3). For all three parameters, CD16−CD56low NK cells responded more vigorously than the other NK subsets to K562 stimulator cells. Only K562 stimulator cells consistently elicited cytotoxic granule exocytosis (Fig. 3A). In addition, K562 stimulation induced much higher CD107a cell surface density on positive cells than did the other stimuli (Fig. 3B). IL-12/IL-18 stimulated varying amounts of IFN-γ production by all four subsets after 2 h, with CD16−CD56low cells being the most vigorous NK subset in all donors (Fig. 3C). In response to IL-12/IL-18, a few CD56bright NK cells expressed CD69, which was much less than the CD69 expressed by the other three NK subsets (Fig. 3D). For all parameters and NK subsets, the response to IL-15 was typically less than the response to IL-12/IL-18. For both IFN-γ and CD69, staining intensities were similar for all positive NK cells and all stimuli (data not shown).
Figure 3.

CD16−CD56low NK cells rapidly respond to cellular and cytokine stimulation. NK cells were stimulated for 2 h as indicated, and assayed for cell surface CD107a (A, B), intracellular IFN-γ (C), and cell surface CD69 (D). Results are presented as % positive cells in each indicated NK subset (A, C, D) or as geometric mean fluorescence intensity on the positive cells (B). Results shown from 1 subject are representative of 3 subjects, each analyzed in a separate experiment.
NK homeostasis
We investigated the relationship between cell number and proliferation in NK cell subsets. We found a strong linear correlation between the number of proliferating CD56bright and proliferating CD56dim NK cells with a Y-intercept of 1.2 and slope of 1.0 (Fig. 4). Furthermore, the mean number of Ki67+ CD56dim cells was 2.4 times greater than the mean number of Ki67+ CD56bright cells (p < 0.0001, not shown). The Y-intercept > 0 (Fig. 4) and the greater number of dividing CD56dim cells indicate that some CD56dim NK cells proliferated even when there were very few dividing CD56bright NK cells. Clearly, not all proliferating CD56dim NK cells were immediate products of dividing CD56bright NK cells. However, the direct correlation between the number of proliferating CD56bright and the number of proliferating CD56dim NK cells (slope of 1.0) suggests that many Ki67+ CD56dim NK cells were derived from dividing CD56bright NK cells. Consistent with this conclusion, the proliferation rate of CD56dim cells was directly related to percent CD56bright cells (Fig. 5A). In contrast, CD56bright proliferation did not correlate significantly with CD56bright percentage (Fig. 5B). Our data with human cells studied directly ex vivo support prior observations that CD56bright NK cells differentiate into CD56dim NK cells in culture and in xenografts (3–5).
Figure 4.
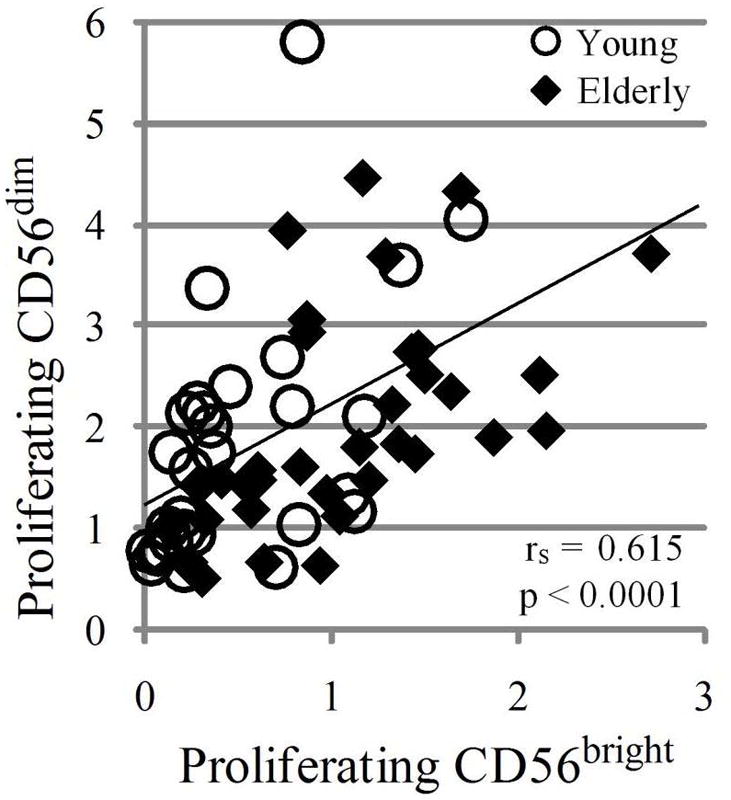
The number of proliferating CD56dim cells is directly related to the number of proliferating CD56bright NK cells. The relative number of proliferating CD56bright and CD56dim cells was calculated as (% of cells in subset × % Ki67+)/100. The least squares line, Spearman correlation coefficient (rs), and significance of association (p) are indicated. rs = 1.0 or −1.0 denote perfect correlation; rs = 0 denotes no correlation. Young (circles) and elderly (diamonds) analyzed separately showed similar correlations (p< 0.0001).
Figure 5.
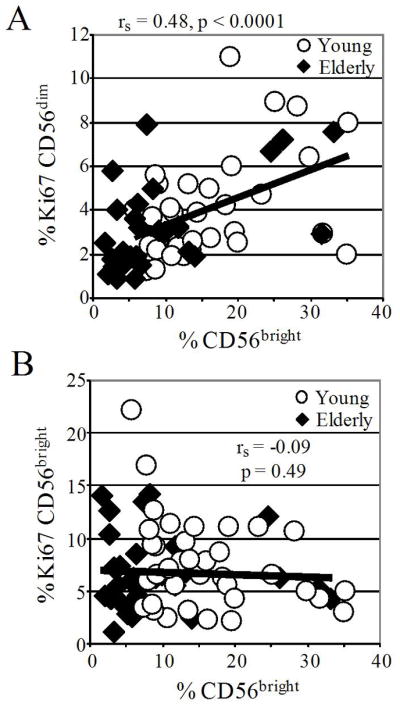
CD56dim proliferation, but not CD56bright proliferation, correlates with percentage CD56bright NK cells. Ki67 expression in the CD56dim subset (A) and the CD56bright subset (B) are plotted against CD56bright cells as a % of NK cells. A) The Spearman correlation coefficient (rs) and significance of association are indicated; young (circles) and elderly (diamonds) analyzed separately showed similar correlations and were significant. B) No significant correlations were obtained when young (circles) and elderly (diamonds) were analyzed together or separately.
NK receptor expression
We investigated MHC class I-specific receptor expression on NK and T cell subsets. NKG2A expression showed an age-related decline on total NK cells, and on CD56bright, CD56dim, and CD16+CD56− NK cells. NKG2A also declined with age on total T cells, TCon cells, and TNK cells (Table I). Results with individual subsets demonstrates that age-related loss of NKG2A expression on total NK cells and total T cells was not solely due to different ratios of various NK and T cell subsets. This finding extends previous findings that NKG2A expression decreased with age on NK cells and TNK cells (23). NK cell KIR expression did not change significantly with age (Table I). Few TCon expressed KIR, compared with TNK cells, but there was a significant age-related increase in TCon and total T cell KIR expression (Table I).
CD57 expression and cell proliferation
CD57 has been described as an in vitro T cell senescence marker and as a marker of CD56dim late differentiation, so we wished to correlate CD57 expression with NK and T cell proliferation (29–31). About 50% of CD56dim NK cells expressed CD57 in both young and elderly adults; other NK cells had significantly less CD57 expression (Table II). Therefore we focused on the major CD56dim NK population. To directly measure proliferation by CD57+ and CD57− cells, we studied a separate group of subjects. We found that CD57+CD56dim proliferated significantly slower than CD57−CD56dim NK cells (Fig. 6). However, Ki67 expression was only 29% lower in CD57+ cells than in CD57− cells.
Table II.
Elderly and young adult subjects differ in T and NK populations
| Set | Subset | Young | Elderly | Age Effect * |
|---|---|---|---|---|
| Lymphocytes | T | 73.7% | 58.7% | 0.0002 |
| T | TNK | 3.6% | 7.4% | 0.0426 |
| T | TCon | 96.6% | 92.9% | NS |
| T | CD57 | 4.3% | 12.0% | <0.0001 |
| TNK | CD57 | 34.2% | 54.5% | 0.0007 |
| TCon | CD57 | 2.9% | 8.3% | <0.0001 |
| Lymphocytes | NK | 7.4% | 15.9% | <0.0001 |
| NK | CD56bright | 15.4% | 9.1% | 0.0001 |
| NK | CD56dim | 60.7% | 70.5% | 0.0026 |
| NK | CD16−CD56low | 8.1% | 5.0% | 0.0021 |
| NK | CD16+CD56− | 14.8% | 15.3% | NS |
| NK | CD57 | 33.9 | 47.2 | 0.0037 |
| CD56bright | CD57 | 4.2% | 11.4% | 0.0047 |
| CD56dim | CD57 | 47.2% | 57.5% | 0.0261 |
| CD16−CD56low | CD57 | 6.1% | 9.8% | 0.0359 |
| CD16+CD56− | CD57 | 18.2% | 23.3% | NS |
Wilcoxon signed-rank test p values; NS, not significant
Figure 6.

CD57+ T and NK cells proliferate in vivo. The ratio of % Ki67 expression in CD57+ cells and CD57− cells within each indicated lymphocyte subset is shown as mean + 95% confidence limit. Differences from an equal ratio are indicated (* p = 0.001; ** p = 0.0005).
CD57 was expressed by many TNK cells, but few TCon cells, in both elderly and young adult subjects (Table II). In the CD8+ and CD8− (predominantly CD4+) T cell subsets, CD57 expression was associated with 2-fold and nearly 5-fold higher proliferation, respectively (Fig. 6). Because our findings contrast with prior in vitro studies, we considered the possibility that most proliferating CD57+ cells were recently activated CD57− cells that began to express CD57 after stimulation. We reasoned that cells newly synthesizing CD57 would have relatively low cell surface density. Opposite of this prediction, CD57 cell surface levels trended higher among proliferating cells in both the CD8−CD57+ and the CD8+CD57+ T cell subsets (Fig. 7). These data support the hypothesis that CD57+ T cells proliferate well in vivo. We conclude that CD57 is not a marker of T cell senescence in vivo.
Figure 7.
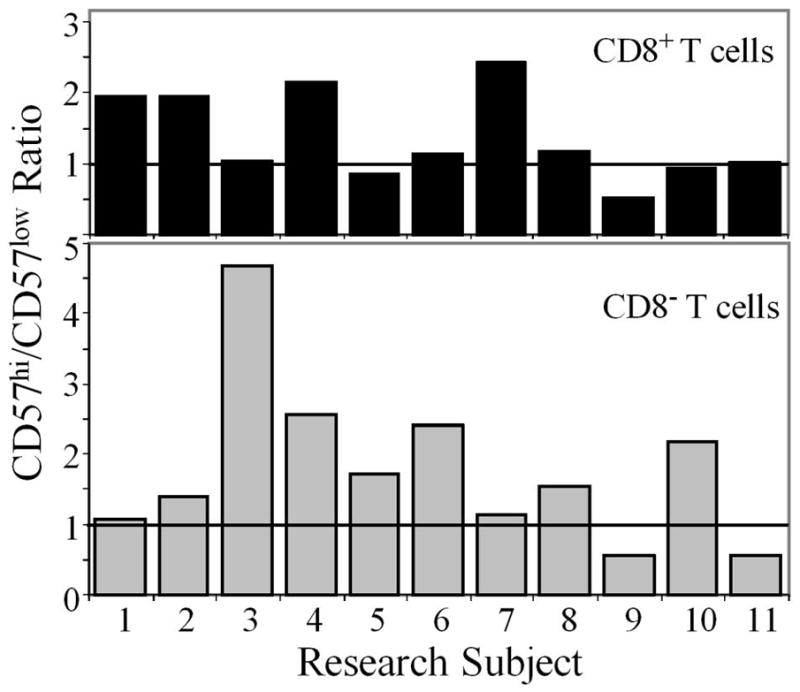
Proliferating CD57+ T cells do not have low density CD57 expression. For each T cell subset (CD8+ top panel, CD8− bottom panel), we defined CD57hi and CD57low expression as above and below median CD57 surface staining intensity, respectively. Based on this median, we calculated a ratio of CD57hi to CD57low cells among the Ki67+ proliferating population. A ratio > 1 indicates that more proliferating cells were CD57hi than CD57low.
Age effects
As expected, percentage T cells declined with age, but percentage NK cells increased (Table II). Consistent with prior reports (32, 33), young adults had a higher percentage of CD56bright cells; reciprocally elderly subjects had more CD56dim cells (Table II). We show for the first time that the percentage of CD16−CD56low NK cells declined with age, but that the percentage of CD16+CD56− NK cells did not differ between young and elderly women (Table II). NK proliferation trended lower in elderly women, but apoptosis trended higher (Table III), suggesting opposite inferences about the effect of age on NK turnover. No age-related change in proliferation or in apoptosis was statistically significant for total NK cells or for any of the NK subsets, with the sole exception that CD16+CD56− NK cells proliferated less rapidly in elderly women (Table III). This exception is addressed in the Discussion. We conclude that NK turnover does not change significantly in healthy aging women.
Table III.
Proliferation and apoptosis rates in elderly and young adult subjects by cell subset
| Marker | Set | Young | Elderly | Age Effect * |
|---|---|---|---|---|
| Ki67 | T | 0.99% | 1.52% | 0.0051 |
| TNK | 3.8% | 3.9% | NS | |
| TCon | 0.91% | 1.42% | 0.0022 | |
| NK | 6.0% | 4.3% | NS | |
| CD56bright | 7.5% | 6.8% | NS | |
| CD56dim | 4.0% | 3.3% | NS | |
| CD16−CD56low | 8.4% | 9.2% | NS | |
| CD16+CD56− | 10.6% | 5.8% | 0.0154 | |
| TUNEL | T | 6.8% | 11.9% | NS |
| TNK | 23.1% | 28.7% | NS | |
| TCon | 6.0% | 10.5% | NS | |
| NK | 29.8% | 31.7% | NS | |
| CD56bright | 4.6% | 8.8% | NS | |
| CD56dim | 14.7% | 16.5% | NS | |
| CD16−CD56low | 21.6% | 25.6% | NS | |
| CD16+CD56− | 57.9% | 56.4% | NS |
Wilcoxon signed-rank test p values; NS, not significant
Elderly subjects had increased percentage TNK cells, many of which expressed CD57. These results are consistent with prior findings that the elderly accumulate effector-memory T cells, which tend to express CD16, CD56, and CD57 (34). Total T cell and TCon proliferation was ~1.5-fold higher in elderly subjects than in young subjects. This result is not surprising given the increasing memory/naïve T cell ratio that is found during aging (27, 35–37). In contrast, TNK proliferation was identical in the two age groups (Table III).
DISCUSSION
Our major finding was that human blood NK cell proliferation is rapid with an estimated doubling time of 13.5 days. Both proliferation and apoptosis measurements indicated that NK cells turned over 3–4 times faster than did T cells. This result in healthy human subjects correlates well with the observation that NK cells rebound more rapidly than other blood lymphocytes following bone marrow and hematopoietic stem cell transplantation (38). NK turnover has been directly measured in only a few studies. Using in vivo labeling and cell cycle analysis, Jamieson et al (20) found that mouse splenic NK cells had a rapid turnover rate, which was much faster than that of splenic T cells. In contrast to mouse NK cells and to our findings, 2H-DNA labeling studies suggested relatively slow human and rhesus monkey CD3−CD16+ NK cell turnover (21, 22). We used the Ki67 technique because it allowed proliferation rates to be measured in minor lymphocyte subsets from many research subjects, unlike cumbersome isotope methods (36). We found major differences between NK subsets, with higher proliferation among CD56bright, CD16−CD56low and CD16+CD56− NK cells than among the major CD56dim NK subset. Given that results of Ki67 analysis usually correlate well with 2H-DNA labeling (26), it may seem puzzling why both techniques did not indicate a high NK turnover rate. However, the labeling studies excluded CD16− NK cells, such as most human CD56bright cells (Fig. 1) and their rhesus homologues (39). Failure to measure rapidly proliferating CD16−CD56bright and CD16−CD56low NK cells probably accounts for the relatively low proliferation rates observed in the 2H-DNA labeling studies. We conclude that human NK turnover is rapid. Rapid turnover of mouse and human NK cells raises the interesting question of how recently-described “memory” NK cells are maintained for several weeks after priming (40, 41). Because some types of “memory” NK cells selectively home to the liver, it could be that “memory” NK cells comprise a small fraction of total NK cells in spleen and blood, but a larger fraction in other organs (42).
Our data show that CD56bright NK cells proliferate rapidly, but die slowly relative to other NK subsets. Imbalanced proliferation and death in a population at steady state is consistent either with differentiation into another subset or with a net migration out of the blood compartment. The former possibility is consistent with the known precursor-product relationship between CD56bright and CD56dim NK cells (3–5). In a 2H-DNA labeling study, a 10–21 day lag was found between isotope pulse and peak appearance of labeled human NK cells in the blood (21). This lag had been attributed to the time required for dividing bone marrow precursors to differentiate into NK cells and subsequently migrate into the blood, but our results suggest that a major part of the lag is due to the development of CD16−CD56bright cells into CD16+CD56dim NK cells. To reconcile our findings with prior DNA labeling studies, we examined the number of proliferating cells more closely. We found a direct correlation between the number of Ki67+ CD56bright and the number of Ki67+ CD56dim NK cells. This suggests that dividing CD56bright NK cells gave rise to Ki67+ CD56dim NK cells. In support of this idea, the proliferation rate of CD56dim cells was directly related to the percent CD56bright cells. We conclude that many dividing CD56bright NK cells differentiate into Ki67+ CD56dim NK cells in vivo.
CD56dim NK cells had the lowest proliferation and apoptosis rates and therefore constitute the most stable NK subset in healthy people. 2H-DNA labeling showed that some label was found in CD3−CD16+ NK cells at the first sampling point, three days after isotope pulse (21). This was interpreted as cell division among these NK cells, but instead could be interpreted as cell division by immediate precursors, such as CD56bright NK cells. We found that the number of proliferating CD56dim cells consistently exceeded the number of proliferating CD56bright cells and that proliferating CD56dim cells could be found even in subjects with very few proliferating CD56bright NK cells. These data indicate that CD56dim NK cells proliferated and were not all products of recently divided CD56bright NK cells. Together these data indicate the CD56dim proliferation rate is relatively low and that some Ki67+ or 2H-labeled CD56dim cells are immediate products of dividing precursors. Nonetheless, CD56dim cells themselves divide at a low rate in healthy human subjects. In the setting of HIV infection, NK proliferation was vastly different—CD56dim cells proliferated faster than CD56bright cells (43).
Compared to CD56dim cells, CD16−CD56low NK cells proliferated and died rapidly. We also found that CD16−CD56low NK cells vigorously released cytotoxic granules and made IFN-γ in response to a 2-h stimulation with K562 cells or IL-12/IL-18. Others showed that NK cells lost CD16 expression after a 2 wk TGFβ stimulation (9). NK cells also lost CD16 during cytotoxic attack on, or even binding to, target cells (7, 8). However, the reduction in CD16 was incomplete in stimulated CD56dim cells after 4 h (7). We adjusted gating to minimize misclassification of CD56dim NK cells in our functional studies (Supplemental Fig. S1). Nonetheless, some of the CD16−CD56low NK cells identified in this study might have been recently activated CD56dim cells. Other CD16−CD56low NK cells might have been precursors that proliferated rapidly in response to cytokines and gave rise to mature NK cells, as recently suggested (44). Activated cells are expected to proliferate rapidly and may be more susceptible to activation-induced cell death via TNFα secretion and other mechanisms. CD16−CD56low NK cells have received little attention and are worthy of further study.
CD16+CD56− NK cells had very high apoptosis rates, significantly higher than those of CD56dim NK cells. We propose that cells with this phenotype represent several distinct subpopulations. Some CD16+CD56− NK cells likely are senescent, similar to the senescent NK cells that are expanded in HIV infection (10, 11). Many senescent cells have high death rates. Although they share the same CD16/56 phenotype, these senescent cells are distinct from the CD16+CD56− NK cells that were readily found in umbilical cord blood and in the blood of patients who had been transplanted with umbilical cord blood (13, 45). Their presence in cord blood suggests immaturity. Also consistent with immaturity, CD16+CD56− NK cells differentiate into CD56dim NK cells in vitro (12, 45). Finally, some CD16+CD56− NK cells may be dying CD56dim cells that have lost cell surface CD56 expression, as occurs during apoptosis in vitro (46).
Combined with published studies, our results suggest that blood NK subsets are in dynamic flux (Fig. 8). CD56bright cells and some CD16+CD56− cells differentiate into CD56dim cells. The CD16+CD56− apoptosis rate is high, due in part to dying CD56dim cells. Activated CD56dim cells may temporarily assume a CD16−CD56low phenotype. The dynamic flow between NK subsets contrasts to results with naïve and memory T cells, in which turnover in one compartment is largely independent of turnover in another compartment (37).
Figure 8.

Model of human NK turnover. CD56dim cells are maintained by cell division (represented by curved arrow above the oval; arrow thickness is proportional % Ki67+). CD56dim cells also are maintained by input from CD56bright cells and some input from immature CD16+CD56− NK cells (represented by thin arrows between populations). CD56dim cells may temporarily lose CD16 expression following stimulation. At steady state, the number of new CD56dim cells is balanced by change of surface phenotype (e.g., loss of CD56 expression) and by death (represented by skull and crossbones; arrow thickness is proportional to % TUNEL+). Some Ki67+ CD56dim cells are derived from dividing CD56bright cells; some dying CD16+CD56− cells are derived from apoptotic CD56dim cells.
In a prior study of 15 elderly and 15 young mixed gender subjects, we found an age-related decline in CD3−CD56+ NK cell KIR expression (23). In our current study involving 34 young and 38 elderly adult women, NK cell KIR expression was identical in the two age groups. Furthermore, none of the NK subsets showed a significant age-related trend in KIR expression. The prior study design did not allow us to distinguish individual NK subsets. We speculate that the age-related KIR expression trend seen in the prior study may have been due to the elderly having a greater proportion of CD56dim NK cells, which have high KIR expression. Consistent with our current findings, two recent studies also found no significant trend in NK cell KIR expression in aging adults (47, 48).
More T cells and TCon cells expressed KIR in the elderly subjects than in young adult subjects. Although TNK KIR expression trended higher with age, differences were not statistically significant. A positive correlation between age and CD8 T cell KIR expression has been reported (47, 49). Van Bergen et al found a similar trend in CD4 T cells (50), but that finding was not confirmed by others (47). To our knowledge, ours is the first report of an age-related increase in KIR expression on T cells that do not express CD16 or CD56 NK-associated markers.
We observed a significant age-related decline in NKG2A expression on NK cells and all NK subsets, except CD16−CD56low cells. This result confirms our previous finding that NK cell NKG2A expression declines with age (23). In contrast, Garff-Tavernier et al did not find any change in CD56low NK cell NKG2A expression across adult age groups, although significantly more cord blood CD56low NK cells expressed NKG2A than did adult CD56low NK cells (48). The study design of Garff-Tavernier et al did not allow CD56dim NK cells to be distinguished from CD16−CD56low NK cells, which we found did not decrease NKG2A with age. We speculate that the differences between these two NK subsets accounts for the apparent discrepancy in findings.
With age, NKG2A expression decreased on T cells, including both TCon and TNK. This finding appears to contradict the lack of change in CD8 T cell NKG2A expression in a study of 11 young and 5 elderly adults subjects (49). However, the decline in T cell NKG2A expression was consistent with the age-related decline observed in our prior study of 15 young and 15 elderly subjects (23). It is not clear why NKG2A expression declines in both T and NK cells. NKG2A requires GATA-3 for transcription (51). GATA-3 responds to environmental cues in human hematopoietic cells (52, 53) and GATA family members show complicated changes in aging C. elegans (54). Therefore, changing environmental factors and aging itself might influence the expression of GATA-3 or other transcription factors needed for efficient NKG2A expression.
We were interested in measuring CD57 expression on NK cells because it was reported to be a reliable in vitro T cell senescence marker (29–31). Remarkably, nearly 50% of CD56dim NK cells expressed the CD57 “senescence marker” in young adult women. When we directly measured proliferation in a separate cohort, we found that CD57 was associated with 29% less proliferation among CD56dim NK cells. Our findings are quite consistent with past in vitro studies showing that CD57+ NK cell cytotoxicity and proliferation were good, but less vigorous than that of CD57− NK cells (55, 56). Recently, two groups showed that CD57 expression correlated with other markers of NK maturity on the CD56dim subset (57, 58). CD57+ NK cells were cytotoxic and made considerable IFN-γ in response to crosslinking of several cell surface receptors, but had relatively poor IFN-γ responses to cytokines (57, 58). In both 3H-thymidine uptake assay (55) and CFSE dilution assay (57), proliferation by CD57+ CD56dim NK cells was variable and ranged from very low to 50% that of CD57− CD56dim NK cells. It might be relevant that CD57+ T cells are very prone to apoptosis and appear to be killed by CFSE labeling (59). In vivo, human CD57+ NK cells also proliferated much less than CD57− NK cells in two settings of high NK proliferation: exogenous IL-15 transpresentation in “humanized” mice and early after human hematopoietic stem cell transplantation (57). In contrast, proliferation of CD57− and CD57+ NK cells were much more similar 45 weeks after transplantation (57). The latter finding was comparable to the moderate differences in Ki67 rates that we observed in CD57− and CD57+ NK cells from healthy subjects. The sum of the CD56dim NK cell data suggest that CD57 is associated with somewhat less robust proliferation in stable, healthy human subjects, but is associated with markedly deficient proliferation under highly stimulatory conditions.
CD57 was expressed on many TNK cells but few TCon cells. The high in vivo proliferation rate of TNK cells seemed inconsistent with cell senescence. Therefore, we directly tested how CD57 was related to proliferation. CD57 was associated with 2-fold more Ki67 expression among CD8 T cells and nearly 5-fold more among CD8− (predominantly CD4) T cells. Our findings appear to be at variance with observations that CD57 expression is associated with markers of T cell terminal differentiation and with poor replication in vitro (29–31, 60). We cannot exclude the possibility that Ki67+ CD57+ T cells are in cell cycle arrest. However, our results are consistent with the finding that although CD57+ T cells divided poorly in standard culture conditions, they divided well in media that contained human serum and IL-2 (59). In response to viral peptides, CD57+ CD8 T cells rapidly became cytotoxic and both CD57+ CD4 and CD57+ CD8 cells produced cytokines (30, 31). We propose that CD57 is not a reliable marker of T cell senescence in vivo.
A second major finding of our study is that NK cell proliferation and apoptosis did not significantly change with age, either among NK cells as a whole or in three subsets, CD56bright, CD56dim, and CD16−CD56low. Only CD16+CD56− NK cells showed a significant age-related decline in proliferation, but not in apoptosis. As outlined above, the CD16+CD56− phenotype may comprise several distinct NK subsets and it is not clear from our results why proliferation declined with age. We speculate that the age-related change in proliferation was due to a shift in the proportion of immature NK cells and senescent NK cells that express the CD16+CD56− cell surface phenotype. Prior 2H-DNA labeling data can be interpreted in light of our findings. Day 3 CD3−CD16+ NK cell labeling was not different between the 5 young and 8 elderly adults studied (21), consistent with our observation that CD56dim proliferation rates were similar in young and elderly adults. However, peak labeling was lower in CD3−CD16+ NK cells from elderly subjects than from young adult subjects. Some of this effect might be due to the lower proliferation among CD16+CD56− NK cells in the elderly, although these cells made up less than 20% of CD16+ NK cells in our elderly subjects. Lower peak isotope incorporation into mature NK cells could have been due to less incorporation by immature cells or lower percentage of immature cells. We favor the latter possibility because the elderly have a smaller percentage of CD56bright NK cells [our data and (32, 33)] and because CD56bright NK cell proliferation and apoptosis in the young and elderly is similar [our data]. Another contributing factor could be possible depressed bone marrow production of NK precursors in elderly adults. In conclusion, most NK subsets and NK cells as a whole exhibit similar proliferation and apoptosis in healthy young and elderly adults. It will be important to examine NK turnover and activation in the frail elderly, who have relatively few NK cells and high mortality (14).
Supplementary Material
Acknowledgments
We thank Gregory Jicha for help with donor recruitment, Mikel Moore, Jerold Woodward, Suzanne C. Segerstrom, and Donald Cohen for scientific discussions, Jennifer Strange and Greg Bauman for flow cytometry engineering, and the CR-DOC nurses for phlebotomy. We are grateful to our volunteer research subjects.
Abbreviations
- KIR
killer cell Ig-like receptor
- TCon
conventional T cell
- TNK
NK-like T cell
Footnotes
References
- 1.Caligiuri MA. Human natural killer cells. Blood. 2008;112:461–469. doi: 10.1182/blood-2007-09-077438. [DOI] [PMC free article] [PubMed] [Google Scholar]
- 2.Fauriat C, Long EO, Ljunggren HG, Bryceson YT. Regulation of human NK-cell cytokine and chemokine production by target cell recognition. Blood. 2010;115:2167–2176. doi: 10.1182/blood-2009-08-238469. [DOI] [PMC free article] [PubMed] [Google Scholar]
- 3.Chan A, Hong DL, Atzberger A, Kollnberger S, Filer AD, Buckley CD, McMichael A, Enver T, Bowness P. CD56bright human NK cells differentiate into CD56dim cells: role of contact with peripheral fibroblasts. J Immunol. 2007;179:89–94. doi: 10.4049/jimmunol.179.1.89. [DOI] [PubMed] [Google Scholar]
- 4.Cooley S, Xiao F, Pitt M, Gleason M, McCullar V, Bergemann T, McQueen KL, Guethlein LA, Parham P, Miller JS. A subpopulation of human peripheral blood NK cells that lacks inhibitory receptors for self MHC is developmentally immature. Blood. 2007 doi: 10.1182/blood-2006-07-036228. blood-2006–2007–036228. [DOI] [PMC free article] [PubMed] [Google Scholar]
- 5.Romagnani C, Juelke K, Falco M, Morandi B, D’Agostino A, Costa R, Ratto G, Forte G, Carrega P, Lui G, Conte R, Strowig T, Moretta A, Munz C, Thiel A, Moretta L, Ferlazzo G. CD56brightCD16-killer Ig-like receptor-NK cells display longer telomeres and acquire features of CD56dim NK cells upon activation. J Immunol. 2007;178:4947–4955. doi: 10.4049/jimmunol.178.8.4947. [DOI] [PubMed] [Google Scholar]
- 6.Ouyang Q, Baerlocher G, Vulto I, Lansdorp PM. Telomere length in human natural killer cell subsets. Ann N Y Acad Sci. 2007;1106:240–252. doi: 10.1196/annals.1392.001. [DOI] [PubMed] [Google Scholar]
- 7.Grzywacz B, Kataria N, Verneris MR. CD56dimCD16+ NK cells downregulate CD16 following target cell induced activation of matrix metalloproteinases. Leukemia. 2007;21:356–359. doi: 10.1038/sj.leu.2404499. [DOI] [PubMed] [Google Scholar]
- 8.Ligthart GJ, Schuit HR, Hijmans W. Natural killer cell function is not diminished in the healthy aged and is proportional to the number of NK cells in the peripheral blood. Immunology. 1989;68:396–402. [PMC free article] [PubMed] [Google Scholar]
- 9.Keskin DB, Allan DSJ, Rybalov B, Andzelm MM, Stern JNH, Kopcow HD, Koopman LA, Strominger JL. TGFβ promotes conversion of CD16+ peripheral blood NK cells into CD16− NK cells with similarities to decidual NK cells. Proc Natl Acad Sci U S A. 2007;104:3378–3383. doi: 10.1073/pnas.0611098104. [DOI] [PMC free article] [PubMed] [Google Scholar]
- 10.Mavilio D, Lombardo G, Benjamin J, Kim DK, Follman D, Marcenaro E, O’Shea MA, Kinter A, Kovacs C, Moretta A, Fauci AS. Characterization of CD56−/CD16+ natural killer (NK) cells: A highly dysfunctional NK subset expanded in HIV-infected viremic individuals. Proc Natl Acad Sci U S A. 2005;102:2886–2891. doi: 10.1073/pnas.0409872102. [DOI] [PMC free article] [PubMed] [Google Scholar]
- 11.Hu PF, Hultin LE, Hultin P, Hausner MA, Hirji K, Jewett A, Bonavida B, Detels R, Giorgi JV. Natural killer cell immunodeficiency in HIV disease is manifest by profoundly decreased numbers of CD16+CD56+ cells and expansion of a population of CD16dimCD56-cells with low lytic activity. J Acquir Immune Defic Syndr. 1995;10:331–340. [PubMed] [Google Scholar]
- 12.McCullar V, Oostendorp R, Panoskaltsis-Mortari A, Yung G, Lutz CT, Wagner JE, Miller JS. Mouse fetal and embryonic liver cells differentiate human umbilical cord blood progenitors into CD56-negative natural killer cell precursors in the absence of interleukin-15. Exp Hematol. 2008;36:598–608. doi: 10.1016/j.exphem.2008.01.001. [DOI] [PMC free article] [PubMed] [Google Scholar]
- 13.Phillips JH, Hori T, Nagler A, Bhat N, Spits H, Lanier LL. Ontogeny of human natural killer (NK) cells: fetal NK cells mediate cytolytic function and express cytoplasmic CD3 epsilon, delta proteins. J Exp Med. 1992;175:1055–1066. doi: 10.1084/jem.175.4.1055. [DOI] [PMC free article] [PubMed] [Google Scholar]
- 14.Solana R, Pawelec G, Tarazona R. Aging and innate immunity. Immunity. 2006;24:491–494. doi: 10.1016/j.immuni.2006.05.003. [DOI] [PubMed] [Google Scholar]
- 15.Krishnaraj R, Blandford G. Age-associated alterations in human natural killer cells. 2. Increased frequency of selective NK subsets. Cell Immunol. 1988;114:137–148. doi: 10.1016/0008-8749(88)90261-4. [DOI] [PubMed] [Google Scholar]
- 16.Krishnaraj R, Svanborg A. Preferential accumulation of mature NK cells during human immunosenescence. J Cell Biochem. 1992;50:386–391. doi: 10.1002/jcb.240500407. [DOI] [PubMed] [Google Scholar]
- 17.Vacher-Coponat H, Brunet C, Lyonnet L, Bonnet E, Loundou A, Sampol J, Moal V, Dussol B, Brunet P, Berland Y, Dignat-George F, Paul P. Natural killer cell alterations correlate with loss of renal function and dialysis duration in uraemic patients. Nephrol Dial Transplant. 2008;23:1406–1414. doi: 10.1093/ndt/gfm596. [DOI] [PubMed] [Google Scholar]
- 18.Vredevoe DL, Widawski M, Fonarow GC, Hamilton M, Martinez-Maza O, Gage JR. Interleukin-6 (IL-6) expression and natural killer (NK) cell dysfunction and anergy in heart failure. Am J Cardiol. 2004;93:1007–1011. doi: 10.1016/j.amjcard.2003.12.054. [DOI] [PubMed] [Google Scholar]
- 19.Bruunsgaard H, Pedersen AN, Schroll M, Skinhøj P, Pedersen BK. Decreased natural killer cell activity is associated with atherosclerosis in elderly humans. Exp Gerontol. 2001;37:127–136. doi: 10.1016/s0531-5565(01)00162-0. [DOI] [PubMed] [Google Scholar]
- 20.Jamieson AM, Isnard P, Dorfman JR, Coles MC, Raulet DH. Turnover and proliferation of NK cells in steady state and lymphopenic conditions. J Immunol. 2004;172:864–870. doi: 10.4049/jimmunol.172.2.864. [DOI] [PubMed] [Google Scholar]
- 21.Zhang Y, Wallace DL, de Lara CM, Ghattas H, Asquith B, Worth A, Griffin GE, Taylor GP, Tough DF, Beverley PCL, Macallan DC. In vivo kinetics of human natural killer cells: the effects of ageing and acute and chronic viral infection. Immunology. 2007;121:258–265. doi: 10.1111/j.1365-2567.2007.02573.x. [DOI] [PMC free article] [PubMed] [Google Scholar]
- 22.De Boer RJ, Mohri H, Ho DD, Perelson AS. Turnover rates of B cells, T cells, and NK cells in simian immunodeficiency virus-infected and uninfected rhesus macaques. J Immunol. 2003;170:2479–2487. doi: 10.4049/jimmunol.170.5.2479. [DOI] [PubMed] [Google Scholar]
- 23.Lutz CT, Moore MB, Bradley S, Shelton BJ, Lutgendorf SK. Reciprocal age related changes in natural killer receptors for MHC class I. Mech Ageing Dev. 2005;126:722–731. doi: 10.1016/j.mad.2005.01.004. [DOI] [PMC free article] [PubMed] [Google Scholar]
- 24.Pozarowski P, Grabarek J, Darzynkiewicz Z. Flow cytometry of apoptosis. In: Robinson JP, et al., editors. edCurrent potocols in cytometry. John Wiley & Sons, Inc; New York, NY: 2003. pp. 7.19.11–17.19.33. [Google Scholar]
- 25.Moore MB, Kurago ZB, Fullenkamp CF, Lutz CT. Squamous cell carcinoma cells differentially stimulate NK cell effector functions: the role of IL-18. Cancer Immunology Immunotherapy. 2003;52:107–115. doi: 10.1007/s00262-002-0361-8. [DOI] [PMC free article] [PubMed] [Google Scholar]
- 26.Ribeiro RM, Mohri H, Ho DD, Perelson AS. In vivo dynamics of T cell activation, proliferation, and death in HIV-1 infection: Why are CD4+ but not CD8+ T cells depleted? Proc Natl Acad Sci U S A. 2002;99:15572–15577. doi: 10.1073/pnas.242358099. [DOI] [PMC free article] [PubMed] [Google Scholar]
- 27.Naylor K, Li G, Vallejo AN, Lee WW, Koetz K, Bryl E, Witkowski J, Fulbright J, Weyand CM, Goronzy JJ. The influence of age on T cell generation and TCR diversity. J Immunol. 2005;174:7446–7452. doi: 10.4049/jimmunol.174.11.7446. [DOI] [PubMed] [Google Scholar]
- 28.Kronenberg M. Toward an understanding of NKT cell biology: progress and paradoxes. Annu Rev Immunol. 2005;23:877–900. doi: 10.1146/annurev.immunol.23.021704.115742. [DOI] [PubMed] [Google Scholar]
- 29.Brenchley JM, Karandikar NJ, Betts MR, Ambrozak DR, Hill BJ, Crotty LE, Casazza JP, Kuruppu J, Migueles SA, Connors M, Roederer M, Douek DC, Koup RA. Expression of CD57 defines replicative senescence and antigen-induced apoptotic death of CD8+ T cells. Blood. 2003;101:2711–2720. doi: 10.1182/blood-2002-07-2103. [DOI] [PubMed] [Google Scholar]
- 30.Le Priol Y, Puthier D, Lecureuil C, Combadiere C, Debre P, Nguyen C, Combadiere B. High cytotoxic and specific migratory potencies of senescent CD8+CD57+ cells in HIV-infected and uninfected individuals. J Immunol. 2006;177:5145–5154. doi: 10.4049/jimmunol.177.8.5145. [DOI] [PubMed] [Google Scholar]
- 31.Palmer BE, Blyveis N, Fontenot AP, Wilson CC. Functional and phenotypic characterization of CD57+CD4+ T cells and their association with HIV-1-induced T cell dysfunction. J Immunol. 2005;175:8415–8423. doi: 10.4049/jimmunol.175.12.8415. [DOI] [PubMed] [Google Scholar]
- 32.Borrego F, Alonso MC, Galiani MD, Carracedo J, Ramirez R, Ostos B, Peña J, Solana R. NK phenotypic markers and IL2 response in NK cells from elderly people. Exp Gerontol. 1999;34:253–265. doi: 10.1016/s0531-5565(98)00076-x. [DOI] [PubMed] [Google Scholar]
- 33.Krishnaraj R. Senescence and cytokines modulate the NK cell expression. Mech Ageing Dev. 1997;96:89–101. doi: 10.1016/s0047-6374(97)00045-6. [DOI] [PubMed] [Google Scholar]
- 34.Tarazona R, DelaRosa O, Alonso C, Ostos B, Espejo J, Pena J, Solana R. Increased expression of NK cell markers on T lymphocytes in aging and chronic activation of the immune system reflects the accumulation of effector/senescent T cells. Mech Ageing Dev. 2000;121:77–88. doi: 10.1016/s0047-6374(00)00199-8. [DOI] [PubMed] [Google Scholar]
- 35.Wallace DL, Zhang Y, Ghattas H, Worth A, Irvine A, Bennett AR, Griffin GE, Beverley PCL, Tough DF, Macallan DC. Direct measurement of T cell subset kinetics in vivo in elderly men and women. J Immunol. 2004;173:1787–1794. doi: 10.4049/jimmunol.173.3.1787. [DOI] [PubMed] [Google Scholar]
- 36.Borghans JAM, de Boer RJ. Quantification of T-cell dynamics: from telomeres to DNA labeling. Immunol Rev. 2007;216:35–47. doi: 10.1111/j.1600-065X.2007.00497.x. [DOI] [PubMed] [Google Scholar]
- 37.Čičin-Šain L, Messaoudi I, Park B, Currier N, Planer S, Fischer M, Tackitt S, Nikolich-Žugich D, Legasse A, Axthelm MK, Picker LJ, Mori M, Nikolich-Žugich J. Dramatic increase in naïve T cell turnover is linked to loss of naïve T cells from old primates. Proc Natl Acad Sci USA. 2007;104:19960–19965. doi: 10.1073/pnas.0705905104. [DOI] [PMC free article] [PubMed] [Google Scholar]
- 38.Lamb LS, Jr, Gee AP, Henslee-Downey PJ, Geier SS, Hazlett L, Pati AR, Godder K, Abhyankar SA, Turner MW, Lee C, Harris WG, Parrish RS. Phenotypic and functional reconstitution of peripheral blood lymphocytes following T cell-depleted bone marrow transplantation from partially mismatched related donors. Bone Marrow Transplant. 1998;21:461–471. doi: 10.1038/sj.bmt.1701110. [DOI] [PubMed] [Google Scholar]
- 39.Webster RL, Johnson RP. Delineation of multiple subpopulations of natural killer cells in rhesus macaques. Immunology. 2005;115:206–214. doi: 10.1111/j.1365-2567.2005.02147.x. [DOI] [PMC free article] [PubMed] [Google Scholar]
- 40.Sun JC, Beilke JN, Lanier LL. Adaptive immune features of natural killer cells. Nature. 2009;457:557–561. doi: 10.1038/nature07665. [DOI] [PMC free article] [PubMed] [Google Scholar]
- 41.O’Leary JG, Goodarzi M, Drayton DL, von Andrian UH. T cell- and B cell-independent adaptive immunity mediated by natural killer cells. Nat Immunol. 2006;7:507–516. doi: 10.1038/ni1332. [DOI] [PubMed] [Google Scholar]
- 42.Paust S, Gill HS, Wang B-Z, Flynn MP, Moseman EA, Senman B, Szczepanik M, Telenti A, Askenase PW, Compans RW, von Andrian UH. Critical role for the chemokine receptor CXCR6 in NK cell-mediated antigen-specific memory of haptens and viruses. Nat Immunol. 2010 doi: 10.1038/ni.1953. advance online publication. [DOI] [PMC free article] [PubMed] [Google Scholar]
- 43.Kottilil SMDP, Jackson JOBA, Reitano KNBS, O’Shea MARN, Roby GRN, Lloyd MRN, Yang JMS, Hallahan CWMS, Rehm CABA, Arthos JP, Lempicki RP, Fauci ASMD. Innate immunity in HIV infection: enhanced susceptibility to CD95-mediated natural killer cell death and turnover induced by HIV viremia. JAIDS Journal of Acquired Immune Deficiency Syndromes. 2007;46:151–159. doi: 10.1097/QAI.0b013e3180dc9909. [DOI] [PubMed] [Google Scholar]
- 44.Takahashi E, Kuranaga N, Satoh K, Habu Y, Shinomiya N, Asano T, Seki S, Hayakawa M. Induction of CD16+ CD56bright NK cells with antitumour cytotoxicity not only from CD16-CD56bright NK Cells but also from CD16-CD56dim NK cells. Scand J Immunol. 2007;65:126–138. doi: 10.1111/j.1365-3083.2006.01883.x. [DOI] [PubMed] [Google Scholar]
- 45.Lu X, Kondo Y, Takamatsu H, Ohata K, Yamazaki H, Takami A, Akatsuka Y, Nakao S. CD16+ CD56− NK cells in the peripheral blood of cord blood transplant recipients: a unique subset of NK cells possibly associated with graft-versus-leukemia effect. Eur J Haematol. 2008;81:18–25. doi: 10.1111/j.1600-0609.2008.01073.x. [DOI] [PubMed] [Google Scholar]
- 46.Philippé J, Louagie H, Thierens H, Vral A, Cornelissen M, De Ridder L. Quantification of apoptosis in lymphocyte subsets and effect of apoptosis on apparent expression of membrane antigens. Cytometry. 1997;29:242–249. [PubMed] [Google Scholar]
- 47.Li G, Yu M, Weyand CM, Goronzy JJ. Epigenetic regulation of killer immunoglobulin-like receptor expression in T cells. Blood. 2009;114:3422–3430. doi: 10.1182/blood-2009-01-200170. [DOI] [PMC free article] [PubMed] [Google Scholar]
- 48.Garff-Tavernier ML, Béziat V, Decocq J, Siguret V, Gandjbakhch F, Pautas E, Debré P, Merle-Beral H, Vieillard V. Human NK cells display major phenotypic and functional changes over the life span. Aging Cell. 2010;9:527–535. doi: 10.1111/j.1474-9726.2010.00584.x. [DOI] [PubMed] [Google Scholar]
- 49.Anfossi N, Pascal V, Vivier E, Ugolini S. Biology of T memory type 1 cells. Immunol Rev. 2001;181:269–278. doi: 10.1034/j.1600-065x.2001.1810123.x. [DOI] [PubMed] [Google Scholar]
- 50.van Bergen J, Thompson A, van der Slik A, Ottenhoff THM, Gussekloo J, Koning F. Phenotypic and functional characterization of CD4 T cells expressing killer Ig-like receptors. J Immunol. 2004;173:6719–6726. doi: 10.4049/jimmunol.173.11.6719. [DOI] [PubMed] [Google Scholar]
- 51.Marusina AI, Kim DK, Lieto LD, Borrego F, Coligan JE. GATA-3 is an important transcription factor for regulating human NKG2A gene expression. J Immunol. 2005;174:2152–2159. doi: 10.4049/jimmunol.174.4.2152. [DOI] [PubMed] [Google Scholar]
- 52.Muzzioli M, Stecconi R, Donnini A, Re F, Provinciali M. Zinc improves the development of human CD34+ cell progenitors towards Natural Killer cells and induces the expression of GATA-3 transcription factor. Int J Biochem Cell Biol. 2007;39:955–965. doi: 10.1016/j.biocel.2007.01.011. [DOI] [PubMed] [Google Scholar]
- 53.Muzzioli M, Stecconi R, Moresi R, Provinciali M. Zinc improves the development of human CD34+ cell progenitors towards NK cells and increases the expression of GATA-3 transcription factor in young and old ages. Biogerontology. 2009;10:593–604. doi: 10.1007/s10522-008-9201-3. [DOI] [PubMed] [Google Scholar]
- 54.Budovskaya YV, Wu K, Southworth LK, Jiang M, Tedesco P, Johnson TE, Kim SK. An elt-3/elt-5/elt-6 GATA transcription circuit guides aging in C. elegans. Cell. 2008;134:291–303. doi: 10.1016/j.cell.2008.05.044. [DOI] [PMC free article] [PubMed] [Google Scholar]
- 55.Phillips JH, Lanier LL. A model for the differentiation of human natural killer cells. Studies on the in vitro activation of Leu-11+ granular lymphocytes with a natural killer-sensitive tumor cell, K562. J Exp Med. 1985;161:1464–1482. doi: 10.1084/jem.161.6.1464. [DOI] [PMC free article] [PubMed] [Google Scholar]
- 56.Lanier LL, Le AM, Phillips JH, Warner NL, Babcock GF. Subpopulations of human natural killer cells defined by expression of the LEU-7 (HNK-1) and LEU-11 (NK-15) antigens. J Immunol. 1983;131:1789–1796. [PubMed] [Google Scholar]
- 57.Björkström NK, Riese P, Heuts F, Andersson S, Fauriat C, Ivarsson MA, Björklund AT, Flodström-Tullberg M, Michaëlsson J, Rottenberg ME, Guzmán CA, Ljunggren HG, Malmberg KJ. Expression patterns of NKG2A, KIR, and CD57 define a process of CD56dim NK-cell differentiation uncoupled from NK-cell education. Blood. 2010;116:3853–3864. doi: 10.1182/blood-2010-04-281675. [DOI] [PubMed] [Google Scholar]
- 58.Lopez-Vergès S, Milush JM, Pandey S, York VA, Arakawa-Hoyt J, Pircher H, Norris PJ, Nixon DF, Lanier LL. CD57 defines a functionally distinct population of mature NK cells in the human CD56dimCD16+ NK-cell subset. Blood. 2010;116:3865–3874. doi: 10.1182/blood-2010-04-282301. [DOI] [PMC free article] [PubMed] [Google Scholar]
- 59.Chong LK, Aicheler RJ, Llewellyn-Lacey S, Tomasec P, Brennan P, Wang ECY. Proliferation and interleukin 5 production by CD8hiCD57+ T cells. Eur J Immunology. 2008;38:995–1000. doi: 10.1002/eji.200737687. [DOI] [PMC free article] [PubMed] [Google Scholar]
- 60.Ibegbu CC, Xu YX, Harris W, Maggio D, Miller JD, Kourtis AP. Expression of killer cell lectin-like receptor G1 on antigen-specific human CD8+ T lymphocytes during active, latent, and resolved infection and its relation with CD57. J Immunol. 2005;174:6088–6094. doi: 10.4049/jimmunol.174.10.6088. [DOI] [PubMed] [Google Scholar]
Associated Data
This section collects any data citations, data availability statements, or supplementary materials included in this article.