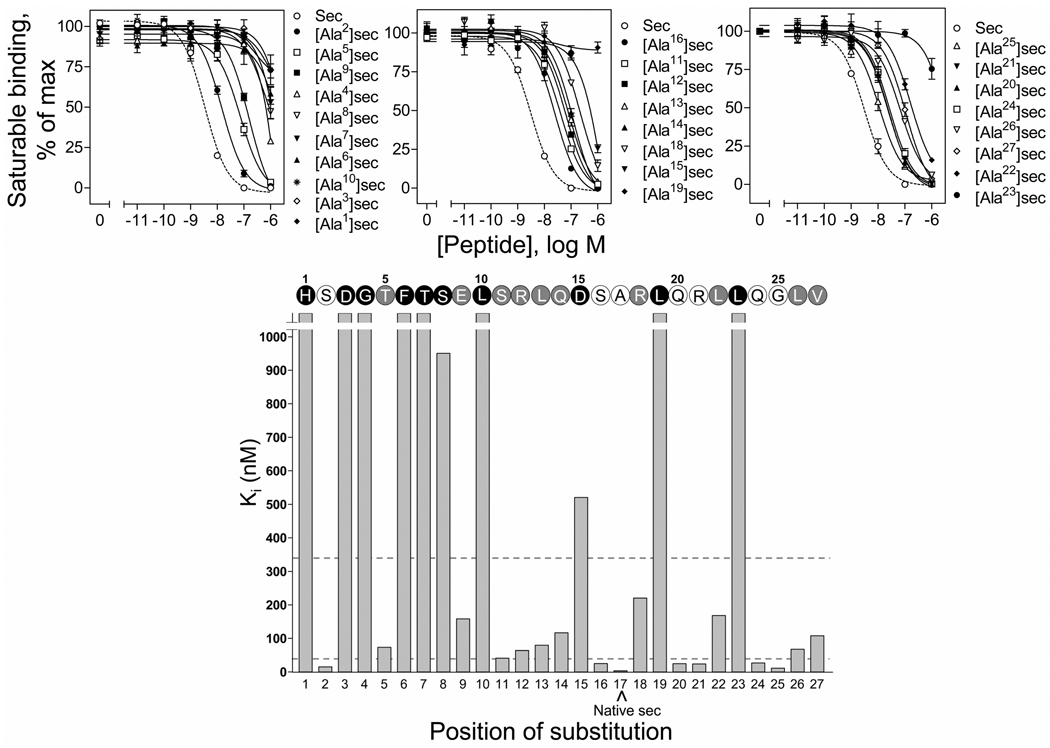
FIGURE 1.
Binding activities of the alanine-replacement secretin analogues. Top, binding curves of increasing concentrations of secretin and alanine-replacement secretin analogues to compete for binding of radioligand [125I-Tyr10]rat secretin-27 to secretin receptor-bearing CHO-SecR cells. Values illustrated represent saturable binding as percentages of maximal binding observed in the absence of the competing peptide and are expressed as the means ± S.E.M. of duplicate values from a minimum of three independent experiments. Data are presented in three groups, i.e. amino-terminal (top left panel, positions 1 to 10), mid-region (top middle panel, positions 11 to 19) and carboxyl-terminal (top right panel, positions 21 to 27) based on the positions of incorporating alanine in secretin, with the affinities in each group being illustrated in the order of high to low. Bottom, role of each residue in secretin binding to its receptor. Shown are the Ki values of each of the alanine-replacement secretin analogues and the secretin sequence illustrating the role of each residue in binding to the secretin receptor. Open circles represent residues whose replacement by alanine resulted in less than 10-fold in binding affinity comparing to native secretin. Grey and black circles represent residues whose replacement with alanine resulted in more than 10-fold but less than 100-fold, and more than 100-fold increase in binding affinity (dashed lines), respectively, comparing to native secretin. Sec, secretin.

