

Abstract
To evaluate the consequences of expression of the protein encoded by PAX3-FOXO1 (P3F) in the pediatric malignancy alveolar rhabdomyosarcoma (A-RMS), we developed and evaluated a genetically defined in vitro model of A-RMS tumorigenesis. The expression of P3F in cooperation with simian virus 40 (SV40) Large-T (LT) antigen in murine C3H10T1/2 fibroblasts led to robust malignant transformation. Using 2 dimensional difference gel electrophoresis (2D-DIGE) we compared proteomes from lysates from cells that express P3F + LT versus from cells that express LT alone. Analysis of 2D gel spot patterns by DeCyder™ image analysis software indicated 93 spots that were different in abundance. Peptide mass fingerprint analysis of the 93 spots by matrix assisted laser desorption ionization time-of-flight mass spectrometry (MALDI-TOF MS) analysis identified 37 non-redundant proteins. 2D DIGE analysis of cell culture media conditioned by cells transduced by P3F + LT versus by LT alone found 29 spots in the P3F + LT cells leading to the identification of 11 non-redundant proteins. A substantial number of proteins with potential roles in tumorigenesis and myogenesis were detected, most of which have not been identified in previous wide-scale expression studies of RMS experimental models or tumors. We validated the 2D gel image analysis findings by western blot analysis and immunohistochemistry (IHC). Thus, the 2D DIGE proteomics methodology described here provided an important discovery approach to the study of RMS biology and complements the findings of previous mRNA expression studies.
Introduction
Rhabdomyosarcoma (RMS) is the most common soft-tissue sarcoma of childhood. Based on histopathologic criteria, RMS tumors are categorized as embryonal (E-RMS) or alveolar (A-RMS) subtypes. Most A-RMS tumors are characterized by the t(2;13)(q35;q14) chromosomal translocation that encodes PAX3-FOXO1 (P3F). 1 Compared to E-RMS tumors, A-RMS tumors carry a particularly aggressive clinical phenotype with an increased propensity to metastasize and a resistance to therapy.2 Patients with metastatic or refractory A-RMS tumors carry a dismal prognosis. P3F is composed of the DNA binding domain of PAX3 and the transactivation domain of FOXO1. The resulting fusion oncoprotein possesses potent transcriptional activity and transforming properties.3 Detection of PAX3-FOXO1 or the variant t(1;13)(p36;q14) PAX7-FOXO1 by fluorescence in situ hybridization (FISH) or mRNA expression is diagnostic of A-RMS tumors. A subset of A-RMS tumors does not express either P3F or PAX7-FOXO1. The nature of the so-called “fusion-negative” A-RMS tumors is poorly understood, but recent data suggest that such tumors are more comparable to E-RMS tumors as evidenced by gene expression and genomic findings.4-6 Further study of P3F expression is crucial to gaining better understanding of the biology of RMS tumorigenesis. Given the fundamental role of P3F in the genesis of most A-RMS tumors, targeted therapies directed at P3F or proteins that are upregulated by or collaborate with P3F may represent a particularly potent treatment strategy.
To study the consequences of P3F expression on the cellular proteome during malignant transformation, we have developed a genetically defined cell culture model of A-RMS tumors. P3F in tandem with simian virus 40 (SV40) large-T antigen (LT) was transduced in murine fibroblasts.7, 8 The co-expression of P3F and LT, but not the expression of either P3F or LT alone, led to a robust model of transformation. To study the effects of P3F on the RMS skeletal muscle phenotype, non-myogenic C3H10T1/2 embryonic murine fibroblasts were utilized. Whole cell lysates and conditioned media from the transduced cells were analyzed by two–dimension difference gel electrophoretic (2D-DIGE) and matrix assisted laser desorption ionization time of flight (MALDI-TOF) or liquid chromatography tandem mass spectrometry (LC-MS/MS) methodology. The comprehensive proteomic analysis of the transforming properties of the A-RMS tumor fusion oncogene P3F has led to the identification of proteins that may be critical to the biology of A-RMS tumors and/or may serve as biomarkers of RMS tumors. The study of media conditioned by transformed cells provides insight into the interaction of RMS tumor cells with the surrounding environment and may highlight mechanisms by which tumor cells invade adjacent tissues and metastasize.
Materials and Methods
Retroviral transductions and cell culture
EcoPack2-293 packaging cells (Clontech) cultured on collagen coated plates were transfected by calcium phosphate precipitation methodology with LT subcloned into pBabe-puromycin, P3F subcloned into pLJD-neomycin, or corresponding empty vector controls.9 Resulting virus-containing supernatant was used to infect the target C3H10T1/2 fibroblasts with LT + P3F, LT + empty vector pLJD, P3F + empty vector pBabe, or empty vector alone. Transduced cells were selected with the appropriate antibiotic (neomycin and/or puromycin) and mixed cultures of stable transductants were maintained in Dulbecco modified essential medium (DMEM) supplemented with 10% fetal bovine serum (FBS). For 2D gel or Western blot analysis, cells were harvested as follows: media was aspirated, the cells rinsed with 5 ml phosphate buffered saline (PBS), then incubated for 15 min with 0.05% trypsin (Mediatech), then rinsed of trypsin, scraped into 5 ml PBS, and centrifuged at 1,500 rpm at 4°C for 10 min, and rinsed 3 additional times with 5 ml PBS, using the same centrifugation conditions. Each final cell pellet from a 10 cm round cell culture dish was then resuspended in 100 μl of isoelectric focusing (IEF) buffer (7 M urea/2 M thiourea/40 mM Tris, pH 8.5/4% CHAPS). After homogenization in a Dounce homogenizer, the solubilized cell pellets were clarified by centrifugation at 100,000 × g for 30 min at 22°C
To document the formation of colony foci, 500 transduced cells were plated onto 100mm plates and cultured for 21 days in DMEM with 20% FBS serum, replacing media every 7 days. Foci were stained with crystal violet dissolved in 25% methanol and documented by standard electronic photography. Soft-agar anchorage independent growth was assessed by mixing stably transduced cells (3.5 × 10⁴) in 0.33% low-melt noble agar seeded onto 0.5% agar in 100 mm plates. Cells were fed 20% FBS every 3 to 4 days for a total of 21 to 28 days. Colonies were observed under 10× magnification and colonies larger than 500 micrometers quantified. The ability of transduced cells to form allograft tumors was assessed by suspending 1 × 10⁶ cells in PBS or Matrigel (Becton-Dickinson) and then injecting subcutaneously into the hind flank of non obese diabetic severe combined immunodeficiency disease (Nod-Scid) mice (Jackson Laboratories). Tumor growth was observed for 30 days. All animal protocols were approved by the University of Alabama at Birmingham (UAB) Institutional Animal Care and Use Committee (IACUC).
Conditioned media
Proliferating cells were grown to 90% confluency in 10 cm plates in DMEM supplemented with 10% FBS. The plates were then washed three times with serum-free DMEM, incubated at 37°C for one hour in serum-free DMEM, washed twice more in serum-free DMEM, and then finally incubated in 3ml of serum-free DMEM at 37°C for 48 hours. Conditioned media were collected, filtered through a 0.45 μm filter (Whatman Puradisc, GE Healthcare) and centrifuged at room temperature for 10 minutes at 13000 rpm to remove cellular debris. The supernates were then concentrated using Centriprep centrifugal filter devices (Millipore) with a molecular weight cutoff of 3000 MW by centrifugation for one hour at 2000 rpm. Concentrate (0.8 ml) was collected for each sample of cultured media from each 10 cm plate of cells, representing a 3.8-fold concentration. These concentrates were frozen at -80°C until analysis.
Real-time quantitative reverse transcriptase polymerase chain reaction
RNA was extracted from cells by phenol/chloroform extraction, subjected to reverse transcription, and the gene of interest and a Gapdh control assay were measured by qRT-PCR on an ABI-Prism 7900HT Sequence Detection System and relative quantification calculated by the ΔΔCt method.10 This method determines relative fold changes in gene expression by comparing the change in expression of a target sequence in a ‘test’ sample relative to the same sequence in a ‘calibrator’ sample. The sequence of the P3F forward primer used was AGGCATGGATTTTCCAGCTATA, the reverse primer was GGGACAGATTATGACGAATTGAATT, and the 6-FAM labeled probe sequence was CACCATTGGCAATGGCCTCTCA. The murine specific primer and probe sets for Gapdh and all other genes of interest were purchased from Applied Biosystems.
Western blotting
Whole cell lysates were prepared from cultured cells with Mammalian Protein Extraction Reagent (M-PER) (Pierce Biotechnology); briefly, cell culture medium was removed and adherent cells were washed with PBS. After adding 1 mL of M-PER reagent, the 10 cm plate was gently shaken for 5 minutes. The resulting lysate was centrifuged at 14,000 × g for 10 minutes, and then the supernatant was transferred to a new tube for further analysis. Bio-Rad Protein Assay reagent (Bio-Rad Laboratories) was used to quantify the protein concentrations in the whole cell lysates, using bovine serum albumin (BSA) to generate a standard curve. M-PER-cell lysates containing 15 μg protein were loaded onto 7.5-12.5% SDS-PAGE gels, electrophoresed until the tracking dye was 0.5 cm from the gel bottom, then transferred overnight onto 0.45 μm Immobolin-P PVDF membrane (Millipore). The membranes were blocked for one hour at room temp. in 0.1% Tween 20 tris-buffered saline (TBST) containing 5% non-fat milk, and then incubated with appropriate primary polyclonal rabbit antibodies (Santa Cruz Biotechnology) overnight at room temperature. The membranes were rinsed three times for 10 minutes each with TBST, and then incubated with a 1:2000 dilution of secondary horseradish peroxidase (HRP) conjugated goat anti rabbit IgG (Amersham Biosciences) for one hour at room temperature. The membranes were once again washed with TBST three times, for 10 minutes each. HRP activity was detected using ECL Western Blotting Detection Reagent (GE Healthcare Life Sciences).
2D Difference Gel Electrophoresis (DIGE)
For each 2D DIGE gel, 50 μg of cell lysates in IEF buffer prepared from P3F + LT-transduced cells or LT-transduced cells were labeled with Cy3 or Cy5 respectively according to manufacturer's guidelines10. To create an internal standard, aliquots of each sample in the dataset containing equal amounts of protein were pooled and reacted with Cy2. For 3 of the 2D gels, LT-cell protein extract was labeled with Cy3, and the P3F + LT protein extract was labeled with Cy5. For the other 3 gels, the cell extract labeling was reversed, to ensure that there was no differential labeling of a sample with either Cy3 or Cy5. The labeling reaction was quenched by adjusting the solution to 10 mM glycine. The labeled samples were diluted to 220 μl with IEF rehydration buffer, and 11 cm immobilized pH gradient (IPG) strips containing pH gradient of 407 were rehydrated in IPG strip rehydration trays (GE Healthcare) overnight over the 220 μl samples in IEF buffer, under mineral oil. The next day, isoelectric focusing was carried out for all IPG strips at the same time using standard manufacturer's (GE Healthcare) guidelines for 11 cm strips overnight. The next day, the strips were rinsed lightly to get rid of excess oil, then equilibrated for 15 min in SDS-sample buffer containing 65 mM DTT, then for 15 min in SDS-sample buffer containing 135 mM iodoacetamide. The strips were then laid on top of 12.5% acrylamide Criterion gels (Bio-Rad), and SDS-PAGE was carried out for all gels in the same tank. Immediately following the end of the electrophoresis (2 h), Cy2, Cy3, and Cy5 images were acquired for each 2D gel with the Typhoon Trio+™ Variable Mode Imaging System (GE Healthcare) with specific laser band pass filters for each dye's excitation and emission wavelengths. The excitation/emission combination wavelengths were (480 ± 35 nm)/(530 ± 30 nm) for Cy2, (540 ± 25 nm)/(590 ± 35 nm) for Cy3, and (620 ± 30 nm)/(680 ± 30 nm) for Cy5. Gels were scanned individually and Photo Multiplier Tube (PMT) voltages were adjusted for maximum image quality with minimal signal saturation and clipping. Images were checked for saturation during the acquisition process using ImageQuant TL™ software (GE Healthcare). Images were exported as 16-bit GEL files, cropped using ImageQuant TL™ software and exported into DeCyder™ (GE Healthcare) for image analysis.
The DIGE analysis of the conditioned media was implemented in a similar manner as for the cell lysates. After the protein concentration was determined for each sample of conditioned media, volumes of each containing 150 μg of protein were subjected to methanol/chloroform extraction according to established protocol to concentrate the protein11; briefly each volume containing 150 μg protein was mixed sequentially with 4 volumes of methanol, 1 volume of chloroform, and 3 volumes of water, and centrifuged at 10,000 rpm for 1 min in a microcentrifuge. The aqueous (upper) phase was carefully aspired off, down to the protein that had collected at the interface. 3 volumes of methanol were added, and the mixture re-centrifuged to pellet the precipitated protein. After discarding the supernatant and air-drying the protein precipitate, the latter were resuspended in IEF buffer as before for the cell lysates, protein assays carried out to determine protein concentration, and volumes of each containing 50 μg protein were reacted with Cy dyes as described for the cell lysates. As with the latter, an internal standard was created for the conditioned media samples by reacting with Cy2 a pooled mixture of the two conditioned media samples containing equivalent amounts of each.
Image analysis
2D DIGE gel images were analyzed using the Batch Processor, Difference In gel Analysis (DIA), and Biological Variation Analysis (BVA) software modules within DeCyder™ (GE Healthcare). Batch Processing was accomplished setting 1500 spots as the upper limit. In DIA, individual gel images were analyzed for spot number, and spot intensities by comparing either a Cy3 or Cy5 image against the Cy2 image from either the LT or P3F + LT transductants. Spot patterns across different gels in the dataset were matched in the BVA module using the Cy2-spot pattern on each gel, and analyzed for differences in abundance, normalized against the Cy2 intensity for any given spot. Results were expressed as standard abundance ratios for each protein spot (P3F + LT relative to LT alone). The statistical significance of each expression level was calculated using Student's t-test on the log-transformed ratios (log P3F + LT/ LT alone). Gel spots that were statistically significant (p<0.05) across all 6 gels in the dataset were accepted as being different in abundance between the cell lysates. Samples were re-electrophoresed on 2D gels loaded with 500 μg of unlabelled protein, and the gels visualized with Sypro Ruby fluorescent stain. Protein spots determined to be significantly different in abundance between the two cell lysates by DeCyder™ were excised from these preparative gels and processed through matrix-assisted laser desorption ionization time of flight mass spectrometry analysis as described below.
MALDI-TOF MS sample processing
Sypro and Coomassie-stained gel spots were excised using the ProPic robotic spot picker (Genomic Solutions), and processed for MS. Gel plugs were destained with three consecutive washes of a 1:1 mixture of 50 mM Ammonium bicarbonate (ABC): 50% Acetonitrile for a total of 30 minutes. Reduction of cysteines was carried out by incubating the gel plugs in 50 mM ABC containing 20 mM DTT at 60°C for 60 minutes. Alkylation of free cysteine residues was then accomplished by incubation of the gel plugs in 55 mM iodoacetamide in 50 mM ABC for 60 min at room temperature. Samples were washed for ten minutes with 50 mM ABC prior to digestion with enzyme. Enzymatic digestion with Trypsin (12.5 ng/uL) (Promega Gold Trypsin Mass Spectrometry Grade) was carried out for sixteen hours at 37°C. Peptides were then extracted using two washes of 100ul of a 50/50 solution of 5% formic acid and acetonitrile for thirty minutes. Supernatants were collected and dried down in a Savant SpeedVac. Samples were resuspended in 10ul of 0.1% Trifluoroacetic acid. C18 ZipTips (Millipore) were used to desalt peptide mixtures before applying samples to the Applied Biosystems MALDI-TOF 96-well target plate. Peptides were mixed in 1/10 dilutions with a solution of α-Cyano-4-hydroxycinnamic acid matrix (5mg/mL). Samples were allowed to dry before performing MALDI-TOF MS utilizing the Voyager DE-Pro in positive mode. Spectra were then analyzed using Voyager Explorer software, and peptide masses were submitted to MASCOT database for protein identifications.
NanoLiquid Chromatography-tandem mass spectrometry (LC-MS/MS)
In selected cases, peptide sequencing by LC-MS/MS was utilized to confirm protein identifications. An aliquot (5-10 μL) of each digest was loaded onto a 5mm × 100 μm i.d. C18 reverse-phase cartridge at 2 μL/min using a PAL robot (Leap Technologies). After washing the cartridge for 5 min with 0.1% formic acid in ddH20, the bound peptides were flushed onto a 22 cm × 100 μm i.d. C18 reverse-phase pulled tip analytical column with a 25 min linear 5-50% acetonitrile gradient in 0.1% formic acid at 500 nl/min using an Eksigent nanopump (Eksigent Technologies). The column was washed with 90% acetonitrile-0.1% formic acid for 15 min and then re-equilibrated with 5% acetonitrile-0.1% formic acid for 24 min. The eluted peptides were passed directly from the tip into a modified MicroIonSpray interface of an Applied Biosystems-MDS-Sciex (Concorde, Ontario, Canada) 4000 Qtrap mass spectrometer. The interface was modified in order to apply the electrospray voltage through a liquid-liquid junction at the top of the column rather than at the end of the column. This arrangement resulted in very high chromatographic resolution by elimination of the post-column dead volume. The IonSpray voltage was 2500 V and the declustering potential was 60 V. Ionspray and curtain gases were set at 12 psi and 5 psi, respectively. The interface heater temperature was 160°C. Eluted peptides were subjected to a survey MS scan to determine the top three most intense ions. A second scan (the enhanced resolution scan) determined the charge state of the selected ions. Finally, enhanced product ion scans were carried out to obtain the tandem mass spectrum of the selected parent ions (with the declustering potential raised to 100 V) over the range from m/z 400-1500. Spectra were centroided and de-isotoped by Analyst Software, version 1.43 (Applied Biosystems). These LC-MS/MS data were processed to provide protein identifications using an in-house MASCOT search engine (Matrix Science) against all mammalian species using MASCOT with a fixed modification of carbamidomethylation on cysteine residues and a variable modification of oxidation of methionine residues. One missed cleavage site for trypsin was allowed.
Results and Discussion
Modeling A-RMS tumor phenotype
The multipotential mesodermal cell line C3H10T1/2 was transduced with P3F + LT, LT alone, P3F alone, and empty vector control.12 The co-expression of P3F and LT led to a transformed malignant phenotype not evident in cells transduced with P3F, LT, or empty vector. P3F + LT transduced cells readily formed colony foci in vitro and demonstrated the capability of anchorage-independent growth in soft agar (Figure 1). Cells expressing P3F + LT readily formed allograft tumors in vivo with average tumor volumes of 2.1 cm3 +/- 0.23 cm3 30 days after subcutaneous injection in immunodeficient Nod-Scid mice. The other transductants did not form perceptible tumors within 30 days of observation. To confirm that our cell culture model replicates the molecular phenotype of A-RMS tumors, RNA expression of known P3F targets c-Met and Cxcr4 was measured and found to be upregulated by P3F expressed alone and in combination with LT (Figure 2).13, 14 By measuring the RNA expression of myogenic factors Myod, Myog, and desmin, the induction of a myogenic phenotype characteristic of RMS tumors but not otherwise expressed in native C3H10T1/2 cells was demonstrated (Figure 2).
Figure 1.
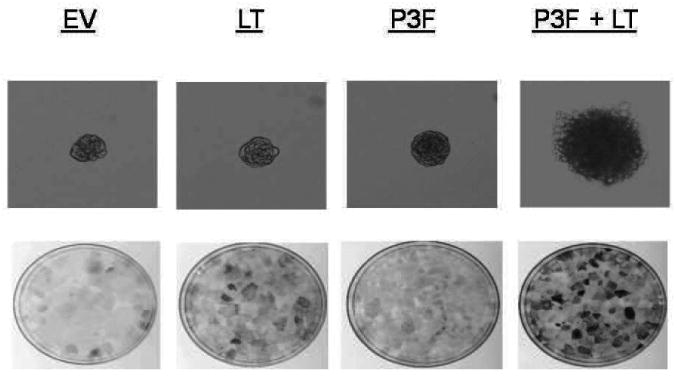
The malignant transformation of cells transduced with P3F + LT. The malignant properties of each transductant were assayed by anchorage-independent growth and colony focus formation. Anchorage-independent colony formation in soft-agar demonstrating the ability of cells to proliferate without attachment to a solid substratum was viewed by 10× microscopy. The combination of P3F + LT produced dramatically more (n = 30 +/- 6) soft-agar colonies than the expression of P3F alone (n=4 +/- 2), LT alone (n=8 +/- 3.6), or EV (0) as evidenced by the number of foci larger than 500 μM (upper row). The colonies shown are typical of the largest colonies detected in each cell type. The combined expression of P3F and LT produced more numerous and prominent foci than P3F or LT alone or empty vector control (EV) as evidenced in the 10cm plates pictured (lower row). Each assay was run in triplicate.
Figure 2.
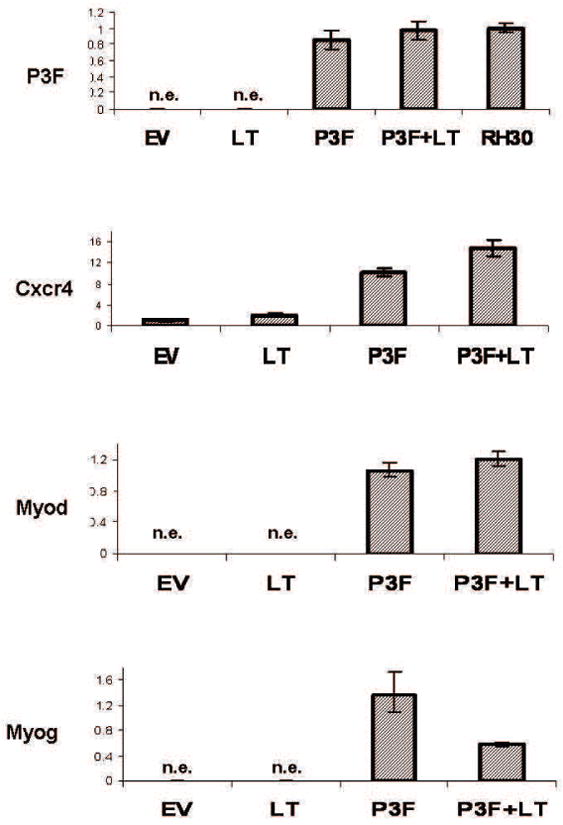
Expression of P3F and target genes characteristic of A-RMS tumors. The mRNA levels of P3F, Cxcr4, Myod, and Myog were measured by qRT-PCR and calculated by the ΔΔCt methodology as described in Methods. mRNA derived from the A-RMS cell line RH30 was used as the calibrator sample for the P3F assay, and mRNA from C2C12 myoblasts served as the calibrator for the Cxcr4, Myog, and Myod expression studies. The assays were run in triplicate and the standard deviation determined. Cells transduced with P3F showed upregulated mRNA for the target gene Cxcr4. The up-regulation of skeletal muscle factors Myod and Myog demonstrates a robust skeletal muscle phenotype in P3F expressing cells. ‘n.e.’ indicates no expression was detected as evidenced by the lack of reporter fluorescense adequate to cross a minimum threshold within 35 PCR cycles.
2D-DIGE and mass spectrometry identification of differentially expressed proteins
Whole cell lysates of proliferating cells stably transduced with P3F + LT or LT alone were analyzed by 2D-DIGE. Six gels were loaded with paired samples of P3F + LT and LT proteins. To minimize dye bias, half of the gels had P3F + LT samples labeled with Cy3 while the other half had P3F + LT samples labeled with Cy5. DeCyder image analysis detected an average of 1753 spots per gel. Of these, 1335 spots were matched across all 6 gels, and these were further analyzed for differences in intensity (or peak volume). Ninety-three of these spots were found to be statistically different (p<0.05) in volume; these included 84 spots that were increased and 9 spots that were decreased in P3F + LT-transduced cells compared with cells transduced with LT alone (Figure 3). All protein spots determined to be significantly different in abundance were processed for MALDI-TOF MS or LC-MS/MS analysis, generating putative protein identities of 56 spots. Ultimately, 37 non-redundant proteins that differed in abundance were identified by MS (Table 1). The proteins with the highest fold differences in abundance were tubulin, alpha 1C (increased 2.66 fold, spot #722) and Hspd1 (increased 2.13 fold, spot #671).
Figure 3.
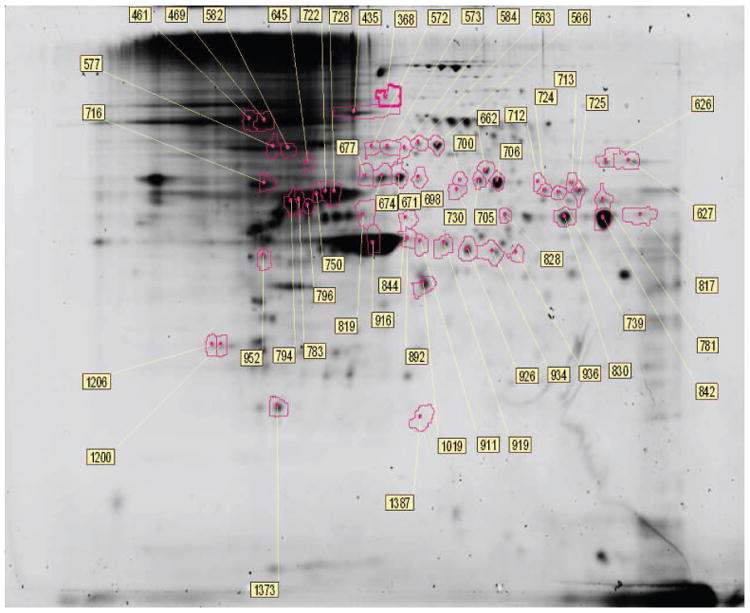
2D-DIGE of cell lysates indicating proteomic differences induced by transformation of C3H10T1/2 cells to the malignant phenotype. Proteins different in abundance and identified by MS analysis (circled) in cell lysates are shown in the 2D gel image. The master spot number assigned to each gel spot within DeCyder indicated in the figure is the same master spot number referenced in Table 1.
Table I.
Fold change, significance, and peptide mass fingerprint analysis of proteins that were significantly different between whole cell lysates of P3F + LT versus LT alone transduced cells.
| Master spot |
Protein identification | fold Change P3F+LT/LT |
t-test (p value) |
MW pred (Da) |
PI pred (Da) |
SWISSPROT Number |
Accession no | Functional category | MOWSE score |
Peptides Matched |
% coverage |
|---|---|---|---|---|---|---|---|---|---|---|---|
| 368 | ubiquitin-activating enzyme E1 | 1.5 | 0.01623 | 118931 | 5.43 | UBA1_MOUSE | gi∣6678483 | Protein deqradation | 99 | 9/12 | 13 |
| 435 | valosin-containing protein | 1.63 | 0.001286 | 89936 | 5.14 | TERA_MOUSE | gi∣55217 | Multifunction | 122 | 16/42 | 29 |
| 461 | heat shock protein 1, beta | 1.5 | 0.004128 | 83571 | 4.97 | HS90B_MOUSE | gi∣40556608 | Chaperone | 73 | 6/8 | 10 |
| 469 | heat shock protein 1, beta | 1.49 | 0.005726 | 83571 | 4.97 | HS90B_MOUSE | gi∣40556608 | Chaperone | 106 | 10/15 | 16 |
| 563 | Stress-70 protein, mitochondrial | 1.56 | 0.04029 | 73970 | 5.87 | GRP75_MOUSE | gi∣3122170 | Chaperone | 119 | 11/17 | 19 |
| 566 | Stress-70 protein, mitochondrial | 1.62 | 0.0285 | 73970 | 5.87 | GRP75_MOUSE | gi∣3122170 | Chaperone | 264 | 24/36 | 45 |
| 572 | unnamed protein product | 1.75 | 0.01149 | 50547 | 6.17 | C | gi∣74142813 | n/a | 86 | 7/13 | 24 |
| 573 | Chain A, Crystal Structure Of The 70-Kda Heat Shock Cognate Protein | 1.67 | 0.006719 | 59895 | 5.91 | HSP7C_MOUSE | gi∣178847300 | Chaperone | 96 | 8/12 | 18 |
| 577 | Chain A, Crystal Structure Of The 70-Kda Heat Shock Cognate Protein | 1.62 | 0.00343 | 59895 | 5.91 | HSP7C_MOUSE | gi∣178847300 | Chaperone | 105 | 9/15 | 23 |
| 582 | unnamed protein product | 1.64 | 0.002675 | 71041 | 5.28 | C | gi∣74143862 | n/a | 116 | 15/42 | 31 |
| 584 | Chain A, Chaperone Complex | 1.48 | 0.02465 | 42431 | 6.69 | C | gi∣215261181 | Chaperone | 119 | 9/15 | 29 |
| 626 | lamin A isoform C | 1.52 | 0.002852 | 65464 | 6.37 | LMNA_MOUSE | gi∣161760667 | Structural | 171 | 15/18 | 25 |
| 627 | lamin A isoform C | 1.45 | 0.0146 | 65464 | 6.37 | LMNA_MOUSE | gi∣161760667 | Structural | 77 | 7/9 | 13 |
| 645 | alpha isoform of regulatory subunit A, protein phosphatase 2 | 1.46 | 0.03816 | 66079 | 5 | 2AAA_MOUSE | gi∣8394027 | Multifunction | 99 | 11/28 | 21 |
| 662 | chaperonin containing TCP1, subunit 5 | 1.83 | 0.006208 | 59955 | 5.51 | TCPE_MOUSE | gi∣51890219 | Chaperone | 88 | 9/14 | 17 |
| 671 | Hspd1 protein | 2.13 | 0.004527 | 59559 | 8.09 | CH60_MOUSE | gi∣76779273 | Chaperone | 187 | 19/38 | 43 |
| 674 | Hspd1 protein | 1.67 | 0.00876 | 59559 | 8.09 | CH60_MOUSE | gi∣76779273 | Chaperone | 93 | 8/13 | 20 |
| 677 | UDP-N-acteylglucosamine pyrophosphorylase 1 -like 1 | 1.42 | 0.04014 | 57319 | 5.27 | UAP1L_MOUSE | gi∣84794548 | Metabolism | 92 | 9/20 | 16 |
| 698 | Hspd1 protein | 1.46 | 0.04076 | 59559 | 8.09 | CH60_MOUSE | gi∣76779273 | Chaperone | 77 | 6/8 | 15 |
| 700 | protein disulfide-isomerase A3 | 1.35 | 0.04813 | 57010 | 5.88 | PDIA3_MOUSE | gi∣8393322 | Protein foldinq | 87 | 7/11 | 17 |
| 705 | protein disulfide-isomerase A3 | 1.38 | 0.01663 | 57099 | 5.88 | PDIA3_MOUSE | gi∣112293264 | Protein foldinq | 109 | 9/13 | 20 |
| 706 | protein disulfide-isomerase A3 | 1.46 | 0.006991 | 57099 | 5.88 | PDIA3_MOUSE | gi∣112293264 | Protein foldinq | 162 | 15/27 | 33 |
| 712 | glucose-6-phosphate dehydrogenase | 1.36 | 0.003243 | 55307 | 6.19 | G6PD1_MOUSE | gi∣204197 | Metabolism | 160 | 11/12 | 23 |
| 713 | phosphoglycerate dehydrogenase | 1.31 | 0.04647 | 57347 | 6.12 | SERA_MOUSE | gi∣52353955 | Metabolism | 106 | 9/16 | 21 |
| 716 | prolyl 4-hydroxylase, beta polypeptide | 1.8 | 0.02633 | 57422 | 4.77 | C | gi∣42415475 | Protein metabolism | 139 | 12/21 | 21 |
| 722 | tubulin, alpha 1C | 2.66 | 0.0001028 | 50562 | 4.96 | TBA1C_MOUSE | gi∣6678469 | Cytoskeleton | 75 | 7/20 | 26 |
| 724 | CCT (chaperonin containing TCP-1) beta subunit | 1.82 | 0.0007352 | 57753 | 5.97 | TCPB_MOUSE | gi∣468546 | Chaperone | 91 | 6/7 | 18 |
| 725 | phosphoglycerate dehydrogenase | 1.88 | 0.001356 | 57347 | 6.12 | SERA_MOUSE | gi∣52353955 | Metabolism | 112 | 9/14 | 18 |
| 728 | vimentin | 1.91 | 0.0007208 | 53712 | 5.06 | VIME_MOUSE | gi∣31982755 | Cytoskeleton | 288 | 29/59 | 70 |
| 730 | vacuolar adenosine triphosphatase subunit B | 1.31 | 0.01532 | 56948 | 5.57 | VATB2_MOUSE | gi∣1184661 | Metabolism | 86 | 6/7 | 13 |
| 739 | chaperonin subunit 2 (beta) | 1.69 | 0.007102 | 57783 | 5.97 | TCPB_MOUSE | gi∣126521835 | Chaperone | 148 | 11/15 | 32 |
| 750 | vimentin, isoform CRA_a | 1.5 | 0.005775 | 46505 | 5.16 | VIME_MOUSE | gi∣148676106 | Cytoskeleton | 87 | 8/17 | 25 |
| 781 | aldehyde dehydrogenase 2, mitochondrial, isoform CRA_a | 1.43 | 0.003727 | 55196 | 8.32 | ALDH2_MOUSE | gi∣148687772 | Metabolism | 83 | 6/8 | 13 |
| 783 | tubulin, beta 5 | 1.38 | 0.0102 | 50095 | 4.78 | TBB5_MOUSE | gi∣7106439 | Cytoskeleton | 113 | 11/27 | 22 |
| 794 | tubulin, beta 5 | 1.34 | 0.01476 | 50095 | 4.78 | TBB5_MOUSE | gi∣7106439 | Cytoskeleton | 136 | 12/24 | 22 |
| 796 | vimentin | 1.9 | 0.003707 | 51590 | 4.96 | VIME_MOUSE | gi∣2078001 | Cytoskeleton | 200 | 20/43 | 54 |
| 817 | enolase 1, (alpha) | 1.7 | 0.002937 | 47440 | 6.16 | ENOA_MOUSE | gi∣158186649 | Glycolysis, invasion | 97 | 8/15 | 25 |
| 819 | Hnrpf protein | 1.37 | 0.01059 | 37406 | 5.69 | HNRPF_MOUSE | gi∣20987708 | RNA metabolism and transport | 81 | 6/11 | 23 |
| 828 | enolase 1, (alpha) | 1.4 | 0.005684 | 47098 | 6.16 | ENOA_MOUSE | gi∣158186649 | Glycolysis, invasion | 87 | 6/8 | 20 |
| 830 | hypothetical protein LOC433182 | 1.56 | 0.01048 | 47111 | 6.37 | C | gi∣70794816 | n/a | 107 | 10/21 | 31 |
| 842 | hypothetical protein LOC433182 | 1.59 | 0.007326 | 47111 | 6.37 | C | gi∣70794816 | n/a | 112 | 14/35 | 37 |
| 844 | Cytochrome b-c1 complex subunit 1, mitochondrial | 1.59 | 0.01051 | 52735 | 5.75 | QCR1_MOUSE | gi∣14548301 | Metabolism | 104 | 10/20 | 23 |
| 892 | Hnrpf protein | 1.22 | 0.01438 | 37178 | 5.69 | HNRPF_MOUSE | gi∣20987708 | RNA metabolism and transport | 97 | 6/9 | 25 |
| 911 | serine (or cysteine) proteinase inhibitor, clade B, member 6a | 1.45 | 0.004002 | 42571 | 5.53 | SPB6_MOUSE | gi∣6678097 | proteinase inhibitor | 85 | 9/21 | 30 |
| 916 | gamma-actin | 1.28 | 0.03992 | 40992 | 5.56 | ACTB_MOUSE | gi∣809561 | Cytoskeleton | 149 | 13/25 | 40 |
| 919 | serine (or cysteine) proteinase inhibitor, clade B, member 6a | 1.42 | 0.0009771 | 42571 | 5.53 | C | gi∣148703873 | n/a | 92 | 6/11 | 23 |
| 926 | put. beta-actin | .658 | 0.01953 | 39161 | 5.78 | ATP5H_MOUSE | gi∣159572410 | Metabolism | 97 | 6/13 | 48 |
| 934 | put. beta-actin | .581 | 0.003474 | 39161 | 5.78 | ACTB_MOUSE | gi∣49868 | Cytoskeleton | 81 | 5/7 | 14 |
| 936 | serine (or cysteine) proteinase inhibitor, clade B, member 1a | 1.52 | 0.005536 | 42548 | 5.85 | C | gi∣114158675 | proteinase inhibitor | 79 | 5/6 | 16 |
| 952 | laminin receptor | 1.16 | 0.0427 | 32698 | 4.74 | C | gi∣293694 | Cell adhesion | 101 | 7/14 | 24 |
| 1019 | annexin A3 | 1.18 | 0.04343 | 36362 | 5.5 | ANXA3_MOUSE | gi∣160707925 | Multifunction | 128 | 8/10 | 26 |
| 1200 | tropomyosin 3, gamma isoform 1 | 1.23 | 0.04614 | 28692 | 4.79 | TPM3_MOUSE | gi∣52353308 | Muscle/Contrac tility | 109 | 8/15 | 31 |
| 1206 | tropomyosin 3, gamma isoform 2 | 1.42 | 0.007835 | 29017 | 4.75 | TPM3_RAT | gi∣29336093 | Muscle/Contrac tility | 78 | 6/12 | 22 |
| 1373 | mCG10592, isoform CRA_c | 1.33 | 0.01232 | 16524 | 5.23 | C | gi∣148703873 | n/a | 92 | 6/11 | 23 |
| 1387 | ATP synthase, H+ transporting, mitochondrial F0 complex, subunit d | 1.33 | 0.002415 | 15872 | 5.16 | ATP5H_MOUSE | gi∣159572410 | Metabolism | 97 | 6/13 | 48 |
To document proteins that were secreted by or cleaved from P3F-transformed cells, media conditioned by cells transformed by P3F + LT was compared with media conditioned by cells transduced with LT alone. An average of 876 spots was detected on the 4 replicate gels. A total of 726 matching protein spots found among all gels were evaluated by DeCyder software. Because our primary objective was to identify proteins that might serve as biomarkers, only spots that were increased in abundance in the media conditioned by P3F + LT transduced cells versus in media conditioned by LT-transduced cells were analyzed by MS for identities. Thirty-nine such statistically significant protein spots (p<0.05) indicated by DeCyder analysis were analyzed by MALDI-TOF or LC-MS/MS. Twenty-nine proteins were identified, revealing 11 non-redundant proteins (Table 2). Spots #979 and #978, both identified as type I collagen alpha 1 chain; pro alpha 1, were determined by DeCyder image analysis to be the most increased in the P3F + LT conditioned media (increased 3.33 and 3.3 fold, respectively, Figure 4). One hundred and eleven gel spots with decreased abundance in the P3F + LT cells versus LT alone cells (p<0.05) were detected by DeCyder but not analyzed by MS.
Table 2.
Fold change, significance, and peptide mass fingerprint analysis of proteins that were significantly different between media conditioned by P3F + LT versus LT alone transduced cells.
| Master spot |
Protein identification | fold change P3F+LT/LT |
t-test (p value) |
MWpred (Da) |
Pi pred (Da) |
SWISSPROT Number |
accession no. | Functional category | MOWSE score |
Peptides Matched |
% coverage |
|---|---|---|---|---|---|---|---|---|---|---|---|
| 156 | procollagen, type I, alpha 1 | 2.11 | 0.0014 | 138974 | 5.65 | CO1A1_MOUSE | gi∣34328108 | ECM | 148 | 16/24 | 21 |
| 162 | procollagen, type I, alpha 1 | 1.77 | 0.0081 | 138974 | 5.65 | CO1A1_MOUSE | gi∣34328108 | ECM | 131 | 14/21 | 19 |
| 175 | procollagen, type I, alpha 1 | 1.94 | 0.0095 | 138974 | 5.65 | CO1A1_MOUSE | gi∣34328108 | ECM | 170 | 18/26 | 24 |
| 176 | procollagen, type I, alpha 1 | 1.98 | 0.01 | 138974 | 5.65 | CO1A1_MOUSE | gi∣34328108 | ECM | 127 | 17/36 | 23 |
| 177 | procollagen, type I, alpha 1 | 2.04 | 0.01 | 138974 | 5.65 | CO1A1_MOUSE | gi∣34328108 | ECM | 138 | 16/27 | 21 |
| 252 | Vinculin | 1.76 | 0.00057 | 117303 | 5.72 | VINC_MOUSE | gi∣309533 | Cytoskeleton | 156 | 14/17 | 19 |
| 255 | Vinculin | 1.8 | 0.0016 | 117303 | 5.72 | VINC_MOUSE | gi∣309533 | Cytoskeleton | 188 | 19/26 | 22 |
| 256 | Vinculin | 1.72 | 0.00045 | 117303 | 5.72 | VINC_MOUSE | gi∣309533 | Cytoskeleton | 194 | 18/22 | 22 |
| 260 | Vinculin | 1.8 | 0.00054 | 117303 | 5.72 | VINC_MOUSE | gi∣309533 | Cytoskeleton | 181 | 18/24 | 22 |
| 261 | Vinculin | 1.78 | 0.00017 | 117303 | 5.72 | VINC_MOUSE | gi∣309533 | Cytoskeleton | 197 | 21/31 | 27 |
| 585* | nucleobindin 1, isoform CRA_a | 1.2 | 0.0034 | 53474 | 5.02 | NUCB1_MOUSE | gi∣148690913 | Ca2+ homeostasis | 372 | 6/6 | 14 |
| 634 | protein disulfide isomerase associated 3 | 1.26 | 0.0014 | 57099 | 5.88 | PDIA3_MOUSE | gi∣112293264 | Protein folding | 173 | 17/34 | 30 |
| 635 | protein disulfide isomerase associated 3 | 1.25 | 0.00058 | 57099 | 5.88 | PDIA3_MOUSE | gi∣112293264 | Protein folding | 124 | 11/19 | 23 |
| 636 | protein disulfide isomerase associated 3 | 1.32 | 0.0023 | 57099 | 5.88 | PDIA3_MOUSE | gi∣112293264 | Protein folding | 170 | 14/20 | 29 |
| 844 | put. beta-actin | 1.31 | 0.0071 | 39446 | 5.78 | ACTB_BOVIN | gi∣49868 | Cytoskeleton | 98 | 7/11 | 25 |
| 853 | put. beta-actin | 2.08 | 0.000017 | 39446 | 5.78 | ACTB_BOVIN | gi∣49868 | Cytoskeleton | 75 | 5/7 | 20 |
| 854 | serine (or cysteine) proteinase inhibitor, clade B, member 1a | 1.92 | 0.000024 | 42719 | 5.85 | C | gi∣114158675 | Proteinase inhibitor | 100 | 7/9 | 22 |
| 917 | rCG23545, isoform CRA_c | 1.63 | 0.0027 | 48392 | 9.76 | C | gi∣123298587 | n/a | 71 | 6/13 | 21 |
| 920 | myotubularin related protein 11, isoform CRA_c | 1.89 | 0.0025 | 27096 | 9.45 | MTMRB_HUMAN | gi∣119573975 | Phosphatase | 61 | 4/8 | 27 |
| 978* | type I collagen alpha 1 chain; pro alpha 1 | 3.3 | 0.000007 | 35315 | 5.24 | CO1A1_MOUSE | gi∣455975 | ECM | 334 | 7/7 | 15 |
| 979* | type I collagen alpha 1 chain; pro alpha 1 | 3.33 | 0.000021 | 35315 | 5.24 | CO1A1_MOUSE | gi∣455975 | ECM | 469 | 9/9 | 17 |
| 981* | type I collagen alpha 1 chain; pro alpha 1 | 2.59 | 0.000076 | 35315 | 5.24 | CO1A1_MOUSE | gi∣455975 | ECM | 421 | 9/9 | 21 |
| 994* | Collagen alpha-1(lll) chain | 2.33 | 0.00028 | 140112 | 6.11 | CO3A1_MOUSE | gi∣5921190 | ECM | 315 | 9/9 | 4 |
| 995* | Collagen alpha-1(lll) chain | 2.23 | 0.00031 | 140112 | 6.11 | CO3A1 MOUSE | gi∣5921190 | ECM | 392 | 10/10 | 5 |
| 1007 | Col1a2 protein | 2.52 | 0.000015 | 57027 | 7.07 | CO1A2_MOUSE | gi∣15214623 | ECM | 73 | 8/23 | 21 |
| 1008 | Col1a2 protein | 2.45 | 0.0000054 | 57027 | 7.07 | CO1A2_MOUSE | gi∣15214623 | ECM | 102 | 9/17 | 21 |
| 1009 | Col1a2 protein | 2.32 | 0.000023 | 57027 | 7.07 | CO1A2_MOUSE | gi∣15214623 | ECM | 94 | 9/20 | 21 |
| 1080* | proteasome (prosome, macropain) subunit, alpha type 6 | 1.19 | 0.01 | 28353 | 6.99 | PSA6_MOUSE | gi∣148704781 | Protein degradation | 286 | 7/7 | 32 |
| 1234 | expressed in non-metastatic cells 1 protein | 1.11 | 0.00026 | 14140 | 9.13 | C | gi∣56800495 | Nucleotide metabolism | 87 | 5/8 | 44 |
List of proteins found in different abundance. The master spot number is the designation given to the protein spot within DeCyder image analysis software. The fold-change was calculated by DeCyder for each pair of volumes at a given spot, across all 6 (whole cell lysates) or 4 (conditioned media) gels, where the volume in the P3F + LT was divided by that of the corresponding LT. Spot volumes that showed statistical significance (p<0.05) were processed for further analysis. Protein function was identified by searching the PubMed database.
No corresponding record was available in the Swiss Protein Database for the mouse version of this protein.
Proteins identified by qTRAP.
Figure 4.
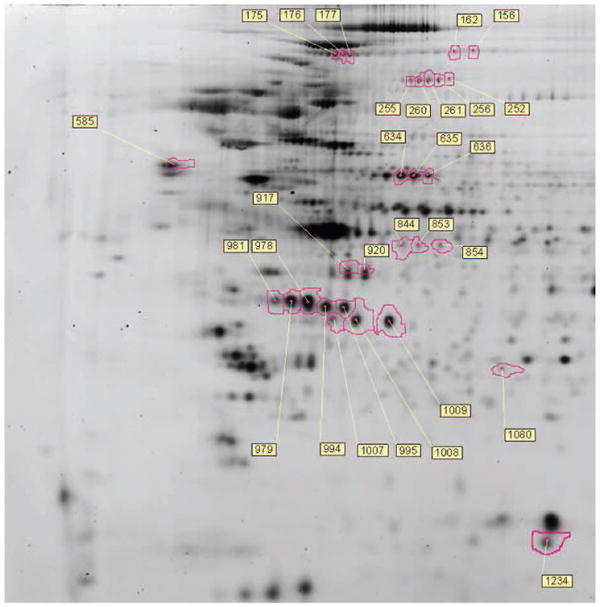
2D-DIGE gel of conditioned media. The 2D gel image is of conditioned media samples from LT vs P3 + LT-transformed cells, where the numbered spots were determined to be different in abundance and identified by MS.
For the MALDI-TOF MS identifications, the MOWSE scores ranged from 61 to 288. Scores of 80 and above on the mass spectrometry fingerprinting technique were considered significant with p <0.05. Known human keratin contamination peaks were filtered from the spectra before submitting to the MASCOT database. In the majority of the MALDI-TOF MS-derived spectra (58 of 77), at least 50% of the detected peptides matched the identified protein, with sequence coverage ranging from 10 to 70%. The LC-MS/MS derived MOWSE scores ranged from 286 to 469. Proteins sequenced with at least one individual peptide score of 40 or greater determined by the MASCOT in-house database and de novo sequence verified were considered significant for tandem MS analyses.
Clinically relevant biomarkers and therapeutic targets
A number of proteins identified in our study could potentially serve as tumor biomarkers. Valosin-containing protein was found to be 1.63 fold increased in P3F + LT-transduced cells relative to cells transduced with LT alone (Figures 3 and 5, spot #435). Valosin-containing protein (p97) is an ATPase that performs a variety of cellular functions including endoplasmic reticulum-associated protein degradation (ERAD), disassembly of the mitotic spindle, and regulation of cell cycle and transcription.15 Increased valosin-containing protein has been correlated with poor clinical prognosis in numerous tumor types including carcinoma of the colon and liver.16, 17 Increased abundance of valosin-containing protein in P3F + LT cells was confirmed by western blotting (Figure 6). IHC analysis of 3 A-RMS specimens demonstrated a spectrum of valosin-containing protein staining (Figure 7).
Figure 5.
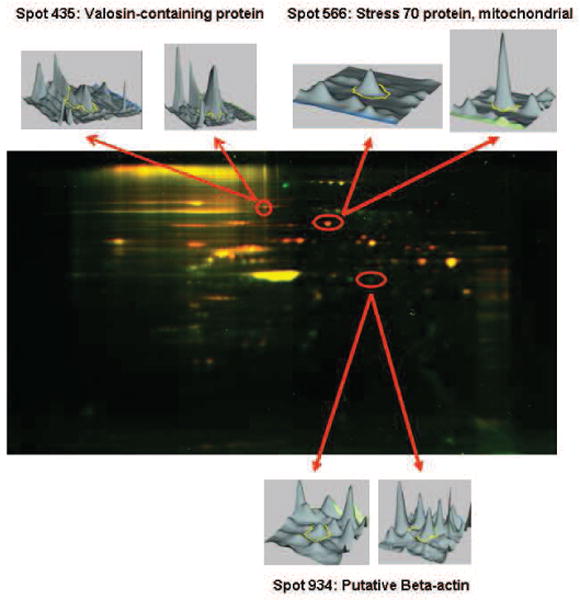
Three-dimensional correlates of key proteins determined to be different in abundance between LT vs P3F + LT-transduced cells. The 3-dimensional images indicated by the arrows were generated within DeCyder image analysis software. For each 2D gel spot, a pair of peaks was detected; the circled peaks correspond to the spot detected in 2D gels of LT-transduced cells (left) or to the same spot detected at the same position in 2D gels of P3F + LT-transformed cells (right).
Figure 6.
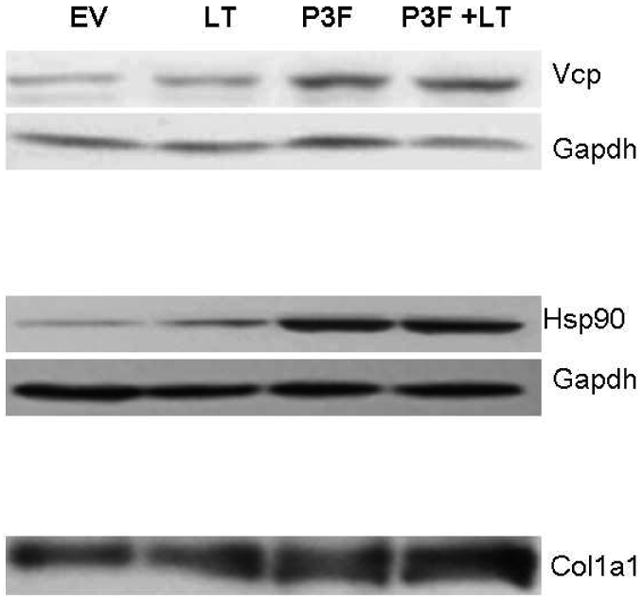
Western blot confirmation of proteomic results from 2D DIGE analysis. Western blots of Valosin containing protein (Vcp) and heat shock protein 90 (Hsp90) from whole cell lysates and Collagen 1a1 (Col1a1) from conditioned media. Whole cell lysates were incubated with primary rabbit anti-mouse antibodies at the following dilutions: Vcp 1:5000 and Hsp90 1:5000. Each blot was re-probed for glyceraldehyde-3-phosphate dehydrogenase (Gapdh) protein expression using rabbit anti-mouse HRP conjugated antibody at a 1:5000 dilution to confirm equal protein loading and transfer. Equivalent amounts of protein from conditioned media were probed for Col1a1 using an antibody diluted at 1:10000. All antibodies were obtained from Santa Cruz Biotechnology.
Figure 7.
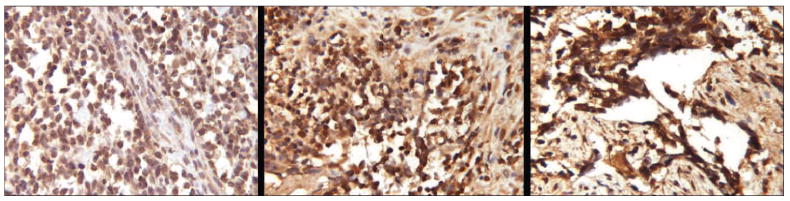
Valosin-containing protein expression in human A-RMS tumors. Immunohistochemistry (IHC) stains of valosin-containing protein (VCP) were performed in a set of formalin-fixed paraffin embedded (FFPE) tumors collected from A-RMS patients. Based on nuclear staining intensity, VCP expression was graded subjectively as 1+ to 4+. A spectrum of expression was detected: a localized pelvic tumor derived from a 5 year-old male demonstrated 2+ expression (left), a localized pelvic A-RMS tumor from a 5 year-old female demonstrated 3 to 4+ expression (center), a nasopharangeal A-RMS tumor with intracranial extension from a 9 year-old female demonstrated 4+ expression (right) (132× magnification).
Annexin A3 (ANXA3) (spot #1019) was increased 1.18 fold in P3F + LT cells. Annexin A3 is a member of the calcium-dependent phospholipid-binding protein family that functions in the regulation of cellular growth, signal transduction pathways, and angiogenesis.18, 19 When compared to benign prostate tissue, the annexin A3 gene has been found to be more highly expressed in prostate cancer20 and has been correlated with lymph node metastasis in lung adenocarcinoma patients.21 IHC of prostate cancer tissue 22 and analysis of patient urine samples 23 have further demonstrated that annexin A3 protein is a potentially valuable tumor marker in prostate cancer.
Heterogeneous nuclear ribonucleoprotein F (Hnrpf or hnRNP-F), a component of the splicing-related Hnrpf complex, aids in shuttling mRNA transcripts from the active site of transcription to that of translation, was found to be increased abundance in P3F + LT cells at 2 different spots (increased 1.22 fold, spot #892, and 1.37 fold, spot #819). Hnrpf has been demonstrated to be upregulated in colon carcinoma.24 There is evidence that anti-cancer differentiating agents can decrease the expression of Hnrpf in malignant leukemia cell lines, further implicating a role for Hnrpf in tumorigenesis. Hnrpf is downregulated in acute myelogenous leukemia (AML) after treatment with therapeutic all-trans retinoic acid (ATRA) and in the T-cell acute lymphoblastic leukemia (ALL) cell line MOLT-4 after treatment with the histone deacetylase (HDAC) inhibitor valproic acid.25, 26
Abundant expression of various chaperone proteins including heat shock protein 1 beta (Hsp1 beta or Hsp90ab1) was detected in P3F + LT transduced cells. Hsp1 beta was increased in abundance 1.49 and 1.5, respectively, in two different spots in P3F + LT cells (spots #461 and #469). Hsp 1 beta (Hsp90ab1) is an ATP-dependent molecular chaperone that stabilizes and facilitates the function of various client proteins, including many cancer- promoting molecules including numerous transcription factors.27 This latter finding leads us to speculate that P3F may be a potential client protein of Hsp1 beta. Western blotting reveals increased abundance of Hsp90ab1 in the transformed P3F + LT and the non-transformed P3F cells compared to empty vector controls, providing further evidence that Hsp1 beta may be specifically involved in chaperoning P3F (Figure 6).
Myogenic proteins upregulated by P3F expression
E-RMS and A-RMS tumors are distinguished from other sarcomas by the finding of skeletal muscle differentiation. The ectopic expression of P3F has been previously demonstrated to induce various myogenic regulatory factors which may contribute to the striated muscle phenotype evident in P3F A-RMS tumors.28 In order to measure the myogenic effects of P3F, A-RMS tumors were modeled in non-myogenic C3H10T1/2 cells. 2D-DIGE and MS analysis revealed the increased abundance of several muscle-related proteins in our cell culture tumor model including gamma-actin (spot #916), tropomyosin 3, gamma isoform 1 (spot #1200) and gamma isoform 2 (spot #1206), and enolase 1 alpha (spots #817 and #828). Skeletal muscle specific tropomyosin has been identified as a marker of myogenic differentiation in chick studies 29, and the exposure of human RMS cell lines to the differentiating agent dimethyl sulfoxide leads to the upregulation of tropomyosin.30 A potential role for enolase 1 alpha in myogenic differentiation is highlighted by the finding of enolase 1 alpha induction during C2C12 myoblast differentiation in vitro and in regenerating murine skeletal muscle in vivo.31
Analysis of conditioned media
The analysis of conditioned media may shed light on the mechanism by which A-RMS cells interact with or contribute to the extracellular matrix (ECM), invade local tissues, and metastasize. Numerous type-I procollagen, collagen 1a1 (Col1a1), and collagen 1a2 (Col1a2) protein spots were identified in the conditioned media of P3F + LT expressing cells (Figure 4).
The increased abundance of type I collagen in the secretome of P3F + LT cells suggested increased collagenase activity (Figure 6). As mentioned above, an increase in the expression of enolase 1 alpha was also detected in the P3F + LT whole cell lysates. In addition to its role in glycolysis, enolase 1 alpha is expressed on the cell surface where it serves as a plasminogen receptor, facilitating the conversion of plasminogen to plasmin and subsequent fibrinolysis and activation of procollagenases.32 A previous study of pediatric tumors detected enolase expression at the protein level in RMS and other solid tumors of childhood.33 We speculate that enolase 1 alpha may also play a role in the liberation of collagen detected in the P3F + LT secretome. Alternatively, P3F expressing cells could potentially synthesize and secrete collagen in an attempt to generate a microenvironment that is conducive to tumor growth.
Other differentially expressed proteins detected in the conditioned media may provide insight into the mechanisms by which RMS cells interact or contribute to the ECM. Vinculin is a component and regulator of focal adhesions molecules that form cell-cell and cell-ECM linkages.34 Vinculin expression has been previously documented in RMS tumors,35 and studies of human skeletal myoblasts demonstrate that vinculin proteins migrate from the perinuclear region to the cell membrane during the course of myogenic differentiation.36 However, vinculin is recognized as an intracellular protein, and is not expected to be detected extracellularly. The presence of vinculin in the media could be a result of cell death or stress resulting from serum starvation. Observation of cell culture during the 48 hour media conditioning did not reveal evidence of increased cell death, however.
Comparison to previous RMS expression studies
There has been considerable interest in using wide-scale expression profiling methodology to study RMS biology. One previous proteomics-based study surveyed microdissected human RMS tumor cells by protein microarrays. A major conclusion from the study was that RMS tumors derived from patients with poor clinical outcomes were associated with increased phosphorylation of various members of the AKT/mTOR pathway.37 Other RMS studies have utilized microarray methodology to study the expression of mRNA transcripts in cell culture models and human tumors. Kahn et al. documented the downstream mRNA effects of P3F expression in murine NIH3T3 fibroblasts. The authors detected a variety of P3F target genes, many with myogenic properties.38 There was no specific overlap between the P3F targets identified in the Khan et al. study and the present study. This discrepancy could be explained in part by the use of different murine fibroblast cell lines. Another distinction is that the present study expressed P3F in tandem with the multifunctional LT, resulting in a transformed malignant phenotype.
Davicioni et al. utilized microarray methodology to compare the expression signatures of P3F positive and negative A-RMS tumors with a cell culture model of A-RMS.39 The study found that the expression profile of the E-RMS cell line RD transduced with P3F overlapped with that found in P3F-expressing A-RMS tumors. Unlike the findings of the study by Khan et al., many myogenic factors were actually down-regulated in RD cells after the introduction of P3F. The authors also noted that the expression of P3F needed to exceed a certain threshold before the in vitro approach modeled the expression profile of A-RMS tumors. In the present study the degree of P3F expression was sufficient to elicit a robust transformed phenotype when expressed in cooperation with LT. However, we did not analyze the effect of particularly low P3F expression on target protein expression or malignant transformation. More recently Davicioni et al. reported microarray data from a total of 160 RMS tumors derived from patients enrolled in Children's Oncology Group studies.5 An important finding was that P3F negative A-RMS tumors were indistinguishable from E-RMS tumors when analyzed by gene expression and LOH patterns, further highlighting the importance of P3F in A-RMS biology.
Other microarray studies have been undertaken on a smaller scale. Many differentially expressed genes have been found to be common to 2 or more of the microarray based studies published thus far.40, 41 ENO3 was upregulated in A-RMS tumors in a study by Lae et al. In the present study enolase 1 alpha was upregulated in P3F + LT expressing cells.41 Otherwise, the proteins upregulated in our study did not overlap with mRNA transcripts detected in human RMS tumor studies. The RNA microarray studies have often sought genes that are differentially expressed between A-RMS and E-RMS subtypes. Using this approach, genes that are shared among different RMS subtypes, including many myogenic factors, may not be identified as differentially expressed.
Given the common lack of correlation between RNA and protein expression, applying proteomics approaches to the study of tumor biology and diagnosis will likely complement RNA-based methodologies. In some circumstances, protein findings may be better suited to the discovery of therapeutic targets and biomarkers. Unlike RNA molecules, aberrant proteins may be more easily targeted by novel therapies such as cytotoxic antibodies or small molecule inhibitors. Since proteins can often be measured by common clinical assays in tumors and other clinical specimens, proteins are frequently more clinically relevant diagnostic and prognostic biomarkers than other tumor molecules. A number of the proteins identified in our study may potentially function as RMS biomarkers. The identification of additional clinically relevant RMS tumor biomarkers is critically needed. A more extensive study will be necessary to further define any diagnostic or prognostic utility of proteins such as valosin-containing protein or annexin A3 in RMS tumors. To determine whether proteins found to be secreted in conditioned media may also be found in the blood proteome or other biofluids will require further study of human specimens.
Conclusions
Utilizing proteomics methodology to study a genetically defined cell culture model of P3F fusion positive A-RMS tumors, we have identified a set of proteins potentially crucial for A-RMS tumorigenesis. Many of the proteins fulfill roles in tumorigenesis and myogenesis. We find that the use of experimental models such as the one described is particularly useful to study relatively infrequent tumors like A-RMS. Even in a cooperative group setting it may be difficult to accumulate enough adequately processed tumor specimens to undertake a comprehensive MS analysis of A-RMS tumors. However, emerging technology and protein recovery methodology may allow widely-available FFPE specimens to be utilized.42 P3F induces a wide variety of cancer promoting proteins with functions involved in cell signaling, invasiveness, and myogenic differentiation. Proteomics methodology appears to be a feasible means of studying RMS tumors. Our work represents the first comprehensive proteomic study of cells transduced by the A-RMS tumor oncogene P3F. Despite advances in survival rates, the outcome for patients with A-RMS tumors is often poor. Hence, novel therapeutic approaches are critically needed for this population of patients. Further study of the proteins determined in this study to be different in abundance between transformed and non-transformed cells will provide additional insight into the underlying molecular biology of this aggressive childhood tumor. Proteomic analysis such as reported here of model systems may provide valuable preliminary information to support more extensive undertakings such as prospective proteomic analysis of fresh RMS specimens.
Acknowledgments
This work was supported by the Alabama Children's Hospital Foundation - Kaul Pediatric Research Institute (JGP, PI). The instrumentation for running, imaging, and processing 2D-gels was provided by a NCCR Shared Instrumentation grant (S10 RR16849, HK, PI). The mass spectrometers were purchased from funds provided by NCRR grants (S10 RR11329, RR 13795, RR 19231) to Stephen Barnes. Operation of the Targeted Metabolics and Proteomics Laboratory was partially supported by funds from a P30 Core grant (P30 CA13148-35, E. Partridge, PI) to the UAB Comprehensive Cancer Center. We wish to thank Debra Horton in the UAB Immunohistochemistry Laboratory for preparing the valosin-containing protein IHC stains of the RMS tumors.
References
- 1.Xia SJ, Pressey JG, Barr FG. Molecular pathogenesis of rhabdomyosarcoma. Cancer Biol Ther. 2002;1(2):97–104. doi: 10.4161/cbt.51. [DOI] [PubMed] [Google Scholar]
- 2.Arndt CA, Crist WM. Common musculoskeletal tumors of childhood and adolescence. N Engl J Med. 1999;341(5):342–52. doi: 10.1056/NEJM199907293410507. [DOI] [PubMed] [Google Scholar]
- 3.Bennicelli JL, Fredericks WJ, Wilson RB, Rauscher FJ, 3rd, Barr FG. Wild type PAX3 protein and the PAX3-FKHR fusion protein of alveolar rhabdomyosarcoma contain potent, structurally distinct transcriptional activation domains. Oncogene. 1995;11(1):119–30. [PubMed] [Google Scholar]
- 4.Parham DM, Qualman SJ, Teot L, Barr FG, Morotti R, Sorensen PH, Triche TJ, Meyer WH. Correlation between histology and PAX/FKHR fusion status in alveolar rhabdomyosarcoma: a report from the Children's Oncology Group. Am J Surg Pathol. 2007;31(6):895–901. doi: 10.1097/01.pas.0000213436.99492.51. [DOI] [PubMed] [Google Scholar]
- 5.Davicioni E, Anderson MJ, Finckenstein FG, Lynch JC, Qualman SJ, Shimada H, Schofield DE, Buckley JD, Meyer WH, Sorensen PH, Triche TJ. Molecular classification of rhabdomyosarcoma--genotypic and phenotypic determinants of diagnosis: a report from the Children's Oncology Group. Am J Pathol. 2009;174(2):550–64. doi: 10.2353/ajpath.2009.080631. [DOI] [PMC free article] [PubMed] [Google Scholar]
- 6.Williamson D, Missiaglia E, de Reynies A, Pierron G, Thuille B, Palenzuela G, Thway K, Orbach D, Lae M, Freneaux P, Pritchard-Jones K, Oberlin O, Shipley J, Delattre O. Fusion gene-negative alveolar rhabdomyosarcoma is clinically and molecularly indistinguishable from embryonal rhabdomyosarcoma. J Clin Oncol. 28(13):2151–8. doi: 10.1200/JCO.2009.26.3814. [DOI] [PubMed] [Google Scholar]
- 7.Anderson J, Ramsay A, Gould S, Pritchard-Jones K. PAX3-FKHR induces morphological change and enhances cellular proliferation and invasion in rhabdomyosarcoma. Am J Pathol. 2001;159(3):1089–96. doi: 10.1016/S0002-9440(10)61784-1. [DOI] [PMC free article] [PubMed] [Google Scholar]
- 8.Hahn WC, Counter CM, Lundberg AS, Beijersbergen RL, Brooks MW, Weinberg RA. Creation of human tumour cells with defined genetic elements. Nature. 1999;400(6743):464–8. doi: 10.1038/22780. [DOI] [PubMed] [Google Scholar]
- 9.Louro ID, Bailey EC, Li X, South LS, McKie-Bell PR, Yoder BK, Huang CC, Johnson MR, Hill AE, Johnson RL, Ruppert JM. Comparative gene expression profile analysis of GLI and c-MYC in an epithelial model of malignant transformation. Cancer Res. 2002;62(20):5867–73. [PubMed] [Google Scholar]
- 10.Livak KJ, Schmittgen TD. Analysis of relative gene expression data using real-time quantitative PCR and the 2(-Delta Delta C(T)) Method. Methods. 2001;25(4):402–8. doi: 10.1006/meth.2001.1262. [DOI] [PubMed] [Google Scholar]
- 11.Wessel D, Flugge UI. A method for the quantitative recovery of protein in dilute solution in the presence of detergents and lipids. Anal Biochem. 1984;138(1):141–3. doi: 10.1016/0003-2697(84)90782-6. [DOI] [PubMed] [Google Scholar]
- 12.Reznikoff CA, Brankow DW, Heidelberger C. Establishment and characterization of a cloned line of C3H mouse embryo cells sensitive to postconfluence inhibition of division. Cancer Res. 1973;33(12):3231–8. [PubMed] [Google Scholar]
- 13.Tomescu O, Xia SJ, Strezlecki D, Bennicelli JL, Ginsberg J, Pawel B, Barr FG. Inducible short-term and stable long-term cell culture systems reveal that the PAX3-FKHR fusion oncoprotein regulates CXCR4, PAX3, and PAX7 expression. Lab Invest. 2004;84(8):1060–70. doi: 10.1038/labinvest.3700125. [DOI] [PubMed] [Google Scholar]
- 14.Ginsberg JP, Davis RJ, Bennicelli JL, Nauta LE, Barr FG. Up-regulation of MET but not neural cell adhesion molecule expression by the PAX3-FKHR fusion protein in alveolar rhabdomyosarcoma. Cancer Res. 1998;58(16):3542–6. [PubMed] [Google Scholar]
- 15.Wang Q, Song C, Li CC. Molecular perspectives on p97-VCP: progress in understanding its structure and diverse biological functions. J Struct Biol. 2004;146(1-2):44–57. doi: 10.1016/j.jsb.2003.11.014. [DOI] [PubMed] [Google Scholar]
- 16.Yamamoto S, Tomita Y, Nakamori S, Hoshida Y, Nagano H, Dono K, Umeshita K, Sakon M, Monden M, Aozasa K. Elevated expression of valosin-containing protein (p97) in hepatocellular carcinoma is correlated with increased incidence of tumor recurrence. J Clin Oncol. 2003;21(3):447–52. doi: 10.1200/JCO.2003.06.068. [DOI] [PubMed] [Google Scholar]
- 17.Yamamoto S, Tomita Y, Hoshida Y, Sakon M, Kameyama M, Imaoka S, Sekimoto M, Nakamori S, Monden M, Aozasa K. Expression of valosin-containing protein in colorectal carcinomas as a predictor for disease recurrence and prognosis. Clin Cancer Res. 2004;10(2):651–7. doi: 10.1158/1078-0432.ccr-1576-03. [DOI] [PubMed] [Google Scholar]
- 18.Gerke V, Moss SE. Annexins: from structure to function. Physiol Rev. 2002;82(2):331–71. doi: 10.1152/physrev.00030.2001. [DOI] [PubMed] [Google Scholar]
- 19.Park JE, Lee DH, Lee JA, Park SG, Kim NS, Park BC, Cho S. Annexin A3 is a potential angiogenic mediator. Biochem Biophys Res Commun. 2005;337(4):1283–7. doi: 10.1016/j.bbrc.2005.10.004. [DOI] [PubMed] [Google Scholar]
- 20.Wozny W, Schroer K, Schwall GP, Poznanovic S, Stegmann W, Dietz K, Rogatsch H, Schaefer G, Huebl H, Klocker H, Schrattenholz A, Cahill MA. Differential radioactive quantification of protein abundance ratios between benign and malignant prostate tissues: cancer association of annexin A3. Proteomics. 2007;7(2):313–22. doi: 10.1002/pmic.200600646. [DOI] [PubMed] [Google Scholar]
- 21.Liu YF, Xiao ZQ, Li MX, Li MY, Zhang PF, Li C, Li F, Chen YH, Yi H, Yao HX, Chen ZC. Quantitative proteome analysis reveals annexin A3 as a novel biomarker in lung adenocarcinoma. J Pathol. 2009;217(1):54–64. doi: 10.1002/path.2429. [DOI] [PubMed] [Google Scholar]
- 22.Kollermann J, Schlomm T, Bang H, Schwall GP, von Eichel-Streiber C, Simon R, Schostak M, Huland H, Berg W, Sauter G, Klocker H, Schrattenholz A. Expression and prognostic relevance of annexin A3 in prostate cancer. Eur Urol. 2008;54(6):1314–23. doi: 10.1016/j.eururo.2008.01.001. [DOI] [PubMed] [Google Scholar]
- 23.Schostak M, Schwall GP, Poznanovic S, Groebe K, Muller M, Messinger D, Miller K, Krause H, Pelzer A, Horninger W, Klocker H, Hennenlotter J, Feyerabend S, Stenzl A, Schrattenholz A. Annexin A3 in urine: a highly specific noninvasive marker for prostate cancer early detection. J Urol. 2009;181(1):343–53. doi: 10.1016/j.juro.2008.08.119. [DOI] [PubMed] [Google Scholar]
- 24.Balasubramani M, Day BW, Schoen RE, Getzenberg RH. Altered expression and localization of creatine kinase B, heterogeneous nuclear ribonucleoprotein F, and high mobility group box 1 protein in the nuclear matrix associated with colon cancer. Cancer Res. 2006;66(2):763–9. doi: 10.1158/0008-5472.CAN-05-3771. [DOI] [PubMed] [Google Scholar]
- 25.Harris MN, Ozpolat B, Abdi F, Gu S, Legler A, Mawuenyega KG, Tirado-Gomez M, Lopez-Berestein G, Chen X. Comparative proteomic analysis of all-trans-retinoic acid treatment reveals systematic posttranscriptional control mechanisms in acute promyelocytic leukemia. Blood. 2004;104(5):1314–23. doi: 10.1182/blood-2004-01-0046. [DOI] [PubMed] [Google Scholar]
- 26.Vavrova J, Janovska S, Rezacova M, Hernychova L, Ticha Z, Vokurkova D, Zaskodova D, Lukasova E. Proteomic analysis of MOLT-4 cells treated by valproic acid. Mol Cell Biochem. 2007;303(1-2):53–61. doi: 10.1007/s11010-007-9455-0. [DOI] [PubMed] [Google Scholar]
- 27.Sharp S, Workman P. Inhibitors of the HSP90 molecular chaperone: current status. Adv Cancer Res. 2006;95:323–48. doi: 10.1016/S0065-230X(06)95009-X. [DOI] [PubMed] [Google Scholar]
- 28.Scuoppo C, Riess I, Schmitt-Ney M, Allegra P, Forni PE, Bersani F, Taulli R, Accornero P, Crepaldi T, Ponzetto C. The oncogenic transcription factor PAX3-FKHR can convert fibroblasts into contractile myotubes. Exp Cell Res. 2007;313(11):2308–17. doi: 10.1016/j.yexcr.2007.02.037. [DOI] [PubMed] [Google Scholar]
- 29.Moss M, Schwartz R. Regulation of tropomyosin gene expression during myogenesis. Mol Cell Biol. 1981;1(3):289–301. doi: 10.1128/mcb.1.3.289. [DOI] [PMC free article] [PubMed] [Google Scholar]
- 30.Prados J, Melguizo C, Fernandez JE, Aranega AE, Alvarez L, Aranega A. Actin, tropomyosin and alpha-actinin as markers of differentiation in human rhabdomyosarcoma cell lines induced with dimethyl sulfoxide. Cell Mol Biol (Noisy-le-grand) 1993;39(5):525–36. [PubMed] [Google Scholar]
- 31.Lopez-Alemany R, Suelves M, Diaz-Ramos A, Vidal B, Munoz-Canoves P. Alpha-enolase plasminogen receptor in myogenesis. Front Biosci. 2005;10:30–6. doi: 10.2741/1503. [DOI] [PubMed] [Google Scholar]
- 32.Plow EF, Herren T, Redlitz A, Miles LA, Hoover-Plow JL. The cell biology of the plasminogen system. FASEB J. 1995;9(10):939–45. doi: 10.1096/fasebj.9.10.7615163. [DOI] [PubMed] [Google Scholar]
- 33.Ishiguro Y, Kato K, Ito T, Horisawa M, Nagaya M. Enolase isozymes as markers for differential diagnosis of neuroblastoma, rhabdomyosarcoma, and Wilms' tumor. Gann. 1984;75(1):53–60. [PubMed] [Google Scholar]
- 34.Izard T, Evans G, Borgon RA, Rush CL, Bricogne G, Bois PR. Vinculin activation by talin through helical bundle conversion. Nature. 2004;427(6970):171–5. doi: 10.1038/nature02281. [DOI] [PubMed] [Google Scholar]
- 35.Meyer T, Brinck U. Immunohistochemical detection of vinculin in human rhabdomyosarcomas. Gen Diagn Pathol. 1997;142(3-4):191–8. [PubMed] [Google Scholar]
- 36.Trimarchi F, Favaloro A, Fulle S, Magaudda L, Puglielli C, Di Mauro D. Culture of human skeletal muscle myoblasts: timing appearance and localization of dystrophin-glycoprotein complex and vinculin-talin-integrin complex. Cells Tissues Organs. 2006;183(2):87–98. doi: 10.1159/000095513. [DOI] [PubMed] [Google Scholar]
- 37.Petricoin EF, 3rd, Espina V, Araujo RP, Midura B, Yeung C, Wan X, Eichler GS, Johann DJ, Jr, Qualman S, Tsokos M, Krishnan K, Helman LJ, Liotta LA. Phosphoprotein pathway mapping: Akt/mammalian target of rapamycin activation is negatively associated with childhood rhabdomyosarcoma survival. Cancer Res. 2007;67(7):3431–40. doi: 10.1158/0008-5472.CAN-06-1344. [DOI] [PubMed] [Google Scholar]
- 38.Khan J, Bittner ML, Saal LH, Teichmann U, Azorsa DO, Gooden GC, Pavan WJ, Trent JM, Meltzer PS. cDNA microarrays detect activation of a myogenic transcription program by the PAX3-FKHR fusion oncogene. Proceedings of the National Academy of Sciences of the United States of America. 1999;96(23):13264–9. doi: 10.1073/pnas.96.23.13264. [DOI] [PMC free article] [PubMed] [Google Scholar]
- 39.Davicioni E, Finckenstein FG, Shahbazian V, Buckley JD, Triche TJ, Anderson MJ. Identification of a PAX-FKHR gene expression signature that defines molecular classes and determines the prognosis of alveolar rhabdomyosarcomas. Cancer Res. 2006;66(14):6936–46. doi: 10.1158/0008-5472.CAN-05-4578. [DOI] [PubMed] [Google Scholar]
- 40.Wachtel M, Dettling M, Koscielniak E, Stegmaier S, Treuner J, Simon-Klingenstein K, Buhlmann P, Niggli FK, Schafer BW. Gene expression signatures identify rhabdomyosarcoma subtypes and detect a novel t(2;2)(q35;p23) translocation fusing PAX3 to NCOA1. Cancer Res. 2004;64(16):5539–45. doi: 10.1158/0008-5472.CAN-04-0844. [DOI] [PubMed] [Google Scholar]
- 41.Lae M, Ahn EH, Mercado GE, Chuai S, Edgar M, Pawel BR, Olshen A, Barr FG, Ladanyi M. Global gene expression profiling of PAX-FKHR fusion-positive alveolar and PAX-FKHR fusion-negative embryonal rhabdomyosarcomas. J Pathol. 2007;212(2):143–51. doi: 10.1002/path.2170. [DOI] [PubMed] [Google Scholar]
- 42.Hood BL, Conrads TP, Veenstra TD. Unravelling the proteome of formalin-fixed paraffin-embedded tissue. Brief Funct Genomic Proteomic. 2006;5(2):169–75. doi: 10.1093/bfgp/ell017. [DOI] [PubMed] [Google Scholar]