Abstract
Focus information—blur and accommodation—is highly correlated with depth in natural viewing. We examined the use of focus information in solving the binocular correspondence problem and in interpreting monocular occlusions. We presented transparent scenes consisting of two planes. Observers judged the slant of the farther plane, which was seen through the nearer plane. To do this, they had to solve the correspondence problem. In one condition, the two planes were presented with sharp rendering on one image plane, as is done in conventional stereo displays. In another condition, the planes were presented on two image planes at different focal distances, simulating focus information in natural viewing. Depth discrimination performance improved significantly when focus information was correct, which shows that the visual system utilizes the information contained in depth-of-field blur in solving binocular correspondence. In a second experiment, we presented images in which one eye could see texture behind an occluder that the other eye could not see. When the occluder's texture was sharp along with the occluded texture, binocular rivalry was prominent. When the occluded and occluding textures were presented with different blurs, rivalry was significantly reduced. This shows that blur aids the interpretation of scene layout near monocular occlusions.
Keywords: accommodation, blur, focus cues, binocular vision, correspondence problem, stereopsis, 3D displays, volumetric display, monocular occlusion, stereo-transparency
Introduction
To measure 3D scene layout from disparity, the visual system must correctly match points in the two retinal images, matching points that come from the same object in space and not points that come from different objects. This is the binocular correspondence problem. In solving binocular correspondence, the visual system favors matches of image regions with similar motion, color, size, and shape (Krol & van de Grind, 1980; van Ee & Anderson, 2001). Matching by similarity helps because image regions with similar properties are more likely to derive from the same object than image regions with dissimilar properties. The preference for matching similar regions is a byproduct of estimating disparity by correlating the two eyes' images (Banks, Gepshtein, & Landy, 2004).
Focus information—blur and accommodation—also provides potentially useful information for binocular correspondence. The accommodative responses of the two eyes are yoked (Ball, 1952). If one eye is focused on an object, the other eye will generally be as well, and the two retinal images will be sharp. Likewise, if one eye is not focused on an object, the other eye will also generally not be focused on that object and the two retinal images will be blurred. Thus accommodation creates similarity in retinal blur and such similarity could distinguish otherwise similar objects and thereby simplify binocular matching.
In conventional stereo displays, the relationship between scene layout and focus information is greatly disrupted. Such displays have one image plane, so all the pixels have the same focal distance. If objects in the simulated scene are rendered sharply and the eye accommodates to the screen, all objects produce sharp retinal images; when the eye accommodates elsewhere, they produce equally blurred images. In those cases, blur and accommodation provide no useful information about the 3D layout of the simulated scene. If some objects are rendered as sharp and others as blurred, the differential blur in the retinal images provides useful 3D information, but changes in accommodation do not affect retinal blur as they would in natural viewing. Again the natural relationship between accommodation and blur is disrupted.
The discrepancy between real-world focus cues and those in conventional stereo displays becomes most apparent with scenes containing large depth discontinuities. In this paper, we analyze real and simulated stereoscopic imagery, and examine how differences in focus information affect perception. We begin with a theoretical analysis that outlines the potential usefulness of focus information for binocular viewing of objects in the natural environment. We then describe a novel apparatus that allows us to present nearly correct focus information and thereby minimize the disruption in the normal relationship between 3D scene layout, accommodation, and retinal-image blur. We then describe a psychophysical experiment in which focus information was manipulated; this manipulation allowed us to assess the use of defocus blur in binocular matching. Finally, we describe how blur could aid the interpretation of images in which monocular occlusion occurs.
Is focus information a useful cue for binocular matching?
The creation of blur and binocular disparity derives from the same viewing geometry (Held, Cooper, O'Brien, & Banks, 2010; Mather & Smith, 2000; Schechner & Kiryati, 2001). To show the fundamental similarity, we first consider blur. On the left side of Figure 1, a lens focuses an object at distance d0 onto the image plane. Another object is closer to the lens at distance d1 and its image is formed behind the image plane creating a blur circle of diameter b1. Using the thin-lens equation and ray tracing, Held et al. (2010) showed that:
| (1) |
where A is the pupil diameter and s0 is the posterior nodal distance (roughly the distance from the lens to the retina). This equation does not incorporate all of the eye's aberrations (i.e., diffraction, higher-order aberrations), but provides an accurate approximation of blur when the eye is defocused (Cheng et al., 2004). Rearranging, we obtain:
| (2) |
Using the small-angle approximation, we can express the blur-circle diameter in radians:
| (3) |
Figure 1.
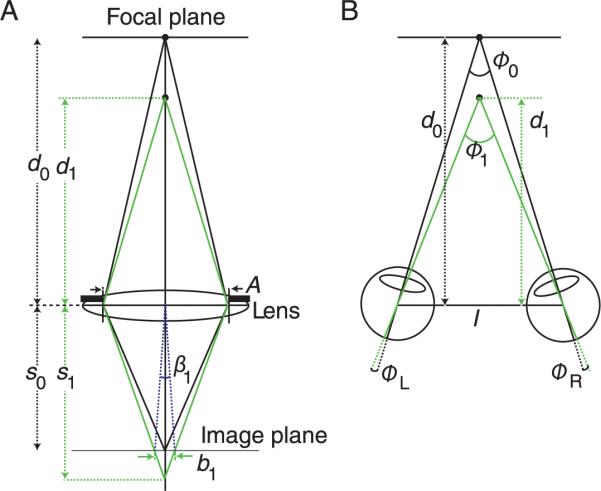
The viewing geometries underlying blur and disparity. A) Formation of blur. A lens is focused on an object at distance d0. Another object is presented at distance d1. The aperture diameter is A. The images are formed on the image plane at distance s0 from the lens. The image of the object at d1 is at best focus at distance s1 and thus forms a blur circle of diameter b1. That blur circle can be expressed as the angle β1. B) Formation of disparity. The visual axes of the two eyes are converged at distance d0. The eyes are separated by I. A second object at distance d1 creates horizontal disparity, which is shown as the retinal angles ΦL and ΦR.
Thus, the angular size of the blur circle is directly proportional to the pupil diameter and the dioptric (the reciprocal of distance in meters) separation of the two object points (Equation 2). We will capitalize on the fact that blur is proportional to depth separation in diopters throughout the remainder of this paper.
Now consider the creation of disparity with the eyes separated by distance I and converged on the object at distance d0. The object at distance d1 creates images at positions ϕL and ϕR in the two eyes. Using the small-angle approximation, we obtain:
| (4) |
Combining Equations 3 and 4, we obtain:
| (5) |
Thus, the magnitudes of blur and disparity are proportional to one another: specifically, the blur-circle diameter is A/I times the disparity. In humans, the inter-ocular separation I is roughly 12 times greater than the steady-state pupil diameter A (de Groot & Gebhard, 1952), so blur magnitude should be roughly 1/12th of the disparity magnitude. The correlation between blur and disparity suggests that focus information could be useful in correlating the two eyes' images, an essential part of disparity estimation.
This relationship between blur and disparity generally holds because accommodation and convergence are coupled. The visual system normally accommodates and converges to the same distance (Fincham & Walton, 1957). Thus blur could be a useful signal for binocular processes, but only if it satisfies two requirements: 1) The same object should produce similar blur in the two retinal images, and 2) different objects should produce dissimilar blur in the two images. We consider those requirements in the next two sections.
Inter-ocular focal differences for one object
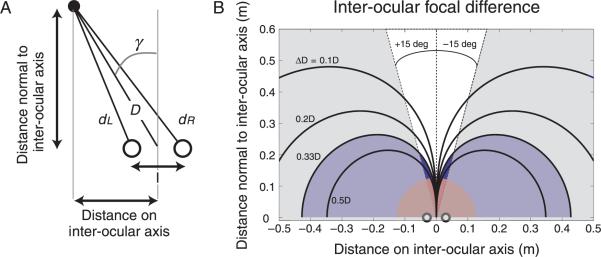
Accommodation is yoked between the two eyes; objects that are equidistant from the eyes will yield the same blur in the retinal images (assuming that differences in refractive error between the eyes—anisometropia—have been corrected with spectacles or contact lenses). However, objects at eccentric viewing positions (i.e., not in the head's sagittal plane) are closer to one eye than the other, so they yield inter-ocular focal differences (Figure 2A). We estimated the viewing situations in which those differences would be perceptible.
Figure 2.
Inter-ocular differences in focal distance. A) Object viewed binocularly. An object is presented at distance D and azimuth γ from the eyes, which are separated by I. The distances from the object to the two eyes are dL and dR. B) Inter-ocular focal difference as a function of object position. The abscissa is object position parallel to the inter-ocular axis and the ordinate is object position perpendicular to that axis. Inter-ocular focal difference is the difference between the reciprocals of the distances to the two eyes in meters (Equation 7). The black contours depict the locations in space where the inter-ocular focal difference is constant. The blue region indicates the locations where the focal difference is greater than the eyes' depth of focus and therefore the focal difference should be perceptible. The gray region shows the range of positions that an observer would typically make a head movement to fixate. The red zone marks the region where objects are closer than 8D, and an observer would typically step back to fixate. The dark blue zone is the region where fixation is possible and there is a perceptible inter-ocular focal difference.
The distances from a point object to the eyes are given by:
| (6) |
where I is inter-ocular distance, D is distance from the cyclopean eye to the object point, and γ is the azimuth of the object (Figure 2A). It is useful to express the differences in distances to the two eyes in diopters (D) because blur is proportional to distance in diopters (Equation 3; Jacobs, Smith, & Chan, 1989). Thus, inter-ocular focal difference is the dioptric difference of the object to the two eyes:
| (7) |
Figure 2B shows inter-ocular focal difference as a function of object position. The abscissa and ordinate represent respectively the horizontal and in-depth coordinates of the object relative to the cyclopean eye. Each contour indicates the locations in space that correspond to a given inter-ocular focal difference. We assume that the eyes' depth of focus under most viewing situations is 0.33D (Campbell, 1957; Walsh & Charman, 1988), so any difference greater should be perceptible (shaded in blue). These regions are both eccentric and near. They are rarely fixated binocularly for two reasons. First, people usually make head movements to fixate objects that are more than 15° from straight ahead (Bahill, Adler, & Stark, 1975); that is, they do not typically make version eye movements greater than 15°. In Figure 2B, the typical version zone is represented by the dashed lines, and version movements outside this zone are shaded gray. Second, people have a tendency to step back from objects that are too close. A typical accommodative amplitude is 8D and thus we have shaded in red the region closer than this. Figure 2B shows that the region in which focal differences would be perceptible and would correspond to azimuths and distances that people would normally fixate is vanishingly small. We conclude that single objects viewed naturally would almost never create perceptually distinguishable retinal blurs. By inference, perceptually distinct blurs are almost always created by different objects.
Inter-ocular focal differences for different objects
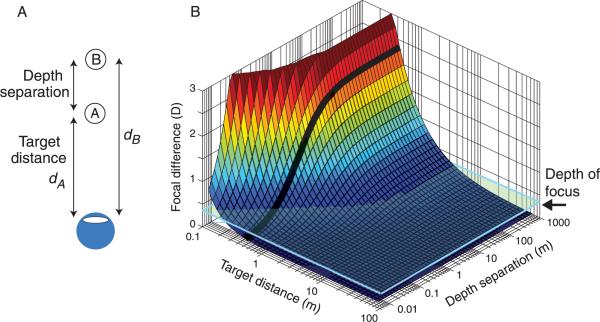
We next estimate the likelihood that two objects, A and B, will produce perceptually distinct retinal blurs (Figure 3A). Assuming that the eye is focused on A, the defocus for B is given by:
| (8) |
Thus, the focal difference depends on the distance to A and the separation between the objects. Figure 3B plots focal difference as a function of accommodative distance (dA) and depth separation (dB – dA). The translucent plane represents the eye's depth of focus of 0.33D, a reasonable value for a wide range of viewing conditions. Any focal differences above that plane should be perceptually distinguishable and any differences below the plane should not be distinguishable. There is a high probability of observing perceptually distinct focal differences when the target distance is short; in that case, even small depth separations create distinguishable focal differences. The figure also shows that the probability of observing distinct differences diminishes as target distance increases; when the target distance exceeds 3 m (0.33D), no physically realizable separation can create distinguishable focal differences.
Figure 3.
Difference in focus for two objects. A) Objects A and B at distances dA and dB. The eye is focused on A. B) Focal difference (Equation 8) plotted as a function of target distance dA and the depth separation between objects: dB − dA. The translucent green plane represents depth of focus, the just-noticeable change in focus. We assumed a value of 0.33D (Campbell, 1957; Walsh & Charman, 1988). The heavy curve represents a fixed viewing distance of dA = 50 cm.
The height of the threshold focal difference (the green translucent plane) depends on the quality of the eye's optics, the pupil size, and the properties of the stimulus (Walsh & Charman, 1988). We assumed a value of 0.33D because that is representative of empirical measurements with young observers and photopic light levels (Campbell, 1957). Other values have been reported. For example, Atchison, Fisher, Pedersen, and Ridall (2005) observed a depth of focus of 0.28D with letter stimuli and large pupils. Walsh and Charman (1988) found that focal changes as small as 0.10D can be detected when the eye is slightly out of focus. Kotulak and Schor (1986) reported that the accommodative system responds to focal changes as small as 0.12D, even though such small changes are not perceptible. We have ignored these special cases for simplicity. If we had included them, the threshold plane would be slightly lower in some circumstances, but our main conclusions would not differ.
The figure shows that there is a wide variety of viewing situations—particularly near viewing—in which two objects will generate perceptually distinguishable blurs in the retina. An interesting target distance is 50 cm (dark contour in Figure 3B), which corresponds to the typical viewing distance for a desktop display and to the display used in many experiments in vision science. When the eye is focused at 50 cm, another object would have to be only 10 cm farther to produce perceptibly different blur. In this case, the differences in blur would be potentially useful for interpreting the retinal images. This amount of blur could only occur with multiple objects because at 50 cm, there is no azimuth at which one object could produce the same difference in retinal blur.
In a conventional stereo display, such differences would be either not present or would not be properly correlated with accommodation.
Having established that blur can provide useful information for interpreting binocular images, we next describe psychophysical experiments that examined whether humans actually capitalize on this information.
Experiment 1A: Binocular matching with and without appropriate blur
We used stereo-transparent stimuli to investigate the visual system's ability to solve the binocular matching problem with and without appropriate blur information. We used transparent stimuli because matching is particularly difficult with such stimuli (Akerstrom & Todd, 1988; Tsirlin, Allison, & Wilcox, 2008; van Ee & Anderson, 2001). When the surfaces have different colors, matching performance is significantly improved (Akerstrom & Todd, 1988). We wanted to know if blur, like color, can help the visual system distinguish the surfaces of a stereo-transparent stimulus.
Methods
Apparatus
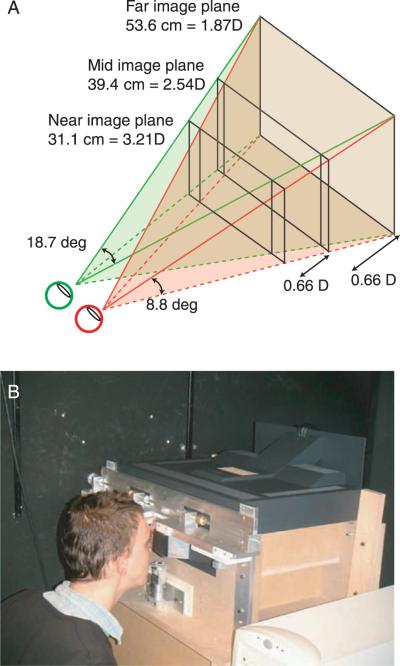
We needed a means of presenting stimuli in which we could show geometrically equivalent stimuli with and without appropriate focus information. We achieved this by using a fixed-viewpoint, volumetric display (Akeley, Watt, Girshick, & Banks, 2004). The display presents nearly correct focus information by optically summing light from three image planes via mirrors and beam splitters. The planes have focal distances of 1.87, 2.54, and 3.21D (Figure 4A). When the distance of the simulated object is equal to the distance of one of the image planes, the display produces correct focus signals by displaying the object on that plane. When the simulated distance is between image planes, the display approximates the focus signals by presenting a weighted blend of light from the two adjacent image planes. This technique is “depth-weighted blending” (Akeley et al., 2004). We present sharply rendered objects and the observer's optics creates the appropriate retinal blur. Note that there is no need to know the observer's accommodative state. Detailed descriptions and analyses of the display are provided by Akeley et al. (2004) and Hoffman, Girshick, Akeley, and Banks (2008). By using this display, we could present geometrically identical retinal images with or without correct focus cues.
Figure 4.
The multi-plane, volumetric display. A) Schematic of the display. The observer's eyes are shown on the left. The three image planes are shown at 31.1, 39.4, and 53.6 cm (3.21, 2.54, and 1.87D, respectively). The images from the planes are superimposed at the eyes with mirrors and beam splitters (not shown). The viewing frusta for the left and right eyes are represented by the green and red shading, respectively. The vertical and horizontal fields of view for each eye are 8.8 and 18.7°, respectively. The brown shading represents the region of binocular overlap. B) Photograph of the display with an observer in place. Periscope optics are used to align the two eyes with the viewing frusta. Head position is fixed with a bite bar. Accurate alignment of the eyes with viewing frusta is crucial to achieve the correct superposition of the images at the retinas. This is achieved by using an adjustable bite-bar mount and hardware and software alignment techniques (Akeley et al., 2004; Hillis & Banks, 2001).
Observers
We screened observers by first measuring their stereoacuity using the Titmus Stereo test. We then had them practice the task. Nine observers who did not have normal stereoacuity or could not consistently fuse the stimulus in the experiment were dismissed. Two experienced psychophysical observers, BV (age 34) and KY (22) participated. Both were emmetropic and naäve to the experimental hypothesis.
Stimulus
The two planes in the stimulus were each textured with 10 white lines of various orientations on black backgrounds. The lines were 8.5 arcmin thick and their ends were not visible. The average orientation of the lines in one eye's image was 0° (i.e., vertical), but we presented five orientation ranges (uniform distribution): 0, ±3, ±6, ±12, and ±24°. Previous research has shown that solving the correspondence problem is relatively easy when the range of orientations is large and is quite difficult when the range is small (den Ouden, van Ee, & de Haan, 2005; van Ee & Anderson, 2001). Figure 5 is a schematic of the stimulus configuration. The near stimulus plane was fronto-parallel and the farther plane was slanted about a vertical axis (tilt = 0°). Both planes were 14° wide and 8.8° tall.
Figure 5.
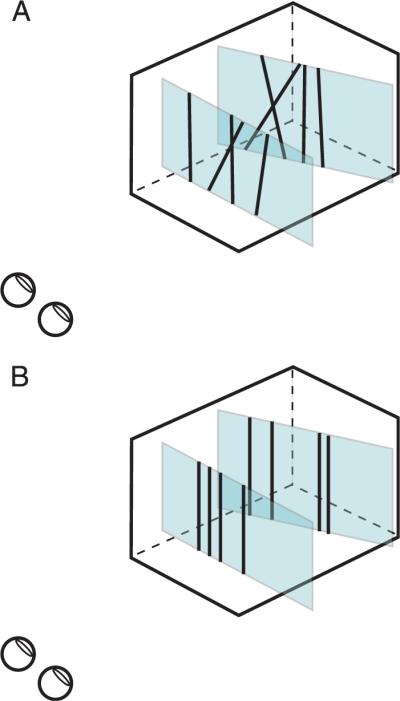
Schematic of the experimental stimuli. The stimuli consisted of a near fronto-parallel plane and a more distant plane that was slanted about the vertical axis (tilt = 0°). The planes were each textured with 10 lines. The ends of the lines were not visible. A) Stimulus when the orientation range is large. B) Stimulus when the orientation range is 0°.
The stimulus manipulation of primary interest was the appropriateness of focus information. On half the trials, both stimulus planes were rendered sharply and displayed on the mid image plane at 39.4 cm (Figure 6A); thus, blur in the retinal images was the same for both planes despite the difference in the disparity-specified depth. If the observer accommodated to the image plane at 39.4 cm, both planes were sharply focused in the retinal images. On the other half of the trials, the stimulus planes were presented on multiple image planes so the blur in the retinal images was consistent with the disparity-specified depth (Equation 5; Figure 6B). On those trials, the near stimulus plane was presented on the near image plane at 31.1 cm and the far stimulus plane was presented mostly on the mid image plane at 39.4 cm. Because the far stimulus plane was generally slanted with respect to fronto-parallel, that plane was actually rendered and displayed with depth-weighted blending of light intensities for the near, mid, and far image planes (Akeley et al., 2004). If the observer accommodated to the mid image plane, the far stimulus plane would be sharply focused in the retinal images, and the near plane would be appropriately blurred. The blur of the front plane corresponded to a focal difference of 0.66D. The blur would of course also depend on the observer's pupil size. The space-average luminance was 5.5 cd/m2, which should yield an average pupil diameter of 4.2 mm (de Groot & Gebhard, 1952).
Figure 6.
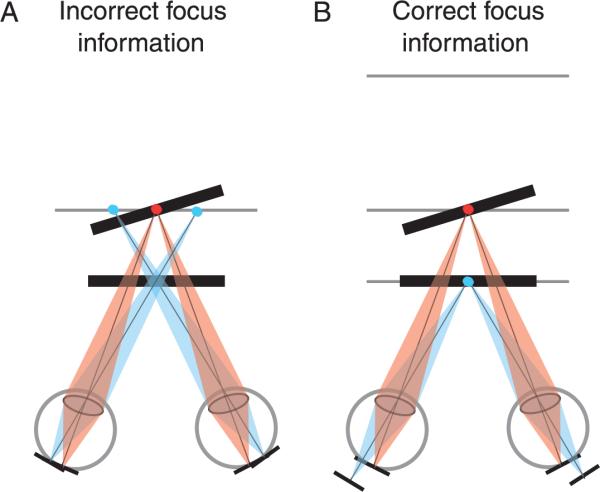
Focus information for the experimental stimuli. The dark line segments represent the disparity-specified planes. The gray lines represent the image planes. The blue and red dots represent the focal stimuli. A) Incorrect focus information. Both stimulus planes are presented on the mid image plane. When the eyes are accommodated to that plane, the retinal images of both stimulus planes are sharp. B) Correct focus information. The near and far stimulus planes are displayed on the near and mid image planes, respectively. The small dark lines at the bottom indicate the locations of the images of the stimulus planes.
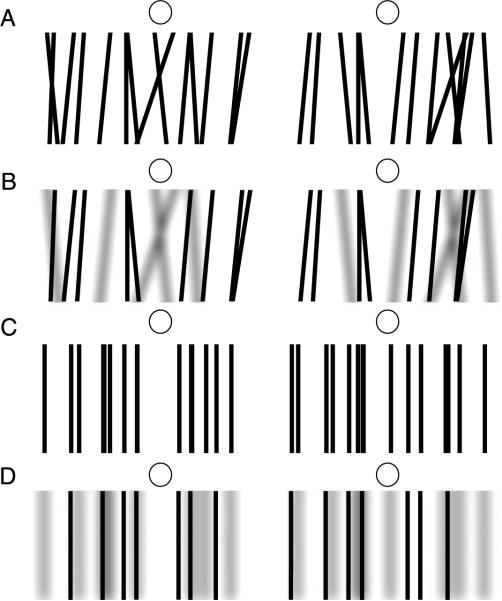
Some example stimuli are shown in Figure 7. Cross fuse to see in depth. A and B have orientation variation, while C and D do not. The lines in A and C are rendered sharply while in B and D the lines in the near plane are rendered blurred. Most people find it easier to perceive the front and back planes when blur is appropriate and when the orientation range of the lines is large.
Figure 7.
Example stimuli. Cross fuse to see in depth. A) Line orientation range is 24° and all lines are sharp. B) Orientation range is 24°; lines on the front plane are blurred and those on the back plane are sharp. C) Orientation range is 0° and all lines are sharp. D) Orientation range is 0°; lines on the front plane are blurred and those on the back plane are sharp. Most people find it easier to perceive the front and back planes when the front plane is blurred.
Procedure
Stimuli were presented for 1500 msec in a 2-alternative, forced-choice procedure. Observers indicated after each stimulus presentation whether the back plane was positively or negatively slanted (right side back or left side back, respectively). A 2-down/1-up staircase adjusted the magnitude of the slant to find the value associated with 71% correct. Step size decreased from 4 to 2 to 1° after each staircase reversal and remained at 1° until the staircase was terminated after the ninth reversal.
All five orientation ranges and both focal conditions were presented in an experimental session. Thus, there were 10 interleaved staircases in a block of trials. The block was repeated eight times so there were approximately 180 stimulus presentations for each stimulus condition. We plotted the data for each condition as a psychometric function and fit the data with a cumulative Gaussian using a maximum-likelihood criterion (Wichmann & Hill, 2001a, 2001b). The mean of the best-fitting Gaussian was an estimate of the 75% correct point, which we define as discrimination threshold.
The task of determining whether the rear stimulus plane had positive or negative slant would be greatly complicated by false matches between non-corresponding line elements. Erroneously fused lines would not have the slant or depth of either of the stimulus planes, and would make the slant discrimination task challenging. One can think of such false matches as adding noise to the discrimination task. Changing the slant of the stimulus plane does not change the difficulty of the correspondence problem, but it does make the signal stronger and thereby improves the signal-to-noise ratio in the task.
Results
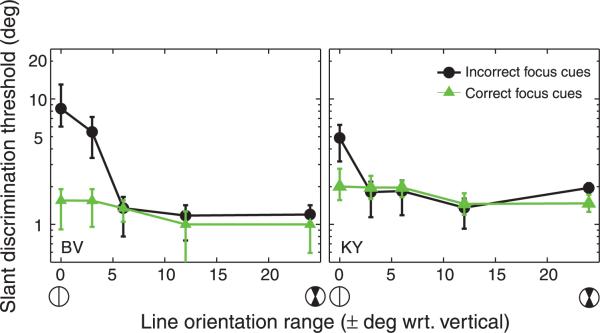
Figure 8 plots discrimination threshold for each stimulus condition. The just-discriminable change in slant is plotted as a function of line-orientation range. The black circles represent data from the incorrect focus cues condition in which both stimulus planes were presented on the mid image plane. Discrimination thresholds were large when the range of line orientations was smaller than 6° and improved when the range was greater than 6°. The green triangles represent the correct focus cues data in which the front stimulus plane was presented on the near image plane and the back stimulus plane was presented on the mid image plane. In this condition, observers could discriminate slant equally well for all orientation ranges. We subjected the data to statistical test and found no significant independent effects of orientation range or focus cues; however, the range × focus interaction approached significance (ANOVA (F = 3.77, df =4) p = 0.055, one tailed).
Figure 8.
Results from Experiment 1A. The abscissa represents the half range of line orientations in the stimulus (uniform distribution). The icons beneath the abscissa depict the orientation range. The ordinate is the slant discrimination threshold. The black circles represent the data when focus cues were incorrect (front and back planes presented on one image plane) and the green triangles represent the data when focus cues were correct (front and back planes presented on different image planes). Error bars represent 95% confidence intervals.
The results of Experiment 1A are consistent with the use of focus information in solving the correspondence problem, but there is a possible alternative explanation. In the correct-focus-information condition, the back stimulus plane was displayed on three image planes with depth-weighted blending and hence it had a blur gradient proportional to its slant. In other words, there was a large difference in the focal distances of the near and far stimulus planes, and a small blur gradient on the far stimulus plane. In the incorrect-focus-information condition, both of the stimulus planes were presented on the same image plane, which eliminated both the small blur gradient and the large focal difference between the stimulus planes. Thus, the blur gradient could have provided slant information when focus cues were correct but not when those cues were incorrect, and observers could have used that monocular information to make responses without solving the binocular matching problem. We explored this possibility in Experiment 1B.
Experiment 1B
The slant-discrimination thresholds in Experiment 1A were as large as 8°. At that slant, the dioptric difference between the near and far edges of the plane were ~0.1D, which is probably sub-threshold (Campbell, 1957). But just to make sure, we reduced the informativeness of the blur gradient in Experiment 1B by decreasing its magnitude to even smaller values.
Methods
Subjects
Three observers participated: BV (age 34), DMH (25), and MST (22). BV and MST were naäve to the experimental hypothesis. DMH is the first author. MST is a 2D myope and was corrected with contact lenses. Five observers were excluded because they could not fuse the stimulus planes.
Apparatus
The apparatus was the same as in Experiment 1A.
Stimulus
The stimulus was the same as in Experiment 1A with the following exceptions. The fronto-parallel near stimulus plane was presented on the mid image plane at 39.4 cm and the slanted back stimulus plane was presented on the far image plane at 53.6 cm. At the distance of the far image plane, the back stimulus plane was at the edge of the workspace. Thus the farther half of the stimulus plane was presented on the far image plane only. The increase in the distance to the far plane coupled with placing it at the edge of the workspace yielded a three-fold decrease in the blur gradient associated with a given slant. If the blur gradient had provided useful information in Experiment 1A, this information would not be available in Experiment 1B, and thresholds would be the same in both focal conditions. The stimulus planes were slightly narrower with a width of 11°, and were textured with slightly thinner 7-arcmin lines. The ranges of line orientations were 0, ±2, ±4, ±8 and ±16°.
Stimulus duration was 1 sec for observers BV and DMH and 1.5 sec for observer MST. The fixation target was presented at the back stimulus plane.
Procedure
The procedure was identical to the one in Experiment 1A.
Results
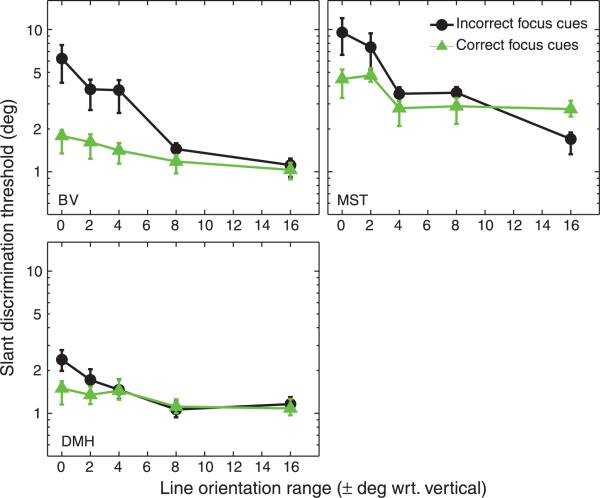
The results are shown in Figure 9. Thresholds were again lower in the correct-focus condition than in the incorrect-focus condition when the orientation range was less than 6°. The interaction effect for focal condition and orientation range was significant (ANOVA (F = 5.269, df =4) p < 0.025, one tailed). Thresholds were also not systematically higher in Experiment 1B than in 1A, which supports the conclusion that the blur gradient was not a useful cue to slant.
Figure 9.
Results from Experiment 1B. The individual panels plot data from the three observers. The abscissas represent the half-range for line orientation (uniform distribution). The ordinates represent the slant discrimination thresholds. The black circles are the data from the incorrect-focus-cues condition and the green triangles are the data from the correct-focus-cues condition. Error bars are 95% confidence intervals.
The results of Experiments 1A and 1B therefore provide strong evidence that the visual system can utilize focus information in solving the binocular correspondence problem.
Experiment 2
Background
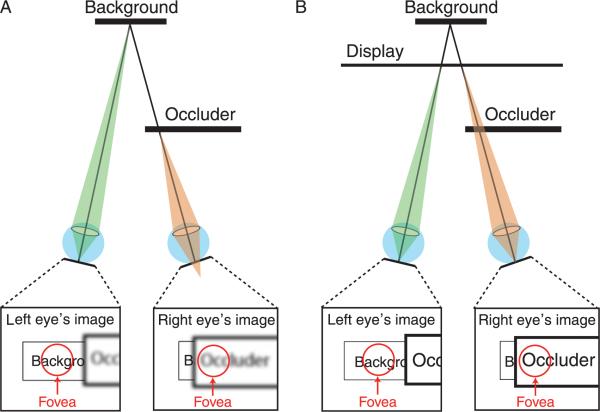
When an opaque surface occludes a more distant surface, one eye can usually see more of the background surface than the other eye can. This is a monocular occlusion, and the region that is visible to only one eye is the monocular zone. Such occlusions are commonplace in natural viewing. In Figure 10A, the observer is looking at a background surface behind an occluder. The eyes are converged on the background, so part of it (the monocular zone) is imaged on the fovea of the left eye, while part of the occluder is imaged on the fovea of the right eye. The eyes are both accommodated to the background, so the retinal image is sharp on the left fovea, and the occluder's image is blurred on the right fovea. In Figure 10B, the same situation is illustrated on a conventional stereo display. Again the eyes are converged at the (simulated) distance of the background. They are, however, accommodated to the distance of the display surface because the light comes from that surface. Now the retinal images on the foveae are both sharp even though the left eye's image is of the background and the right eye's image is of the occluder.
Figure 10.
Monocular occlusions in natural viewing and with conventional stereo displays. A) Natural viewing. An opaque surface monocularly occludes a more distant background surface. The eyes are converged and focused on the background. The insets represent the retinal images for this viewing situation. The background is visible on the fovea of the left eye but not on the fovea of the right eye. The retinal image of the background is well focused and the image of the occluder is not. B) The same viewing situation presented in a conventional stereo display. The eyes are converged at the simulated distance of the background, but they are focused at the surface of the display because the light comes from there. The insets again represent the retinal images for this viewing situation. The retinal images of the background and occluder are well focused.
When different images are presented to the foveae, the viewer typically experiences binocular rivalry: alternating dominance and suppression of the two images. A well-focused image is more likely to dominate a defocused image than a well-focused image (Fahle, 1982; Mueller & Blake, 1989). Furthermore, blurred stimuli with large disparities are easier to fuse because of the expansion of Panum's fusional area at low spatial frequencies (Schor, Wood, & Ogawa, 1984). We hypothesize, therefore, that rivalry is more prevalent with stereo displays than natural viewing.
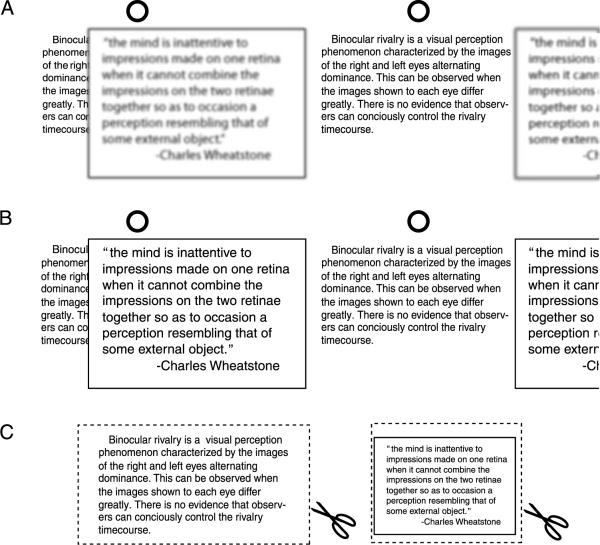
Figure 11 demonstrates our hypothesis. In Figure 11A, the background is sharp and the occluder is blurred. Notice that it is relatively easy to read the text on the background. In Figure 11B, the background and occluder are both sharp. Notice that it is now more difficult to read the background text. Thus the background region near a foreground object might appear more stable under conditions with correct focus cues than with incorrect focus cues. Figure 11A demonstrates the effect of pictorial blur on rivalry, but the effect of defocus blur is similar, and can be demonstrated with the cutouts in Figure 11C. Experiment 2 tested if pictorial blur can help the background region to appear more stable.
Figure 11.
Demonstration that blur affects binocular rivalry with monocular occlusions. A) A stereogram depicting a well-focused textured background monocularly occluded by a blurred textured surface. Cross fuse to see the image in depth. Use the fixation circles to guide fixation. Direct your gaze and attention to the background near the edge of the occluder. Most people experience little rivalry in this case, and can easily read the background text. B) The same stereogram, but with the occluding surface equally focused. Again cross fuse and direct your gaze and attention to the background near the occluder's edge. Most people experience rivalry near the foveas making it somewhat difficult to read the text on the background. C) Text for making cutouts. Cut on the dotted lines to make a background (left) and occluder (right). Hold them such that the occluder is near and on the right partially occluding the background.
Stimuli
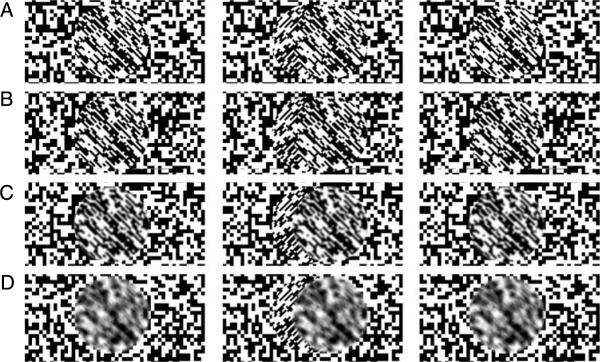
In this experiment, we evaluated the influence of blur (i.e., we did not evaluate the influence of accommodation), and thus we presented the stimuli in a standard mirror stereoscope. The stimuli were stereograms depicting a background and occluder (Figure 12). The background had a random texture and the circular occluder had an oriented random texture. The left side of the occluder blocks more of the background for the right eye than for the left eye: a crescent of background texture is therefore visible to the left, but not the right eye. The texture was oriented in the crescent region of the background and the orientation was perpendicular to the orientation of the texture in the occluder. The background was always rendered sharply. The occluder had four levels of defocus generated by using the Photoshop lens-blur function. The defocus levels corresponded to ratios of pupil diameter divided by inter-ocular separation of 0 (pinhole; Figure 12A), 1/13 (12B), 1/7 (12C), and 1/3.5 (12D). The edge blur was consistent with the texture blur. The order of presentation of the different types of stimuli was randomized. The stimuli had a space-average luminance of 46 cd/m2. At this luminance, the average steady-state pupil diameter is 3.5 mm (de Groot & Gebhard, 1952). For real-world stimuli, this would correspond most closely with stereogram B.
Figure 12.
Stimuli used in Experiment 2. Cross-fuse the images in the first and second columns or divergently fuse the images in the second and third columns. A) Occluder has well-focused random texture. B) Occluder has blurred random texture and contours produced by simulating an aperture that is 1/13 the inter-ocular separation. C) Occluder with blurred random texture and contours produced with aperture/inter-ocular ratio of 1/7. D) Occluder with blurred random texture and contours produced with ratio of 1/3.5.
Observers
Six observers participated. Their ages ranged from 22 to 34 years. All but DMH, the first author, were naäve to the experimental hypothesis. JOS and EAC wore their normal optical corrections during the experiment.
Protocol
Observers were instructed to fixate the crescent region of the stereogram: the part of the background just to the left of the occluder. While viewing a stimulus for 3 min, they indicated the perceived orientation of the texture in the crescent region by holding down the appropriate button. When the left-eye's image was dominant, the perceived orientation was up and to the left; when the right-eye's image was dominant, perceived orientation was up and to the right.
Results
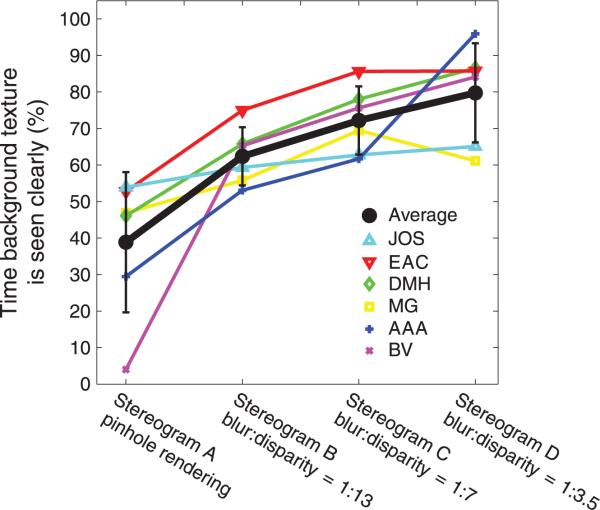
We computed the percentage of time the background texture was dominant over the occluder texture. Those percentages are plotted in Figure 13 for each of the stimulus types. Each observer is represented by a different color. The black points and lines represent the averages. In the unblurred condition in which the background and occluder were well-focused (Figure 12A), the background was dominant roughly 50% of the time. Adding blur to the occluder significantly increased the dominance of the background (repeated-measures ANOVA (F = 11.2, df = 3), p < 0.001). Recall that the most realistic blur was presented in stereogram B. The difference in dominance between stereograms A and B was significant (paired t test: p < 0.05). The results clearly show that the addition of blur affects binocular rivalry in the presence of monocular occlusion. This is consistent with our hypothesis that rivalry near occlusion boundaries is more noticeable in stereo displays than in natural viewing.
Figure 13.
Results for Experiment 2. The percentage of time the background texture was perceived as dominant is plotted on the ordinate. The different stimulus types are plotted on the abscissa. The colored symbols represent the data from each observer. The black symbols represent the across-observer averages. Error bars are standard deviations.
Discussion
Focus information can have a striking influence on binocular percepts (Buckley & Frisby, 1993; Frisby, Buckley, & Duke, 1996; Hoffman et al., 2008; Watt, Akeley, Ernst, & Banks, 2005). We showed that blur could in principle provide a useful cue for guiding appropriate matches when solving the correspondence problem. The results of Experiment 1 showed that human observers do in fact use such information in solving binocular correspondence. We also pointed out that appropriate focus information might minimize the occurrence of binocular rivalry near occluding contours. The results of Experiment 2 demonstrated that this occurs: rivalry is less prominent when focus information is appropriate as opposed to inappropriate. In the remainder of the discussion, we consider other perceptual phenomena that are affected by focus information.
Blur and stereoacuity
Stereoacuity is markedly lower when the half images are blurred. Westheimer and McKee (1980) found that with increasing defocus, stereo thresholds degraded faster than visual acuity. For 3.0 D of defocus, stereothresholds rose by a factor of 10, whereas visual acuity thresholds rose by a factor of 2. Thus, to achieve optimal stereoacuity, both eyes must be well focused on the stimulus. Surprisingly, if the eyes are both initially defocused relative to the stimulus, but one eye's image is then improved, stereoacuity worsens. In other words, having one blurred and one sharp image is more detrimental to stereoacuity than having two blurred images. This phenomenon is known as the stereo blur paradox (Goodwin & Romano, 1985; Westheimer & McKee, 1980). Stereo thresholds are also adversely affected when the contrasts in the two eyes differ. This effect is called the stereo contrast paradox (Cormack, Stevenson, & Landers, 1997; Halpern & Blake, 1988; Legge & Gu, 1989; Schor & Heckmann, 1989; Smallman & McKee, 1995). The blur and contrast paradoxes both manifest the importance of image similarity in binocular matching. Our analysis of retinal-image blur in natural viewing suggests that for a single object, perceptually discriminable image blur between the two eyes rarely occurs (Figure 2). Thus, the blur paradox is unlikely to occur in natural viewing.
Estimating depth from blur with monocular occlusions
With monocular occlusions, like the situation in Figure 10, disparity cannot be measured because one eye cannot see the object. As a consequence, the object's distance cannot be estimated from disparity (Anderson & Nakayama, 1994; Belhumeur & Mumford, 1992). Here we consider the possibility that one can estimate the distance from blur when monocular occlusion occurs.
We assume that the observer is converged and focused on the edge of the occluder at distance d0. A small object at distance d1 is visible to the left eye only. The object is myopically focused creating a blurred image at the retina. (Figure 14) The relationship between the dioptric difference in distance and blur magnitude is the same as the hyperopic situation in Figure 1 (except that the sign of defocus is opposite). From Equation 3, the object at d1 creates a blur circle of diameter β1 in radians. We can then solve for d1:
| (9) |
Figure 14.
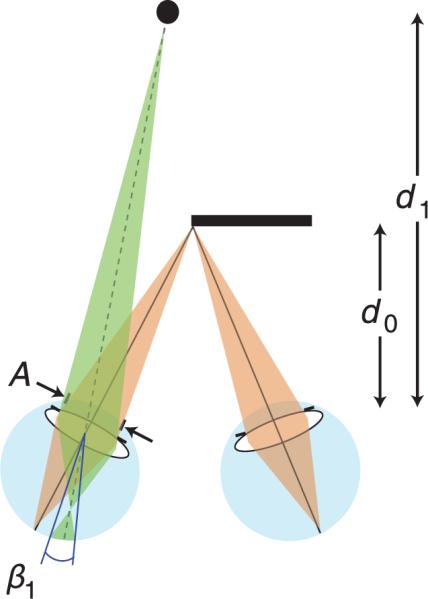
Depth from blur in monocular occlusion. The viewer fixates the edge of an occluder at distance d0, so the eyes are converged and accommodated to that distance. Pupil diameter is A. A small object at distance d1 is visible to the left eye only. That object creates a blur circle of diameter β1.
The observer can estimate d0 from vergence and vertical disparity (Backus, Banks, van Ee, & Crowell, 1999; Gårding, Porrill, Mayhew, & Frisby, 1995). The pupil diameter A is presumably unknown to the observer, but steady-state diameter does not vary significantly. For luminances of 5–2500 cd/m2, a range that encompasses typical indoor and outdoor scenes, steady-state diameter varies by only ±1.5 mm within an individual (de Groot & Gebhard, 1952). Thus it is reasonable to assume that the mean of A is 3 mm with a standard deviation of 0.6 mm. The blur-circle diameter b1 also has to be estimated, which requires an assumption about the spatial-frequency distribution of the stimulus (Pentland, 1987). The estimation of blur-circle diameter will also be subject to error (Mather & Smith, 2002). We can then treat the estimates of d0, A, and β1 as probability distributions and find the distribution of d1. In principle then, one can estimate the distance of a partially occluded object from its blur. Can this be done in practice?
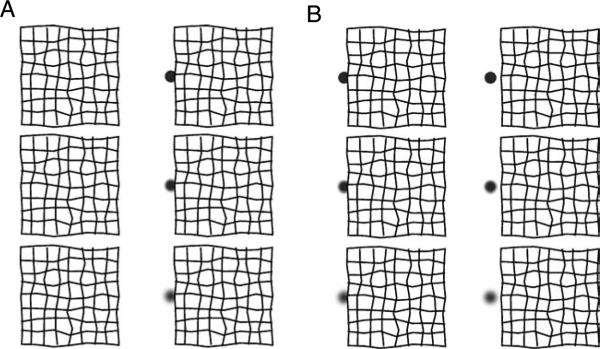
Figure 15 demonstrates that blur can indeed affect perceived distance in the monocular occlusion situation. The three stereograms in panel A depict a textured surface that is partially occluding a more distant small object. The blur of the small object increases from the top to bottom row. Most viewers perceive the object as more distant in the middle row than in the top row and more distant in the bottom than in the middle row. Thus blur can aid the estimation of distance in a situation where disparity cannot provide an estimate.
Figure 15.
Demonstration of an effect of blur in monocular occlusion. The blur of the small disk increases from the top to bottom row. Cross fuse. A) Fixate the left edge of the textured square and estimate the distance to the disk. Most people report that the disk appears more distant in the middle than top row and more distant in the bottom than middle row. B) The object is visible to both eyes, so disparity can be computed. Blur now has a reduced effect on perceived distance of the disk.
Panel B depicts the same 3D layout but the small object is farther to the left such that it is visible to both eyes. In this case, the effect of blur on perceived distance is reduced, presumably because disparity now specifies object distance.
The natural relationship between blur and depth
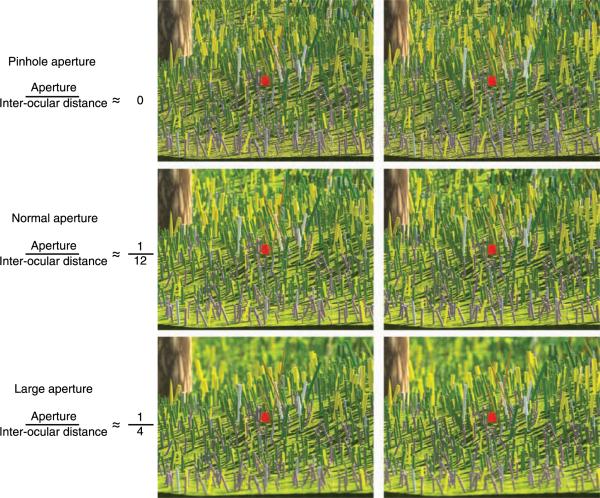
In natural viewing, the blur-circle diameter expressed in angular units is determined only by the pupil diameter A, the distance to which the eye is focused, d0, and the distance of the object generating the blur circle, d1. The pupil diameter is relatively constant in typical viewing situations, so there must be a commonly experienced relationship between blur, focal distance, and the 3D layout of the scene. We can recreate this relationship in a picture provided that the viewer focuses on the distance of the picture surface. Do changes in this relationship affect perceived 3D layout? Figure 16 shows that they do. The figure contains three stereo pictures of the same 3D scene. They were rendered with different ratios of aperture divided by inter-ocular distance (A/I). Specifically, the upper, middle, and bottom rows were rendered with ratios A/I of ~0, 1/12, and 1/4, respectively. For an inter-ocular distance of 6 cm, these correspond to aperture diameters of: ~0, 5, and 15 mm. As we said earlier, the steady-state pupil diameter for a typical viewing situation is 3 mm (±0.6 mm). To most viewers, the second row looks more realistic than the other two provided that one maintains focus on the red dot. The upper row appears somewhat flattened and artificial. The lower row appears miniaturized because it is an example of the tilt-shift miniaturization effect (Held et al., 2010). This demonstration shows that obeying the natural relationship between blur and depth yields the most realistic percept. This implies that the human visual system has incorporated the depth information in blur and uses it to interpret 3D imagery.
Figure 16.
Demonstration of the appropriate relationship between blur and 3D layout. Cross fuse. The appropriate viewing distance is 10 picture-widths. In each case, the virtual camera is focused on the red dot. Upper row: The camera's aperture was a pinhole. Middle row: The camera's aperture was 1/12 times the inter-camera separation. Bottom row: The aperture was 1/4 times the camera separation. These stereograms do not recreate the vergence eye position that would correspond to converging on the red dot in the corresponding real scene. One would have to present the images in a stereoscope to recreate the correct vergence. The demonstration works reasonably well nonetheless. (Computer model provided by Norbert Kern.)
The fact that the blur pattern affects depth perception does not necessarily mean that one should always render images with a camera aperture the size of the viewer's pupil. Consider, for example, using medical images for diagnosis. With stereo images of chest X-rays, the doctor will undoubtedly prefer having the entire volume in sharp focus so that he/she can detect anomalies wherever they occur. Alternatively, in some medical applications, such as using an endoscope, the camera separation may be very different from a person's inter-ocular separation. Scaling the aperture diameter appropriately may be impractical in this situation due to diffraction effects, and light-gathering limitations. In this situation, the reduced depth of focus may help the doctor to view a surface that is partially occluded or obscured by a semitransparent membrane.
Conclusions
The work presented here demonstrates that retinal-image blur influences the interpretation of binocular images. Some of the mechanisms involved are low-level: the binocular-matching process and the processes underlying image suppression in binocular rivalry. Other mechanisms seem to be more complex, such as how disparity in combination with the appropriate magnitude of blur makes stereoscopic images appear more natural.
Acknowledgments
This research was supported by NIH Research Grant RO1 EY-014194. Thanks to Norbert Kern for providing the computer model used to render the demonstration in Figure 16. Also, we appreciate the work of Kurt Akeley for developing the software to drive the volumetric display used in Experiment 1, and for his thoughtful review of the manuscript. We also thank Robin Held, Emily Cooper, Simon Watt and Hany Farid for commenting on an earlier draft.
Footnotes
Commercial relationships: none.
References
- Akeley K, Watt SJ, Girshick AR, Banks MS. A stereo display prototype with multiple focal distances. ACM Transactions on Graphics. 2004;23:804–813. [Google Scholar]
- Akerstrom RA, Todd JT. The perception of stereoscopic transparency. Perception & Psychophysics. 1988;44:421–432. doi: 10.3758/bf03210426. [DOI] [PubMed] [Google Scholar]
- Anderson BL, Nakayama K. Toward a general theory of stereopsis: Binocular matching, occluding contours and fusion. Psychological Review. 1994;101:414–445. doi: 10.1037/0033-295x.101.3.414. [DOI] [PubMed] [Google Scholar]
- Atchison DA, Fisher SW, Pedersen A, Ridall PG. Noticeable, troublesome and objectionable limits of blur. Vision Research. 2005;45:1967–1974. doi: 10.1016/j.visres.2005.01.022. [DOI] [PubMed] [Google Scholar]
- Backus BT, Banks MS, van Ee R, Crowell JA. Horizontal and vertical disparity, eye position, and stereoscopic slant perception. Vision Research. 1999;39:1143–1170. doi: 10.1016/s0042-6989(98)00139-4. [DOI] [PubMed] [Google Scholar]
- Bahill AT, Adler D, Stark L. Most naturally occurring human saccades have magnitudes of 15 degrees or less. Investigative Ophthalmology & Vision Science. 1975;14:468–469. [PubMed] [Google Scholar]
- Ball EAW. A study in consensual accommodation. American Journal of Optometry. 1952;29:561–574. [PubMed] [Google Scholar]
- Banks MS, Gepshtein S, Landy MS. Why is stereoresolution so low? Journal of Neuroscience. 2004;24:2077–2089. doi: 10.1523/JNEUROSCI.3852-02.2004. [DOI] [PMC free article] [PubMed] [Google Scholar]
- Belhumeur PN, Mumford D. A Bayesian treatment of the stereo correspondence problem using half-occluded regions. IEEE: Proceedings of Computer Vision and Pattern Recognition. 1992:506–512. [Google Scholar]
- Buckley D, Frisby JP. Interaction of stereo, texture and outline cues in the shape perception of three-dimensional ridges. Vision Research. 1993;33:919–933. doi: 10.1016/0042-6989(93)90075-8. [DOI] [PubMed] [Google Scholar]
- Campbell FW. The depth of field of the human eye. Journal of Modern Optics. 1957;4:157–164. [Google Scholar]
- Cheng H, Barnett JK, Vilupuru AS, Marsack JD, Kasthurirangan S, Applegate RA, et al. A population study on changes in wave aberrations with accommodation. Journal of Vision. 2004;4(4):3, 272–280. doi: 10.1167/4.4.3. http://journalofvision.org/content/4/4/3, doi:10.1167/4.4.3. [DOI] [PubMed] [Google Scholar]
- Cormack LK, Stevenson SB, Landers DD. Interactions of spatial frequency and unequal monocular contrasts in stereopsis. Perception. 1997;26:1121–1136. doi: 10.1068/p261121. [DOI] [PubMed] [Google Scholar]
- de Groot SG, Gebhard JW. Pupil size as determined by adapting luminance. Journal of the Optical Society of America. 1952;42:492–495. doi: 10.1364/josa.42.000492. [DOI] [PubMed] [Google Scholar]
- den Ouden HE, van Ee R, de Haan EH. Colour helps to solve the binocular matching problem. The Journal of Physiology. 2005;567:665–671. doi: 10.1113/jphysiol.2005.089516. [DOI] [PMC free article] [PubMed] [Google Scholar]
- Fahle M. Binocular rivalry: Suppression depends on orientation and spatial frequency. Vision Research. 1982;22:787–800. doi: 10.1016/0042-6989(82)90010-4. [DOI] [PubMed] [Google Scholar]
- Fincham EF, Walton J. The reciptocal actions of accommodation and convergence. The Journal of Physiology. 1957;137:488–508. doi: 10.1113/jphysiol.1957.sp005829. [DOI] [PMC free article] [PubMed] [Google Scholar]
- Frisby JP, Buckley D, Duke PA. Evidence for good recovery of lengths of real objects seen with natural stereo viewing. Perception. 1996;25:129–154. doi: 10.1068/p250129. [DOI] [PubMed] [Google Scholar]
- Gårding J, Porrill J, Mayhew JE, Frisby JP. Stereopsis, vertical disparity and relief transformations. Vision Research. 1995;35:703–722. doi: 10.1016/0042-6989(94)00162-f. [DOI] [PubMed] [Google Scholar]
- Goodwin RT, Romano PE. Stereo degradation by experimental and real monocular and binocular amblyopia. Investigative Ophthalmology & Visual Science. 1985;26:917–923. [PubMed] [Google Scholar]
- Halpern DL, Blake RR. How contrast affects stereoacuity. Perception. 1988;17:483–495. doi: 10.1068/p170483. [DOI] [PubMed] [Google Scholar]
- Held RT, Cooper EA, O'Brien JF, Banks MS. Using blur to affect perceived distance and size. ACM Transactions on Graphics. 2010;29:1–16. doi: 10.1145/1731047.1731057. [DOI] [PMC free article] [PubMed] [Google Scholar]
- Hillis JM, Banks MS. Are corresponding points fixed? Vision Research. 2001;41:2457–2473. doi: 10.1016/s0042-6989(01)00137-7. [DOI] [PubMed] [Google Scholar]
- Hoffman DM, Girshick AR, Akeley K, Banks MS. Vergence-accommodation conflicts hinder visual performance and cause visual fatigue. Journal of Vision. 2008;8(3):33, 1–30. doi: 10.1167/8.3.33. http://journalofvision.org/content/8/3/33, doi:10.1167/8.3.33. [DOI] [PMC free article] [PubMed] [Google Scholar]
- Jacobs RJ, Smith G, Chan CDC. Effect of defocus on blur thresholds and on thresholds of perceived change in blur: Comparison of source and observer methods. Optometry & Vision Science. 1989;66:545–553. doi: 10.1097/00006324-198908000-00010. [DOI] [PubMed] [Google Scholar]
- Kotulak JC, Schor CM. The accommodative response to subthreshold blur and perceptual fading during the Troxler phenomenon. Perception. 1986;15:7–15. doi: 10.1068/p150007. [DOI] [PubMed] [Google Scholar]
- Krol JD, van de Grind WA. The double-nail illusion: Experiments on binocular vision with nails, needles, and pins. Perception. 1980;9:651–669. doi: 10.1068/p090651. [DOI] [PubMed] [Google Scholar]
- Legge GE, Gu Y. Stereopsis and contrast. Vision Research. 1989;29:989–1004. doi: 10.1016/0042-6989(89)90114-4. [DOI] [PubMed] [Google Scholar]
- Mather G, Smith DRR. Depth cue integration: Stereopsis and image blur. Vision Research. 2000;40:3501–3506. doi: 10.1016/s0042-6989(00)00178-4. [DOI] [PubMed] [Google Scholar]
- Mather G, Smith DRR. Blur discrimination and its relation to blur-mediated depth perception. Perception. 2002;31:1211–1219. doi: 10.1068/p3254. [DOI] [PubMed] [Google Scholar]
- Mueller TJ, Blake R. A fresh look at the temporal dynamics of binocular rivalry. Biological Cybernetics. 1989;61:223–232. doi: 10.1007/BF00198769. [DOI] [PubMed] [Google Scholar]
- Pentland A new sense for depth of field. IEEE Transactions on Pattern Analysis and Machine Intelligence. 1987;9:523–531. doi: 10.1109/tpami.1987.4767940. [DOI] [PubMed] [Google Scholar]
- Schechner YY, Kiryati N. Depth from defocus vs. stereo: How different really are they? International Journal of Computer Vision. 2001;39:141–162. [Google Scholar]
- Schor C, Wood I, Ogawa J. Binocular sensory fusion is limited by spatial resolution. Vision Research. 1984;24:661–665. doi: 10.1016/0042-6989(84)90207-4. [DOI] [PubMed] [Google Scholar]
- Schor CM, Heckmann T. Interocular differences in contrast and spatial frequency: Effects on stereopsis and fusion. Vision Research. 1989;29:837–847. doi: 10.1016/0042-6989(89)90095-3. [DOI] [PubMed] [Google Scholar]
- Smallman HS, McKee SP. A contrast ratio constraint on stereo matching. Proceedings of the Royal Society London: Biological Sciences. 1995;260:265–271. doi: 10.1098/rspb.1995.0090. [DOI] [PubMed] [Google Scholar]
- Tsirlin I, Allison RS, Wilcox LM. Stereoscopic transparency: Constraints on the perception of multiple surfaces. Journal of Vision. 2008;8(5):5, 1–10. doi: 10.1167/8.5.5. http://journalofvision.org/content/8/5/5, doi:10.1167/8.5.5. [DOI] [PubMed] [Google Scholar]
- van Ee R, Anderson BL. Motion direction, speed, and orientation in binocular matching. Nature. 2001;410:690–694. doi: 10.1038/35070569. [DOI] [PubMed] [Google Scholar]
- Walsh G, Charman WN. Visual sensitivity to temporal change in focus and its relevance to the accommodation response. Vision Research. 1988;28:1207–1221. doi: 10.1016/0042-6989(88)90037-5. [DOI] [PubMed] [Google Scholar]
- Watt SJ, Akeley K, Ernst MO, Banks MS. Focus cues affect perceived depth. Journal of Vision. 2005;5(10):7, 834–862. doi: 10.1167/5.10.7. http://journalofvision.org/content/5/10/7, doi:10.1167/5.10.7. [DOI] [PMC free article] [PubMed] [Google Scholar]
- Westheimer G, McKee SP. Stereoscopic acuity with defocused and spatially filtered retinal images. Optical Society of America. 1980;70:772–778. [Google Scholar]
- Wichmann FA, Hill NJ. The psychometric function: I. Fitting, sampling, and goodness of fit. Perception & Psychophysics. 2001a;63:1293–1313. doi: 10.3758/bf03194544. [DOI] [PubMed] [Google Scholar]
- Wichmann FA, Hill NJ. The psychometric function: II. Bootstrap-based confidence intervals and sampling. Perception & Psychophysics. 2001b;63:1314–1329. doi: 10.3758/bf03194545. [DOI] [PubMed] [Google Scholar]


