Abstract
Amid increases in costs and numbers of patients combined with decreasing or stagnant reimbursements from payers, many oncology practices are improving efficiency and decreasing costs. The National Oncology Practice Benchmark, a national survey of community practices, provides data to help practices improve and monitor progress as they adapt to the changing practice environment.
Introduction
You have before you what we believe is the largest compilation of oncology practice data available to date. We became involved in oncology benchmarking in 2001, when each of us served on the executive committee of the Administrators in Oncology Hematology Assembly of the Medical Group Management Association (MGMA; Englewood, CO) and worked with MGMA in the development and publication of oncology-specific survey reports in 2000,1 2002,2 and 2003.3 Survey data for 20054 and 20065 were published in Journal of Oncology Practice. Oncology Metrics launched the National Practice Benchmark in 2007 and has published articles on the basis of data for 2007,6 2008,7 and 2009.8 All of these publications represent a brief glimpse into the collected data, but the larger body of work has not been broadly available until now.
This is the first time that the entire benchmarking survey is being made widely available, and we hope that readers of this National Practice Benchmark report find this a valuable tool to understand and manage today's oncology practice. With our multiyear perspective, we have come away with several observations that we believe are worth your consideration. We encourage you to come to your own interpretations of these data.
Practices Are Adapting to Changing Conditions
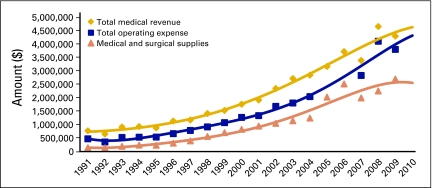
As you study this report, keep in mind the trends represented in Figure 1 to understand what has changed, what is changing, and what is holding constant in the evolving business model of medical oncology service delivery. Revenue and costs are clearly shifting, but many practices are adapting to balance these shifts.
Figure 1.
Oncology business trends per full-time equivalent physician. Data from 1991 to 2003 compiled from Medical Group Management Association (Englewood, CO); data from 2004 to 2009 compiled from Oncology Metrics, a division of Altos Solutions (Los Altos, CA).
In Figure 1, the difference between the gold line, representing total medical revenue, and the blue line, representing total operating expense, is an approximation of the amount of money that is generated to pay both for physician labor and as a return on risk of business ownership by the physician owner/operator. After years of steady and predictable performance, this gap began to expand in 2001 and continued to do so until 2007. From that time on, the gap is seen to be narrowing. Much of what you will see in this benchmarking report can be seen as a shift of practices toward efficiency—that is, a lowering of cost of operations even as the cost of drugs rises. That efficiency often takes the form of the hematology oncology (HemOnc) physician doing more clinical work, thus more effectively using the most valuable resource of the practice to greater efficiency.
Operational Efficiency Is Offsetting Increased Drug Costs
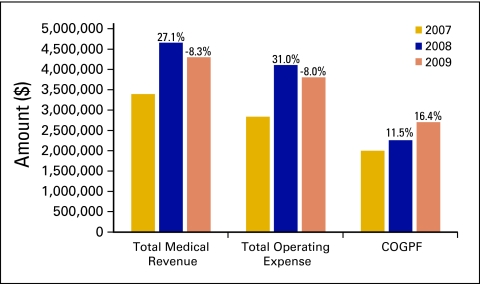
Total medical revenue and total operating expense are among the most important data that oncology practices monitor on a regular basis. Figure 2 shows 3-year trends for these important metrics, as well as for the cost of goods paid for (COGPF). Total medical revenue is defined as all revenue collected in the period for the provision of medical goods and services. This does not include nonmedical revenue, which is defined as revenue earned for services other than the provision of medical care. Total operating expense is defined as all cash expenses for the period except for W-2 physician compensation. COGPF is defined as the total of all money paid for drugs in the period less rebates or other cash reductions received in the same period. Each of these data elements is reported as the average per full-time equivalent (FTE) HemOnc physician.
Figure 2.
Three-year trend in total medical revenue, total operating expense, and cost of goods paid for (COGPF). Percentages represent change from one year to the next.
It is interesting to note that total medical revenue and total operating expense track one another through the three years, but the COGPF increases in each year. The decrease in total operating expense that we see between 2008 and 2009 was achieved even with a continued rise in drug costs. We believe this reveals an overall lowering of the cost of practice operations, even as the cost of drugs continues to rise, consistent with the slight increase in the number of new patients per FTE HemOnc physician. These three measures indicate an overall increase in service delivery efficiency.
Today's oncology delivery system, comprised primarily of independent, physician-owned clinics, has been shown overall to be a cost-effective model to accomplish the difficult task of providing expensive, time sensitive, toxic, and extraordinarily beneficial therapy to many people living with cancer throughout this 19-year span of data. In the most recent 3 years, this delivery system has also proven itself able to adapt to changing business conditions by generating new efficiencies. Although there are practices that are closing their doors, many physician-owned oncology practices remain healthy and viable, and others are adapting to changing market conditions by working with partners, such as hospitals and multispecialty groups. We believe that the community oncology delivery system will continue to adapt to the changes that will evolve from the health care reform that is now underway.
National Practice Benchmark
The National Practice Benchmark was developed by Oncology Metrics, a division of Altos Solutions (Los Altos, CA), by a team of professionals with many years of experience in oncology practice, surveys, and benchmarking. Benchmarking is widely recognized as the best, most efficient way to find opportunities to improve a practice and then monitor progress after corrective action is taken.9 The National Practice Benchmark provides important and meaningful data for oncology practices to use in today's challenging practice environment.
Medical oncologists, practice administrators, and other key staff members from approximately 2,000 practices across the country were invited to participate in the 2010 National Practice Benchmark. Practices that completed the entire survey received an electronic version of the complete survey report as well as a personalized report comparing their practice with the entire data set on several key benchmarks. Additionally, the first 65 practices to complete all applicable questions received $25 gift cards. Participants were invited to participate via e-mail, and the survey was completed entirely online. Practices were instructed to submit only one survey per practice.
The National Practice Benchmark survey instrument reflects data from calendar year 2009 or the most recently completed 12-month accounting period. Practices were not required to complete all questions, and data from incomplete surveys are included in the final survey results. Data were submitted by HemOnc single-specialty practices as well as by multispecialty practices. For many of the metrics in this report, analysis was performed on the basis of both FTE HemOnc physicians and standard HemOnc physicians. A standard HemOnc physician is defined as a HemOnc physician who sees 350 new patients (new patients and consultations, both office and hospital) in a 12-month period.
A total of 193 survey responses were submitted; 4 were deemed to be duplicates and were discarded. Responses were received from practices in 44 states. Five states—California, Florida, New Jersey, New York, and Texas—had more than 10 responses; 5 additional states—Georgia, Illinois, Michigan, Ohio, and Washington—had between 5 and 10 responses. Each of the remaining 34 states had fewer than 5 responses.
The number of responses to individual questions varied. All responses are included for the qualitative information presented in this report (demographics, operations, information systems). Quantitative benchmarks, however, are reported only for practices that met specific exclusion criteria. To be included in the level 1 quantitative benchmarks, practices must have submitted the following data elements:
number of FTE HemOnc physicians
total revenue
COGPF
number of consultations and new patients at the office
number of consultations at the hospital
Inclusion/exclusion criteria were then applied to:
include practices with a HemOnc capacity ratio between 0.3 and 3.0
exclude practices reporting higher drug revenue than total revenue
exclude practices reporting higher COGPF than total revenue
exclude practices reporting drug revenue less than 0.5% or greater than 1.5% of COGPF
A total of 65 practices with 556 FTE HemOnc physicians met these criteria and are included in the level 1 analysis. Additional exclusions were applied to specific benchmarks for data outside the range of credible results.
All practices that qualified for level 1 were also considered for level 2 benchmarks. Only practices that provided complete and reasonable data were actually included in the level 2 reporting.
Confidentiality
Oncology Metrics is committed to protecting the confidentiality of individual practice data and makes a commitment to National Practice Benchmark participants—“All of the individual data that you provide in the survey is absolutely confidential and will never be disclosed. Access to the data file that Oncology Metrics creates from this survey will never be made available to any party. Oncology Metrics will create analytic reports including aggregated data from this survey but will always publish in a manner that completely obscures the source of the data so that no reader can make any supported inference of data to any individual practice.”
Understanding the National Practice Benchmark Report
Data in the National Practice Benchmark are presented in an easy-to-understand format using a variety of charts and graphs, primarily pie charts and bar graphs. Definitions are provided as needed for the data elements presented.
Pie charts show the quantitative relationship of items in one data series proportional to the sum of the items. The data points in a pie chart are displayed as a percentage of the whole pie.
Bar graphs illustrate comparisons among individual items. In horizontal bar graphs, categories are organized along the vertical axes and values along the horizontal axes. Vertical bar graphs are useful for showing data changes over a period of time or for illustrating comparisons among items. In these vertical bar graphs, categories are typically organized along the horizontal axes and values along the vertical axes.
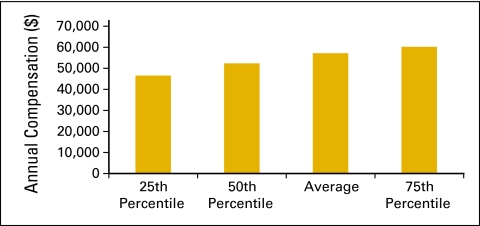
National Practice Benchmark data are generally presented in vertical bar graphs using 25th percentile, 50th percentile (or median), average, and 75th percentile. When interpreting this data, remember that a percentile is a point on a scale below which a certain percent of responses fall. For example, the 75th percentile is the point in a distribution of data below which 75% of responses fall. Likewise, the 25th percentile is the point below which 25% of responses fall. Note that a percentile may or may not correspond to a value judgment about whether it is good or bad. The interpretation of whether a certain percentile is good or bad depends on the context to which the data apply. In some situations, a low percentile would be considered good—for example, number of days sales are outstanding. In other contexts, a high percentile might be considered good, such as the number of new patients per FTE HemOnc physician.
Results of the National Practice Benchmark are presented here.
Respondent Demographics
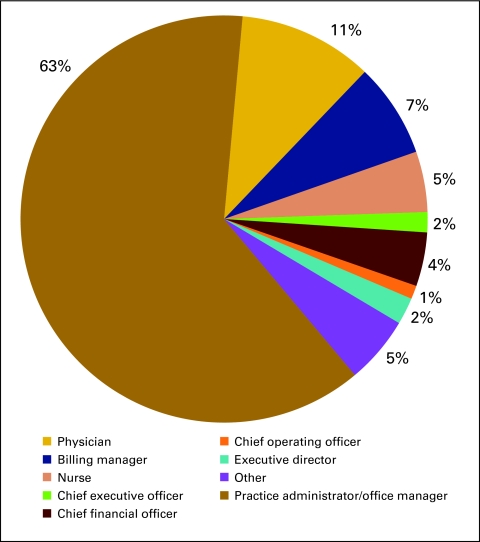
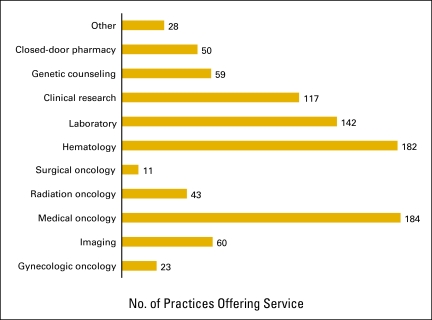
Figures 3 and 4 present general demographics of the practices that responded to the National Practice Benchmark.
Figure 3.
Respondent's role in practice (n = 187 practices).
Figure 4.
Services offered by practice (n = 189 practices).
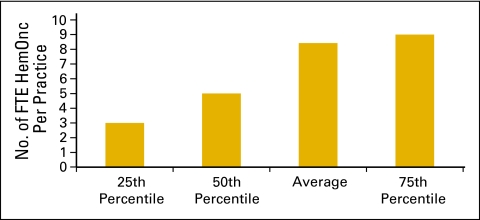
The number of FTE HemOnc physicians per practice is represented in Figure 5. An FTE HemOnc is defined as a physician who spends four full days per week seeing patients in clinic and part of a fifth day on clinic business and who shares call equally with other physicians.
Figure 5.
Number of full-time equivalent (FTE) hematology oncology (HemOnc) physicians per practice (n = 100 practices, 842 HemOnc physicians).
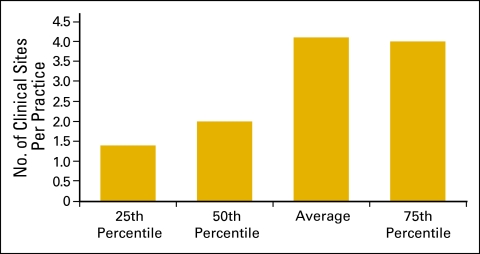
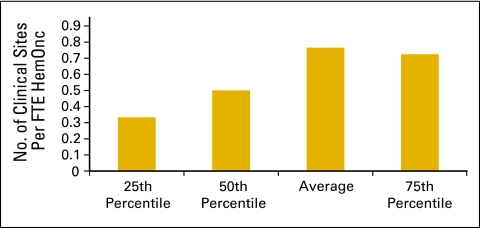
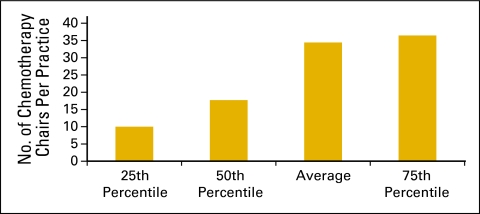
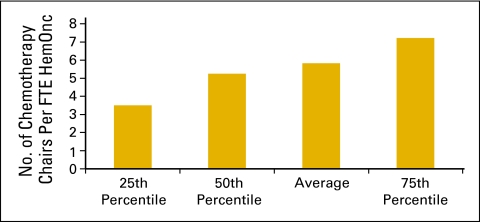
Clinical sites (Figs 6 and 7) and the number of chemotherapy chairs (Figs 8 and 9) were reported on an FTE basis. For example, a clinical site open five days per week is reported as 1.0; a site open three days per week is reported as 0.6. Similarly, a chemotherapy chair used only one day per week is reported as 0.2; a chair that is available every day but was not put in service until July 1 is 0.5.
Figure 6.
Number of clinical sites per practice (n = 169 practices).
Figure 7.
Number of clinical sites per full-time equivalent (FTE) hematology oncology (HemOnc) physician (n = 98 practices, 842 FTE HemOnc physicians).
Figure 8.
Number of chemotherapy chairs per practice (n = 170 practices).
Figure 9.
Number of chemotherapy chairs per full-time equivalent (FTE) hematology oncology (HemOnc) physician (n = 98 practices, 842 FTE HemOnc physicians).
Practice Operations and Planning
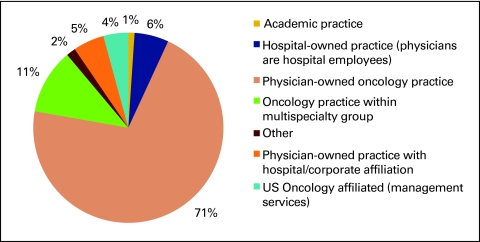
Figure 10 shows practice structure as reported by the survey respondents. Consistent with previous National Practice Benchmark reports, physician-owned oncology practices represent the majority of responding practices, but it is interesting to note that this percentage has decreased from 87% in 2007 to 74% in 2008 and to 71% in 2009. This is consistent with anecdotal reports of changes to practice structure across the country.
Figure 10.
Practice structure (n = 189 practices).
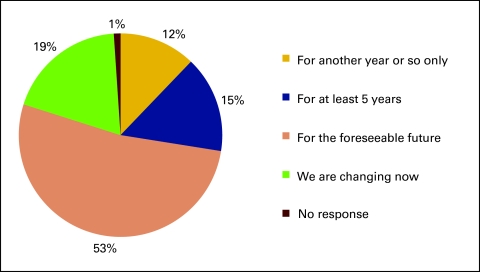
Respondents were also asked how long they expect their current practice structure to remain unchanged and viable, and 31% responded either “for another year or so only” or that their practice structure was changing at the time (Fig 11).
Figure 11.
Responses to survey question “How long do you expect this structure will remain unchanged and/or viable?” (n = 189 practices).
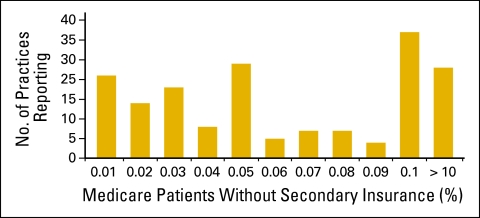
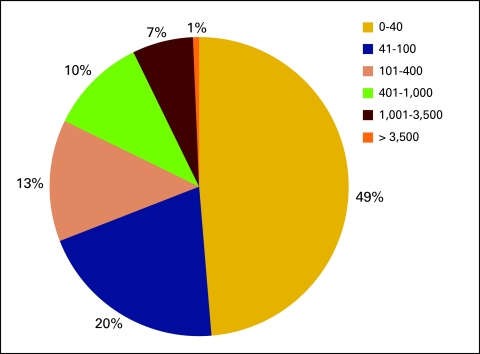
Respondents were asked to indicate the percentage of patients on Medicare in their practice who did not have secondary insurance coverage (Fig 12). They were instructed to provide an estimate if the actual number was not available. More than 50 practices (of 163) indicated that 10% or more of their patients on Medicare did not have secondary insurance coverage. In addition, 30% of respondents reported referring more than 100 chemotherapy visits outside of the office in 2009 for financial reasons (Fig 13).
Figure 12.
Percentage of Medicare patients in practice without secondary insurance coverage (n = 163 practices).
Figure 13.
Number of chemotherapy visits referred outside of the practice for financial reasons (n = 152 practices).
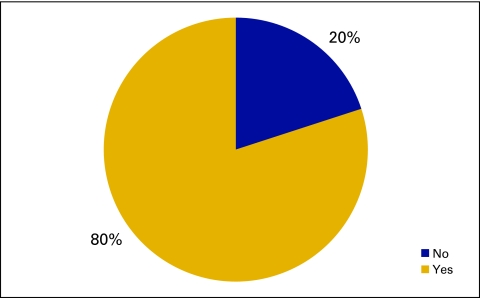
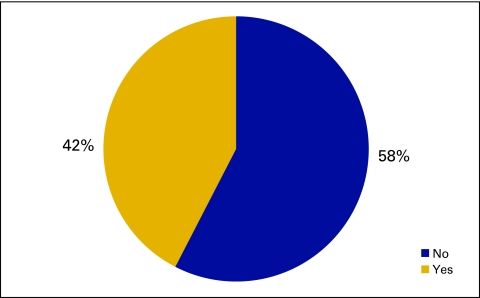
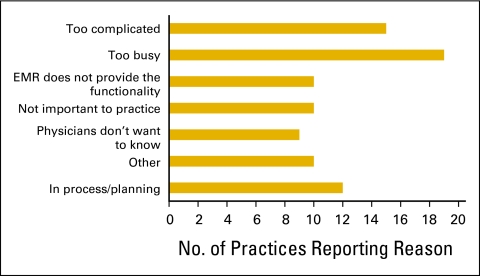
Practices were also asked to indicate use of practice guidelines and clinical pathways in patient care (Fig 14) along with compliance (Fig 15) and reasons for not measuring compliance (Fig 16).
Figure 14.
Responses to survey question “Do practice physicians regularly use practice guidelines or clinical pathways in patient care?” (n = 100 practices).
Figure 15.
Responses to survey question “Do you routinely measure physician compliance with pathways or guidelines?” (n = 99 practices).
Figure 16.
Reasons given for not measuring compliance with pathways or guidelines (n = 85 practices). EMR, electronic medical record.
Information Systems
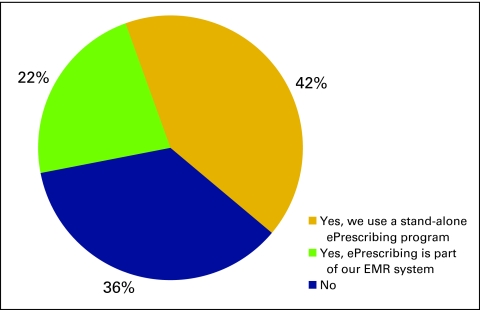
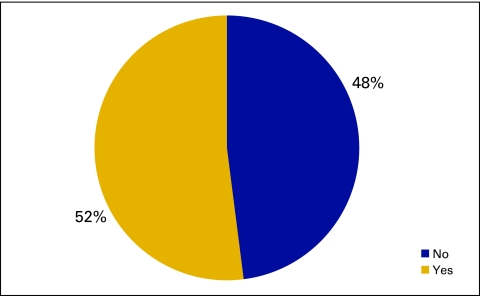
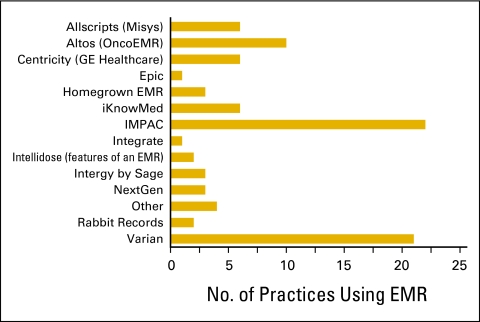
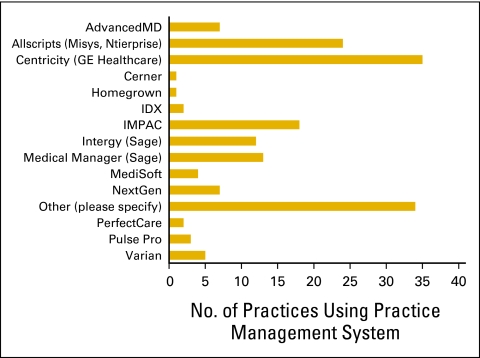
The National Practice Benchmark survey requested information about information systems used by practices, particularly use of an ePrescribing system (Fig 17), an electronic medical record system (Figs 18 and 19), or a practice management system (Fig 20).
Figure 17.
Responses to survey question “Do you generate prescriptions using an ePrescribing system?” (n = 173 practices). EMR, electronic medical record.
Figure 18.
Responses to survey question “Does your practice use an electronic medical record system?” (n = 173 practices).
Figure 19.
Electronic medical record (EMR) system used by survey respondents (n = 90 practices).
Figure 20.
Practice management systems used by survey respondents (n = 168 practices).
Level 1 Quantitative Benchmarks
As we described in the introduction, reporting on quantitative benchmarks was limited to practices that submitted the minimum data elements:
number of FTE HemOnc physicians
total revenue
COGPF
number of consultations and new patients at the office
number of consultations at the hospital
Exclusion criteria were then applied to the reported data to ensure the validity of the responses. Criteria used to exclude practices included reporting:
higher drug revenue than total revenue
higher COGPF than total revenue
drug revenue less than 0.5% or greater than 1.5% of COGPF
A total of 65 practices with 556 FTE HemOnc physicians met these criteria and are included in the level 1 analysis. Additional exclusions were applied to specific benchmarks for data outside the range of credible results.
HemOnc Productivity
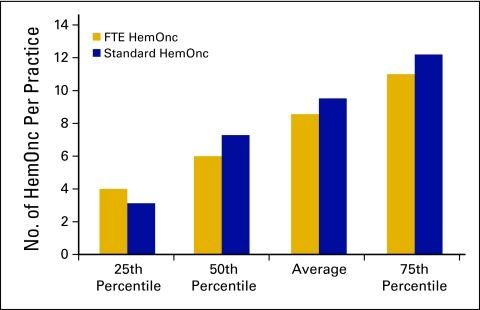
An FTE HemOnc physician is defined as a physician who spends 4 full days per week in clinic seeing patients and part of a fifth day on clinic business and who shares call equally with other physicians. A standard HemOnc physician is defined as a physician who sees 350 new patients (new patients and consultations, both in office and in the hospital) in a 12-month period. The number of HemOnc physicians reported per practice is shown in Figure 21.
Figure 21.
Number of hematology oncology (HemOnc) physicians per practice (n = 65 practices, 556 full-time equivalent [FTE] HemOnc physicians).
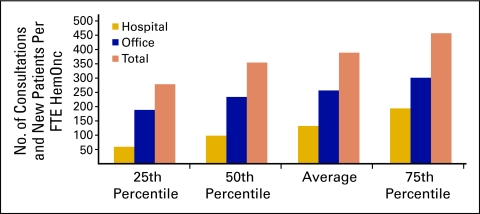
New patient flow into a practice is an important measure of demand for services and is used to assess the productivity of the practice. This is essential for strategic planning. Dividing the number of new patients (demand) by the number of physicians (supply) produces a measure of physician productivity (Fig 22). Practices reported the number of procedure codes for hospital consultations, office consultations, and new patients in the office for the 12-month period. Procedure codes were totaled and then divided by the number of reported FTE HemOnc physicians; this was reported as the number of new patients per FTE HemOnc. The average for 2009 was 389 new patients per FTE HemOnc, which is up slightly from 378 in 2008. It is interesting to note that approximately two thirds of the consultation and new patient visits took place in the office setting.
Figure 22.
Consultation and new patient codes per full-time equivalent (FTE) hematology oncology (HemOnc) physician (n = 65 practices, 556 FTE HemOnc physicians).
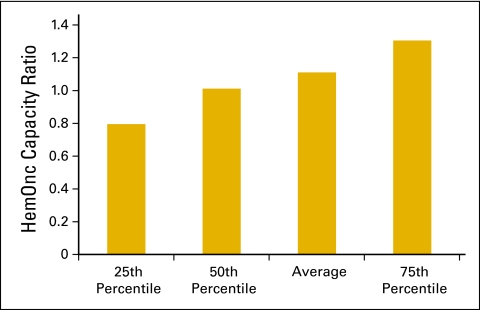
The HemOnc capacity ratio (Fig 23) shows the productivity capacity of the HemOnc physicians in the practice to see more new patients and have more consultations in addition to their current workload. The HemOnc capacity ratio is calculated by using 350 new patients and consultations per year as the denominator and the actual number of new patients and consultations as the numerator. A ratio significantly lower than 1 indicates capacity to see more new patients to use the existing HemOnc physicians to their fullest capacity. Near 1 means the HemOnc physicians are working near or at full capacity and growth in new patients and consultations will require nonphysician practitioners or more physicians
Figure 23.
Hematology oncology (HemOnc) physician capacity ratio per practice (n = 65 practices, 556 full-time equivalent HemOnc physicans).
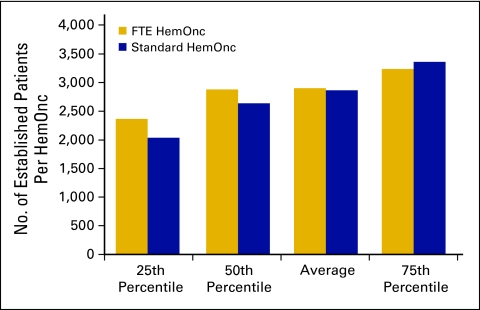
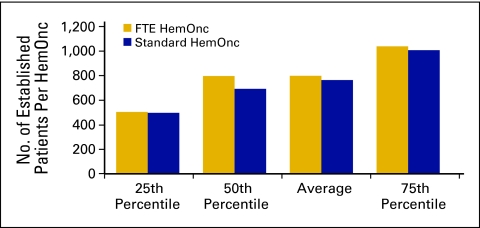
Another important measure of productivity is the number of established patient visits per FTE HemOnc. The average number of established office patient visits (Current Procedural Terminology [CPT] codes 99212 to 99215) was 2,904 (Fig 24); the average number of established patient hospital visits (CPT codes 99217 to 99220, 99221 to 99223, 99234 to 99236, and 99238 to 99239) was 800 (Fig 25). It should be noted that these numbers include services rendered by nonphysician practitioners and billed incident to a physician service.
Figure 24.
Number of established patients seen in the office per hematology oncology (HemOnc) physician (n = 65 practices, 556 full-time equivalent [FTE] HemOnc physicians).
Figure 25.
Number of established patients seen in the hospital per hematology oncology (HemOnc) physician (n = 65 practices, 556 full-time equivalent [FTE] HemOnc physicians).
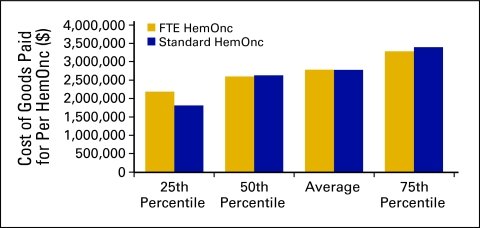
COGPF
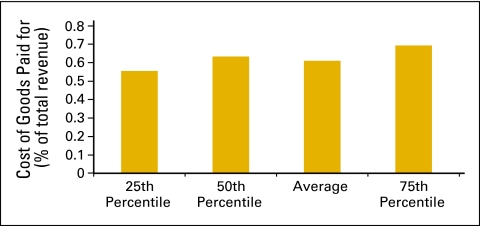
COGPF is defined as the total of all money paid for drugs in the period less rebates or other cost reductions received in the same period. COGPF data were analyzed as amount per HemOnc (Fig 26) and as a percent of total revenue (Fig 27).
Figure 26.
Cost of goods paid for per hematology oncology (HemOnc) physician (n = 65 practices, 556 full-time equivalent [FTE] HemOnc physicians).
Figure 27.
Cost of goods paid for as a percentage of total revenue (n = 65 practices, 556 full-time equivalent hematology oncology physicians).
Revenue and Margin
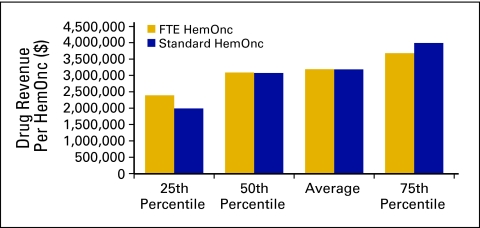
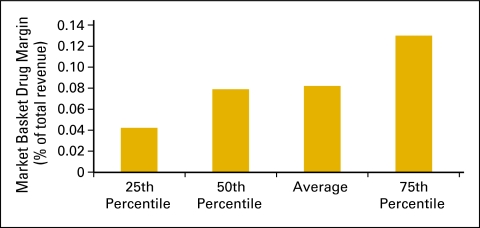
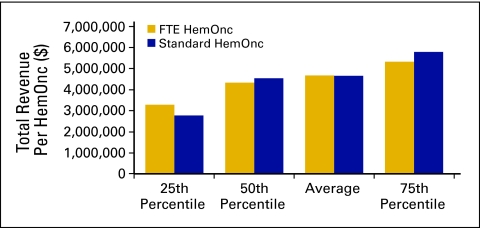
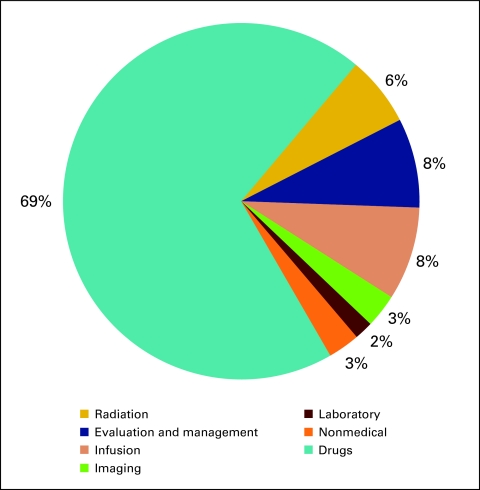
Drug revenue (Fig 28) is defined as the total collected revenue for drugs during the period analyzed. Drug margin is drug revenue less COGPF. Market basket drug margin (Fig 29) is the margin for all drugs and all payers. In 2009, the market basket drug margin was 8% of total revenue. Total revenue (Fig 30) is defined as all collected revenue for the period—medical revenue plus nonmedical revenue such as medical directorships, publication revenue, and so on. Data regarding revenue mix according to service line (Fig 31) were also requested.
Figure 28.
Drug revenue per hematology oncology (HemOnc) physician (n = 65 practices, 556 full-time equivalent [FTE] HemOnc physicians).
Figure 29.
Market basket drug margin as a percentage of total revenue (n = 65 practices, 556 full-time equivalent hematology oncology physicians).
Figure 30.
Total revenue per hematology oncology (HemOnc) physician (n = 65 practices, 556 full-time equivalent [FTE] HemOnc physicians).
Figure 31.
Revenue mix by service line (n = 65 practices, 556 full-time equivalent hematology oncology physicians).
Level 2 Quantitative Benchmarks
Practices that qualified for level 1 benchmarks are also included in the level 2 benchmarks, which include measures of staffing, productivity, closed-door pharmacy use, and inventory.
Staffing and Productivity
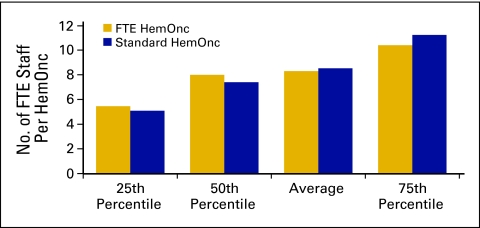
Although total operating expense declined in 2009 (Fig 2), which we believe indicates more efficient practice operations, the number of FTE staff per FTE HemOnc is consistent with that reported in previous years. We define FTE staff as all staff working in the HemOnc line of business for the practice. All staff members are counted, including nonphysician practitioners but not including physicians. Radiation oncology staff and staff working in other lines of business are likewise not included. The average number of FTE staff per FTE HemOnc for 2009 was 8.3 (Fig 32). This compares with 8.7 in 2008 and 8.4 in 2007. Clearly, the overall number of staff is not the focus of practice efficiency measures.
Figure 32.
Full-time equivalent (FTE) staff per hematology oncology (HemOnc) physician (n = 60 practices, 529 FTE HemOnc physicians, 4,723 FTE staff).
In addition to FTE staff, we also collected data on several specific staff categories. Definitions were provided for each staff category. Data on annual compensation for each staff category was also collected and is reported here.
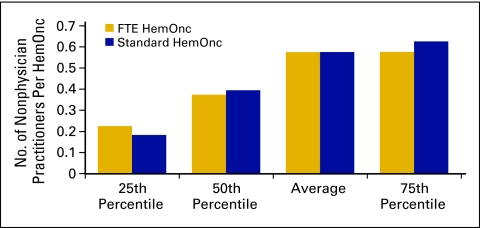
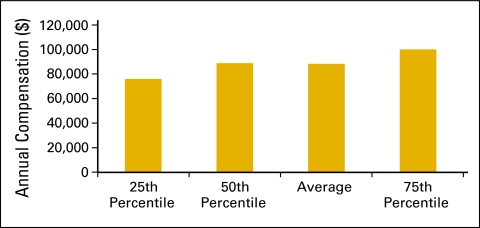
Nonphysician practitioners (Figs 33 and 34) are also known as midlevel providers and include nurse practitioners and physician assistants.
Figure 33.
Number of nonphysician practitioners per hematology oncology (HemOnc) physician (n = 50 practices, 498 full-time equivalent [FTE] HemOnc physicians, 232 FTE nonphysician practitioners).
Figure 34.
Annual compensation per full-time equivalent (FTE) nonphysician practitioner (n = 49 practices, 493 FTE hematology oncology physicians, 229 FTE nonphysician practitioners).
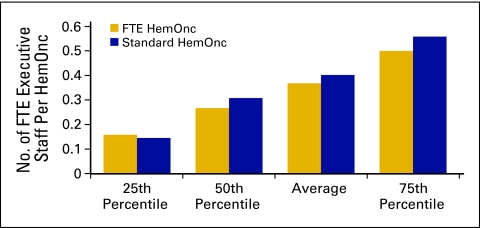
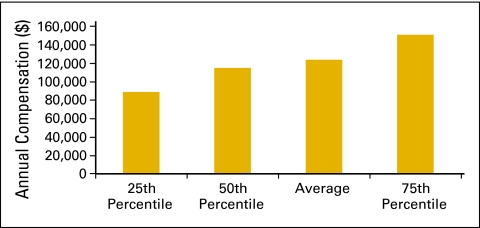
Executive staff (Figs 35 and 36) is defined as all executive and senior management staff and includes all staff who report to the physician executive or the board. This also includes the physician executive. This does not include department-level supervisors. These data are reported on an FTE basis. For example, if the physician executive spends 20% of his/her time on practice management and 80% on patient care, report 0.2 as executive staff and 0.8 in the appropriate physician category.
Figure 35.
Number of full-time equivalent (FTE) executive staff per hematology oncology (HemOnc) physician (n = 59 practices, 533 FTE HemOnc physicans, 174 executive staff).
Figure 36.
Annual compensation per full-time equivalent (FTE) executive staff (n = 57 practices, 511 FTE hematology oncology physicians, 162 FTE executive staff).
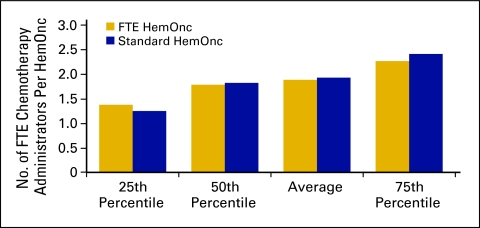
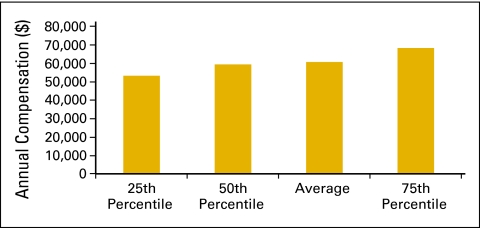
Chemotherapy administration staff (Figs 37 and 38) is defined as all staff responsible for drug purchasing, mixing, delivery to patients, and management of these processes. This staff category includes pharmacy and nursing personnel as well as nonclinical personnel if they are responsible for any of the specified tasks, particularly drug purchasing. Survey respondents were instructed to report the percentage of time all staff spent on these activities. The average number of FTE chemotherapy administration staff per FTE HemOnc for 2009 was 1.9 (Fig 37) and identical to that reported for 2008.
Figure 37.
Number of full-time equivalent (FTE) chemotherapy administration staff per hematology oncology (HemOnc) physician (n = 62 practices, 539 FTE HemOnc physicians, 1,140 FTE chemotherapy administration staff).
Figure 38.
Annual compensation per full-time equivalent (FTE) chemotherapy administration staff (n = 62 practices, 527 FTE hematology oncology physicians, 1,118 FTE chemotherapy administration staff).
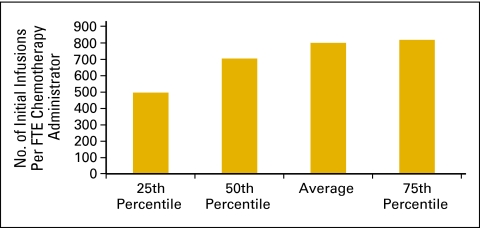
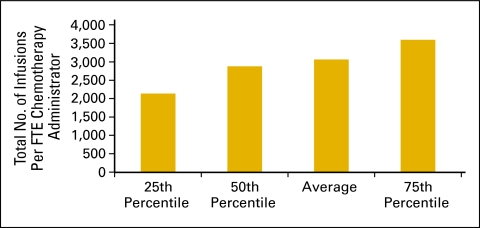
The number of initial infusions per FTE chemotherapy administration staff (Fig 39) and the total number of infusions per FTE chemotherapy administration staff (Fig 40) are productivity measures for the chemotherapy suite. The number of initial infusions (Fig 39) is a surrogate for the number of patients receiving infusion services and is a count of all of the “initial” drug administration codes billed by the practice during the period. This includes initial infusions, initial hydration, and initial intravenous push services. The total number of infusions is a count of all drug administration services provided in the period.
Figure 39.
Number of initial infusions per full-time equivalent (FTE) chemotherapy administration staff (n = 62 practices, 539 FTE hematology oncology physicians, 1,140 FTE chemotherapy administration staff).
Figure 40.
Total number of infusions per full-time equivalent (FTE) chemotherapy administration staff (n = 62 practices, 539 FTE hematology oncology physicians, 1,140 FTE chemotherapy administration staff).
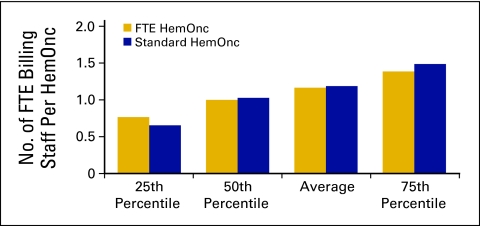
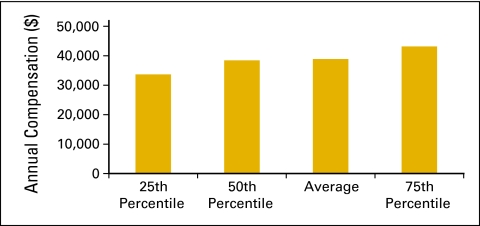
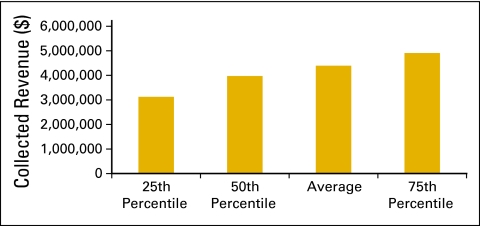
Billing staff (Figs 41 and 42) is defined as all staff in the billing and collecting process in the practice, including charge entry, payment posters, coders, charge integrity staff (scrubbers), and all others involved in the process. This does not include financial counselors/advocates. Collected revenue per FTE billing staff (Fig 43) is a productivity measure for billing staff.
Figure 41.
Number of full-time equivalent (FTE) billing staff per hematology oncology (HemOnc) physician (n = 61 practices, 537 FTE HemOnc physicians, 656 FTE billing staff).
Figure 42.
Annual compensation per full-time equivalent (FTE) billing staff (n = 60 practices, 532 FTE hematology oncology physicians, 651 FTE billing staff).
Figure 43.
Collected revenue per full-time equivalent (FTE) billing staff (n = 61 practices, 537 FTE hematology oncology physicians, 656 FTE billing staff).
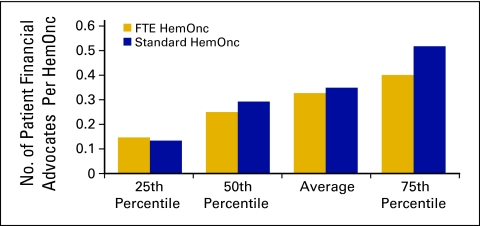
The category of patient financial advocate is a new staffing category that was added to the National Practice Benchmark for 2009 and is defined as all staff in the patient financial advocacy or financial counseling process in the practice. Duties may include estimating treatment costs; patient/family education regarding insurance benefits, limitations, and patient financial responsibility; assisting patients in applying for/obtaining financial and/or drug assistance; and communicating with practice staff about patient financial issues. The average number of patient financial advocate staff was 0.33, with 51 practices reporting (Figs 44 and 45). These staff may have been included as billing staff in previous data collections; the number of FTE billing staff per FTE HemOnc in 2009 was 1.2 (Fig 41), which is a slight decrease compared with the 1.33 reported in 2008.
Figure 44.
Number of patient financial advocates per hematology oncology (HemOnc) physician (n = 51 practices, 493 full-time equivalent [FTE] HemOnc physicians, 186 FTE patient financial advocates).
Figure 45.
Annual compensation per full-time equivalent (FTE) patient financial advocate (n = 51 practices, 493 FTE hematology oncology physicians, 186 FTE patient financial advocates).
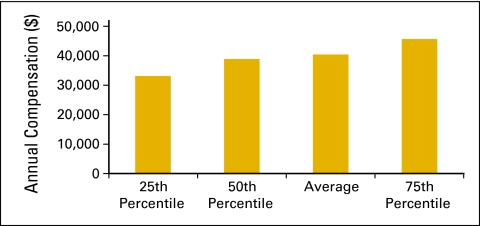
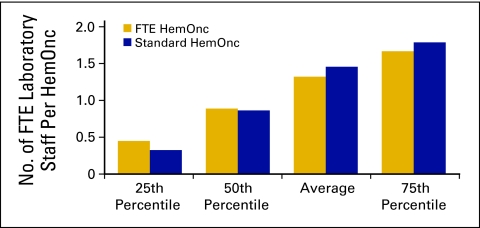
Laboratory staff (Figs 46 and 47) includes all laboratory staff employed by the practice.
Figure 46.
Number of full-time equivalent (FTE) laboratory staff per hematology oncology (HemOnc) physician (n = 48 practices, 398 FTE HemOnc physicians, 326 FTE laboratory staff).
Figure 47.
Annual compensation per full-time equivalent (FTE) laboratory staff (n = 48 practices, 398 FTE hematology oncology physicians, 326 FTE laboratory staff).
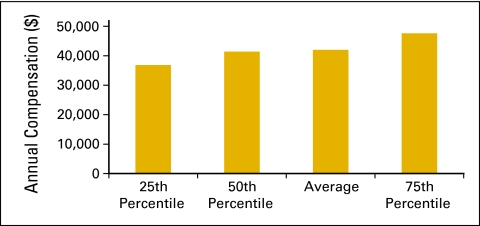
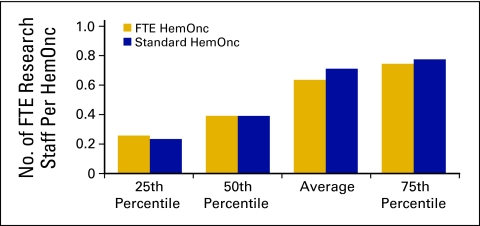
Research staff (Figs 48 and 49) is defined as all staff performing clinical research and research clerical support and is calculated on an FTE basis. Calculations do not include physician research time.
Figure 48.
Number of full-time equivalent (FTE) research staff per hematology oncology (HemOnc) physician (n = 35 practices, 398 FTE HemOnc physicians, 195 FTE research staff).
Figure 49.
Annual compensation per full-time equivalent (FTE) research staff (n = 35 practices, 382 FTE hematology oncology physicians, 190 FTE research staff).
Closed-Door Pharmacy
Another new benchmarking category in 2009 is one for closed-door pharmacies. A closed-door pharmacy is defined as a pharmacy that provides services to patients and employees of the practice but is not available to the public at large. Operation of a closed-door pharmacy is regulated by each state and may not be permitted in some states. Practices are cautioned to fully investigate state laws before considering adding this service line.
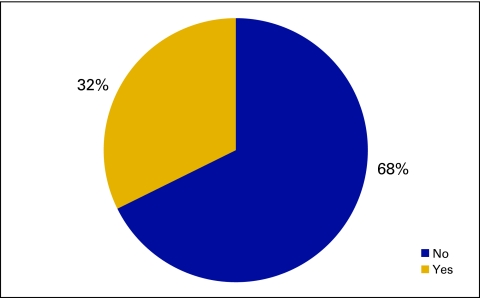
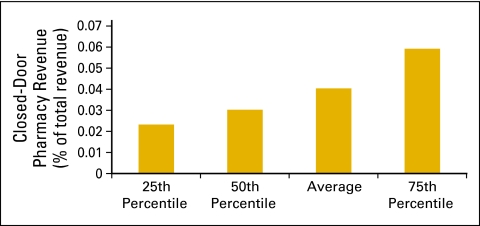
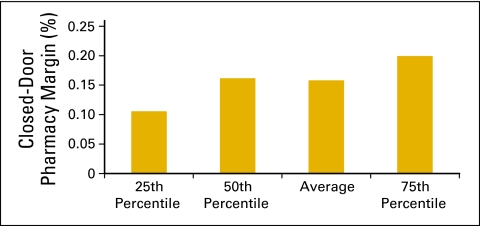
In the qualitative data collected in this survey, 50 practices reported operating a closed-door pharmacy. In the level 1 quantitative data set, 32% or 21 practices report closed-door pharmacies (Fig 50), and 17 practices provided financial data. In this small data set, it appears that practices are able to add some revenue to the practice bottom line through this new line of business (Figs 51 and 52).
Figure 50.
Responses to survey question “Do you have a closed door pharmacy?” (n = 65 practices).
Figure 51.
Closed-door pharmacy revenue as a percentage of total practice revenue (n = 17 practices, 211 full-time equivalent hematology oncology physicians).
Figure 52.
Closed-door pharmacy margin as a percentage of closed-door pharmacy revenue (n = 17 practices, 211 full-time equivalent hematology oncology physicians).
Inventory
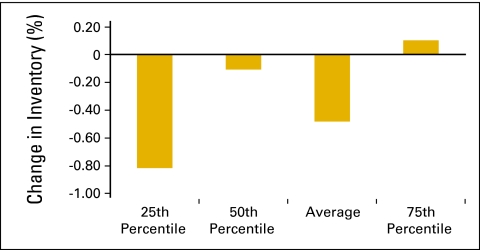
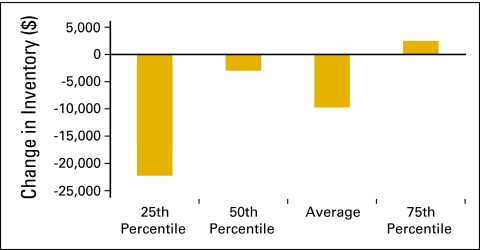
Many practices have made strategic decisions to decrease drug inventory levels because of a variety of payer and reimbursement issues. In the National Practice Benchmark survey, practices were asked to report beginning and ending inventory levels for the 12-month period. With 51 practices reporting, Figure 53 shows the change in inventory as a percentage of COGPF for the 12-month period. Practices have been successful in decreasing inventory (Figs 53 and 54). This frees up capital that was formerly invested in pharmacy inventory and demonstrates an increase in the efficient use of capital rather than an increase in productive capacity.
Figure 53.
Change in inventory as a percentage of cost of goods paid for (n = 51 practices).
Figure 54.
Change in inventory dollars per standard hematology oncology (HemOnc) physician (n = 51 practices, 538 standard HemOnc physicians).
Accounts Receivable
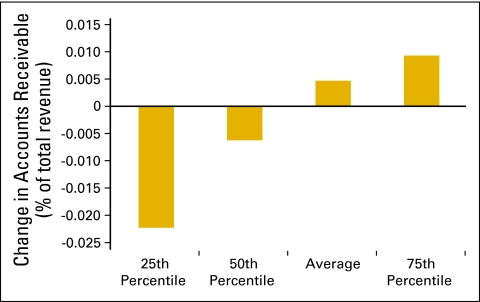
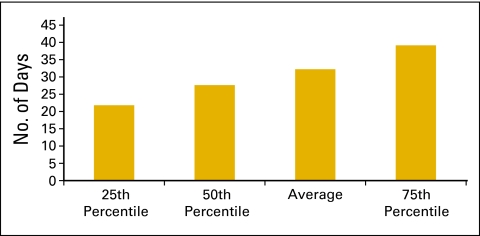
Figure 55 shows the average change in accounts receivable as a percentage of total revenue and is based on data collected from 62 practices. Another important metric for managing any business is days sales outstanding. This is the time that it takes to collect from various payers (and patients) for services that have already been provided. Days sales outstanding is calculated by dividing net accounts receivable by average collections per business day. Net accounts receivable is the total accounts receivable on the books of the practice after subtracting the yet-to-be-applied contractual allowances that are due to those accounts and an allowance for some bad debt. For this calculation, we used 254 business days per year, and 60 practices are included in the data set. The average number of business days sales outstanding for 2009 was 32 (Fig 56).
Figure 55.
Change in accounts receivable as a percentage of total revenue (n = 62 practices).
Figure 56.
Number of business days sales outstanding (n = 60 practices).
Summary
Across the country, there are many examples of oncology practices struggling financially, merging with other organizations, and even closing, but we believe the data presented here indicate that the business operation of oncology practice is becoming more mature, more efficient, and more self-aware. This is evidenced by the improvement in several of the metrics presented here and, to a small extent, by the number of survey participants who were willing to share information and the quality of data that they were able to provide. This indicates a broader understanding of the use and importance of peer-to-peer benchmarking. Several years ago, we introduced the concept of a standard HemOnc and defined it as a medical oncology or HemOnc physician who sees 350 new patients per year. At the time when we proposed that convention, there were many who considered 350 an extremely high number. In this survey, that standard has risen to 389—quite a remarkable gain in productivity. Knowledge of objective standards drives gains in productivity in an environment in which such gains are rewarded.
Just as computerized practice management systems have streamlined the processing and measurement of billing and collection operations, so too will the adoption of electronic medical records allow for similar improvements in other aspects of the oncology practice. Health care reform seeks to promote measurement of clinical activity—the way similar patients are treated and the outcomes of that treatment. When we are able to report clinical benchmarks, we can reasonably expect gains in quality and efficiency. Then we will be truly advancing our abilities to take care of individual patients and sustaining our economic capacity to take better care of more people living with cancer.
The 2011 National Practice Benchmark survey (on 2010 data) opened in February, and findings will be published later this year. For additional information about the National Practice Benchmark, please e-mail info@oncomet.com.
Acknowledgment
We thank those who participated in the 2010 survey and enabled us to produce this work.
Authors' Disclosures of Potential Conflicts of Interest
Although all authors completed the disclosure declaration, the following author(s) indicated a financial or other interest that is relevant to the subject matter under consideration in this article. Certain relationships marked with a “U” are those for which no compensation was received; those relationships marked with a “C” were compensated. For a detailed description of the disclosure categories, or for more information about ASCO's conflict of interest policy, please refer to the Author Disclosure Declaration and the Disclosures of Potential Conflicts of Interest section in Information for Contributors.
Employment or Leadership Position: Thomas R. Barr, Oncology Metrics, a division of Altos Solutions (C); Elaine L. Towle, Oncology Metrics, a division of Altos Solutions (C) Consultant or Advisory Role: None Stock Ownership: None Honoraria: None Research Funding: None Expert Testimony: None Other Remuneration: None
Author Contributions
Conception and design: Thomas R. Barr, Elaine L. Towle
Administrative support: Thomas R. Barr, Elaine L. Towle
Collection and assembly of data: Thomas R. Barr, Elaine L. Towle
Data analysis and interpretation: Thomas R. Barr, Elaine L. Towle
Manuscript writing: Thomas R. Barr, Elaine L. Towle
Final approval of manuscript: Thomas R. Barr, Elaine L. Towle
References
- 1.Medical Group Management Association. Englewood, CO: Medical Group Management Association; 2001. Cost survey for Hematology/Oncology Practices: 2001 Report Based on 2000 Data. [Google Scholar]
- 2.Medical Group Management Association. Englewood, CO: Medical Group Management Association; 2003. Cost Survey for Hematology/Oncology Practices: 2003 Report Based on 2002 Data. [Google Scholar]
- 3.Medical Group Management Association. Englewood, CO: Medical Group Management Association; 2004. Cost Survey for Hematology/Oncology Practices: 2004 Report Based on 2003 Data. [Google Scholar]
- 4.Akscin J, Barr TR, Towle EL. Benchmarking practice operations: Results from a survey of office-based oncology practices. J Oncol Pract. 2007;3:9–12. doi: 10.1200/JOP.0712504. [DOI] [PMC free article] [PubMed] [Google Scholar]
- 5.Akscin J, Barr TR, Towle EL. Key practice indicators in office-based oncology practices: 2007 report on 2006 data. J Oncol Pract. 2007;3:200–203. doi: 10.1200/JOP.0743001. [DOI] [PMC free article] [PubMed] [Google Scholar]
- 6.Barr TR, Towle EL, Jordan WM. The 2007 national practice benchmark: Results of a national survey of oncology practices. J Oncol Pract. 2008;4:178–183. doi: 10.1200/JOP.0843501. [DOI] [PMC free article] [PubMed] [Google Scholar]
- 7.Towle EL, Barr TR. 2009 national practice benchmark: Report on 2008 data. J Oncol Pract. 2009;5:223–227. doi: 10.1200/JOP.091017. [DOI] [PMC free article] [PubMed] [Google Scholar]
- 8.Towle EL, Barr TR. National practice benchmark: 2010 report on 2009 data. J Oncol Pract. 2010;6:228–231. doi: 10.1200/JOP.000121. [DOI] [PMC free article] [PubMed] [Google Scholar]
- 9.Practice efficiency and practice quality. Flip sides of the same coin. J Oncol Pract. 2008;4:90–93. doi: 10.1200/JOP.0826501. [DOI] [PMC free article] [PubMed] [Google Scholar]


