Abstract
Background
The prototypical intracranial pressure (ICP) pulse morphology has been well known to be triphasic. Several studies suggest that the morphology of ICP pulse reflects the physiological and pathophysiological conditions of the intracranial dynamics. Recently, there has been a renaissance of studying ICP pulse using new ICP signal processing technologies in various clinical contexts. Cerebral blood flow velocity (CBFV) pulse is another important pulsatile signal originated from the complex circulatory systems of cerebral blood flow. However, CBFV pulse morphology has not been well studied mainly due to the noise level and lack of signal processing techniques.
Methods
Our group recently developed a technique called the Morphological Clustering and Analysis of Intracranial Pressure (MOCAIP) that can extract a comprehensive set of pulse morphological metrics. We extend this algorithm to extract various morphological metrics from ICP and CBFV pulses that were simultaneously recorded from 47 brain injury patients and investigate the mutual correlation between those metrics utilizing the robust percentage bend correlation analysis.
Results
Our results show that CBFV pulses are also triphasic as ICP pulses and 15.2% of 128 pulse morphological metrics extracted from ICP and CBFV pulses are highly correlated (p<0.01) in an inter-subject fashion. In addition, mean ICP does not correlate (p=0.45) with the pulsatility index of CBFV pulses but correlates (p<0.05) with several novel CBFV pulse morphological metrics such as the time interval between the onset of CBFV pulses and ECG QRS peak.
Conclusions
Our results suggest that characterizing CBFV pulse morphology is clinically important because it may offer a potential noninvasive alternative to assess various aspects of ICP such as mean ICP.
Index Terms: Cerebral Blood Flow Velocity (CBFV), Intracranial Pressure (ICP), Morphological Clustering and Analysis of Intracranial Pressure (MOCAIP), Spearman correlation coefficient, Transcranial Doppler (TCD)
I. INTRODUCTION
The phenomenon that an intracranial pressure (ICP) pulse is triphasic is widely known in the neurosurgical literature where various peak configurations are associated with clinical interpretations [1]–[3]. Although the origin of the ICP waveform is complex and multi-factorial, it is clearly a function of the intracranial arterial input [4]. Several studies suggest that the morphology of ICP pulse reflects the physiological and pathophysiological conditions of the intracranial dynamics [5]–[8]. More recently, there has been a renaissance of studying ICP pulse using new ICP signal processing technologies in various clinical contexts. For example, a single parameter termed wave amplitude of ICP pulse can be extracted by an approach described in [9] and have been primarily shown to be a good predictor of shunt response for normal pressure hydrocephalus patients [10], [11]. The ratio of the amplitudes between the first and second peaks of ICP was investigated in [12], [13] for its potential as an indicator of cerebral compensatory reservoir. Balestreri et al. showed that indices of cerebrovascular reactivity (PRx) and cerebrospinal compensatory reserve (RAP) derived from the slow waves of ABP and ICP could be used to differentiate between death and favorable outcome in patients with brain trauma [5]. Instead of one or two metrics, our group has recently developed a technique called the Morphological Clustering and Analysis of Intracranial Pressure (MOCAIP) [14] that can be used to extract a comprehensive set of pulse morphological metrics (n = 128). The MOCAIP is a fully automated pulse morphology analysis method, which is capable of enhancing ICP signal quality, recognizing artifact-free ICP pulses, and optimally assigning three distinct peaks in ICP pulses. Besides further methodological development of the MOCAIP algorithm [15], [16], we have demonstrated various clinical applications of MOCAIP, especially in Neurocritical care field. For example, in [17], it has been shown that the peak ratio metrics extracted from long-term continuous ICP recordings could serve as the predictive indicator of the ventriculomegaly development. In [18], the occurrence of acute ICP elevation could be predicted 5 min in advance with a specificity of 99% and a sensitivity of 51% using an optimal subset of the MOCAIP metrics. In [19] a new automatic method was proposed to distinguish ICP slow waves (B-waves) from flat ICP recordings in an overnight ICP recording utilizing the changes in ICP MOCAIP metrics. The results showed that the changes in six MOCAIP metrics were sufficient to detect ICP slow waves (B-waves) with high specificity (96.2%) and fair accuracy (88.9%). In [20] it has been demonstrated that low cerebral blood flow (< 20 ml/min/100g) could be detected accurately (sensitivity: 92.5%, specificity: 84.8%) using the MOCAIP metrics of ICP pulses.
ICP pulse is just one of many kinds of pulsatile signals originated from the complex circulatory systems of cerebrospinal fluid and cerebral blood flow. Interesting questions therefore arise with regard to whether other intracranial pulsatile signals have triphasic shape and whether useful information can be derived from their pulse morphologies. As far as we know, answers to these questions remain elusive. We have recently made a discovery that cerebral blood flow velocity (CBFV) pulse as recorded in the middle cerebral arteries can be processed by the MOCAIP algorithm even though the algorithm was originally designed for the ICP pulse. In [21] we briefly reported that most CBFV pulses, from a cohort of 47 brain injury patients under neurocritical care, indeed have a triphasic shape similar to that of ICP pulses and the mutual correlation between ICP and CBFV pulse morphological metrics exists. In the current work, we present a more complete study of investigating the mutual correlation between ICP and CBFV pulse morphological metrics and its clinical implications.
Characterizing CBFV pulse morphology is clinically significant besides the apparent scientific value. In addition to its established clinical roles [22]–[24], CBFV offers a potential noninvasive alternative to interrogate intracranial pathophysiology as evidenced in many existing efforts at using CBFV and other related signals for noninvasive assessment of ICP [25]–[32]. However, there is a paucity of clinical practice of these methods, mainly because the accuracy has yet to meet clinical requirement. Therefore, this line of study could be significantly advanced by integrating a whole array of novel morphological metrics extractable from CBFV pulses, especially considering that prevailing CBFV metrics include only simple ones such as maximum velocity (Vmax), diastolic velocity (Vmin), mean flow velocity (MFV), pulsatility index (PI), and resistance index (RI). Although PI and RI are independent of the insonation angle [33], it is still controversial whether PI and RI can offer reliable and accurate information about ICP with positive supporting publications [25], [26], [30] and negative findings [34], [35].
II. MATERIALS AND METHODS
A. Materials
ICP and CBFV signals along with ECG were recorded simultaneously from 47 brain injury patients admitted to Ronald Reagan UCLA Medical Center between July 2008 and November 2009. ICP signals were obtained from ventriculostomy catheterization and CBFV signals were recorded at the middle cerebral artery (MCA) as part of daily clinical bedside assessment of patients’ cerebral hemodynamics by technicians of with the Cerebral Blood Flow laboratory at UCLA Department of Neurosurgery. A total of 90 recordings were collected from 47 patients, some of whom had assessments on multiple days. The typical duration of each recording was 2–3 minutes while 9 recordings lasted for 16–30 minutes. While the daily assessment of CBFV was done, an effort was made to acquire these signals through an analog connection from the bedside monitor to a 16-port amplifier from ADInstrument and the signals were sampled at 400 Hz to build a signal archive.
The patient age range was from 18 to 89 with the average age 46 (±20 standard deviation). Among 47 patients, 35 were males and 12 females. There were 29 traumatic brain injury (TBI) patients, 15 subarachnoid hemorrhage (SAH) patients, 2 intraparenchymal hematoma patients, and 1 normal pressure hydrocephalus (NPH) patient. The number of post-injury days prior to the first ICP recording ranged from 1 to 12 with the average 4.5 days (±3.2). The mean value of the first ICP recording ranged from 3.5 mmHg to 27.3 mmHg with the average 13.2 mmHg (±5). Finally, 12 out of 47 patients had an unfavorable outcome due to death.
This study was approved by the local Institutional Review Board (IRB) as a retrospective data analysis project of this signal archive and thus a waiver of patient consent was granted.
B. MOCAIP Metrics Extraction
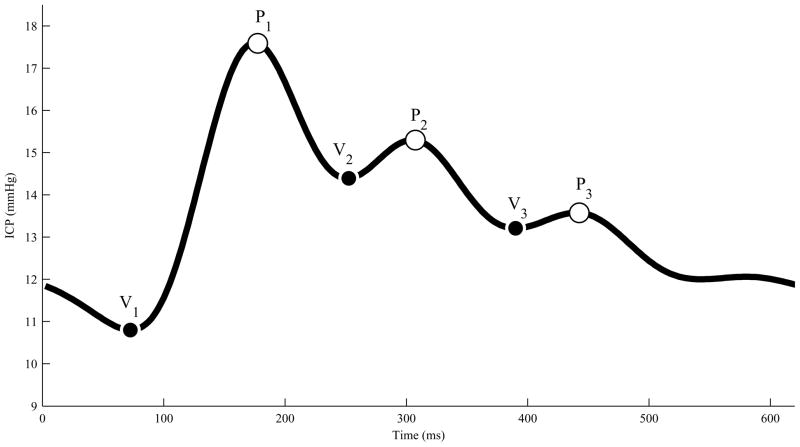
Fig. 1 illustrates a typical ICP pulse with six landmarks (3 peaks and 3 valley points). The MOCAIP first recognizes valid ICP pulses by using a reference library of pre-judged ICP pulses. It then assigns three distinct peaks in those pulses. The valley points are assigned as the lowest local minimum points between the peaks. The first valley point (V1) is the local minimum point between the first peak (P1) and the beginning of the pulse, which is the QRS peak position. The details of the MOCAIP algorithm can be found in [14].
Fig. 1.
A typical ICP pulse with six landmarks that are detected by the MOCAIP.
The MOCAIP algorithm was originally developed to extract useful morphological features from ICP pulses. However, we successfully applied it to CBFV pulses because the morphology of CBFV pulses is similar to that of ICP pulses. This means that the recognition and assignment of the three peaks for CBFV pulses can even utilize the original reference library of validated ICP pulses.
From the six landmarks identified on a pulse, a total of 128 morphological metrics can be derived, which are listed in Table I. These metrics were calculated in a systematic way so that it comprehensively quantifies the pulse morphology. There are 28 basic metrics that quantify the amplitude of each land marks, their curvatures, the time intervals among them, and the slopes of the ascending and descending edges linking them. In addition, traditional metrics including mean, diastolic, and wave amplitude were included. In addition to these basic metrics expressed in absolute scales, ratios among the metrics from the same category are formed that results in additional 100 metrics.
TABLE I.
LIST OF 128 MOCAIP METRICS.
| Symbol | Description | |
|---|---|---|
| 28 basic metrics | dV1, dV2, dV3, dP1, dP2, dP3 | Amplitude of landmarks from the minimum point |
| LV1P1, LV1P2, LV1P3, LV2P2, LV3P3 | Time delay (latency) among landmarks | |
| CurvV1, CurvV2, …, CurvP3 | Absolute curvature of landmarks | |
| K1, K2, K3 | Slope of each rising edge | |
| RC1, RC2, RC3 | Time-constants of each descending edge | |
| mICP, diasICP | Mean ICP and diastolic ICP | |
| LT | Time delay between V1 and ECG QRS peak | |
| mCurv | Mean absolute curvature of the pulse | |
| WaveAmp | Maximum among dP1, dP2, and dP3 | |
| 100 extended metrics | dP1/dP2, …, dV2/dV3 | Ratio among landmark amplitudes |
| LP1P2/LP1P3, …, LV2P2/LV3P3 | Ratio among time delays | |
| CurvP1/CurvP2, …, CurvV2/CurvV3 | Ratio among curvatures | |
| K1/RC1, …, K3/RC3 | Ratio among slopes and RCs | |
We applied the MOCAIP to 90 recordings of simultaneously obtained ICP and CBFV signals and extracted 128 morphological metrics from a dominant pulse, that is representative of each 1-minute segment. For example, if the duration of one recording is 3 min, we extract three sets of 128 MOCAIP metrics from ICP and another three sets from CBFV.
C. Robust Percentage Bend Correlation Analysis
The conventional Pearson’s correlation coefficient, ρ, is not robust or resistant to outliers since all observations make the same contribution to determination of the coefficient. Several robust analogues such as Kendall’s tau, Spearman’s rho, the Winsorized correlation, and the percentage bend correlation have been proposed to test the association between two measured quantities [36]. Among them, the percentage bend correlation coefficient, γpb, provides a simple test to determine the statistical independence between two variables. We adopted this percentage bend correlation coefficient, γpb, to examine a relationship between the MOCAIP metrics of ICP and CBFV signals where there are many outliers and the Gaussian assumption does not hold. The percentage bend correlation coefficient, γpb, can be computed as follows,
| (1) |
| (2) |
| (3) |
| (4) |
where Ψ(·) is a linear limiting function with −1 and +1 boundaries and Xi and Yi represent the i th patient’s MOCAIP metric measurements of ICP and CBFV signals, respectively. Two parameters, φpb and ω., need to be estimated from the measurements. Typically, a single iteration in the Newton-Raphson method yields a reasonable estimate of φpbx, which can be expressed as,
| (5) |
| (6) |
where i1 represents the number of Xi for which (Xi − θ)/ω̂x < −1, i2 represents the number of Xi for which (Xi − θ)/ω̂x > 1, and ω̂x is a quantity which can be easily calculated according to the order statistics derived from Xi. The parameter θ represents the sample median. More details about the percentage bend correlation can be found in [36], [37]. Before applying the percentage bend correlation method to our measurements, a multiple measurement issue needs to be addressed. We have 90 measurements from 47 patients, which means that some patients contribute multiple measurements. Therefore, unless extra care is taken, the percentage bend correlation between these measurements could be inaccurate since multiple measurements from a single patient tend to cluster and are not independent of one another. Whenever multiple measurements were obtained from a single patient, we chose a median value of those multiple measurements to obtain more robust and resistant correlation analysis results.
Statistical computations were conducted in R version 2.11.1 [38] with robust function from the R package WRS [39].
III. RESULTS
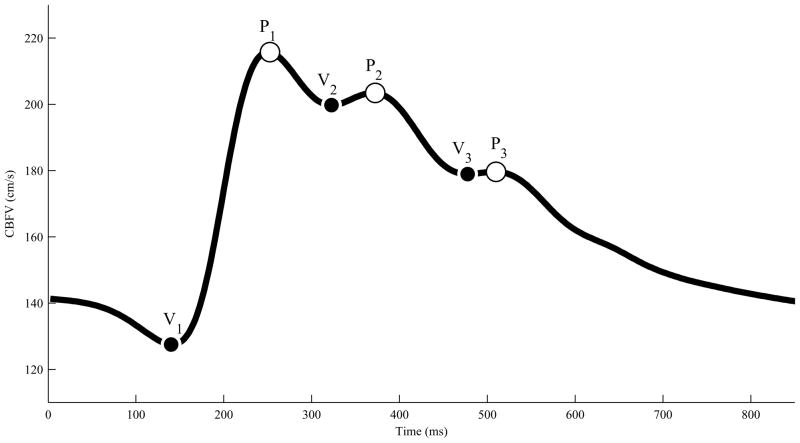
Fig. 2 illustrates a typical CBFV waveform with six landmarks. In most cases, the morphology of CBFV waveforms was similar to what is shown in Fig. 2. As a matter of fact, 45 out of 47 patients had CBFV signals with three peaks. This indicates that the CBFV pulse morphology is indeed triphasic as the ICP pulse morphology. When the MOCAIP is able to detect less than three distinct peaks, it can be considered that missing peaks coincide with detected peaks as explained in [18]. In such cases, however, some of MOCAIP metrics become numerically identical. In the present study, we included only those recordings whose ICP and CBFV are triphasic simultaneously. As a result, 14 out of 90 recordings, that are from 3 patients, had to be removed from our correlation analysis because either ICP (1 recording from 1 patient) or CBFV (13 recordings from 2 patients) did not have three distinct peaks.
Fig. 2.
A typical CBFV waveform with six landmarks that are detected by the MOCAIP.
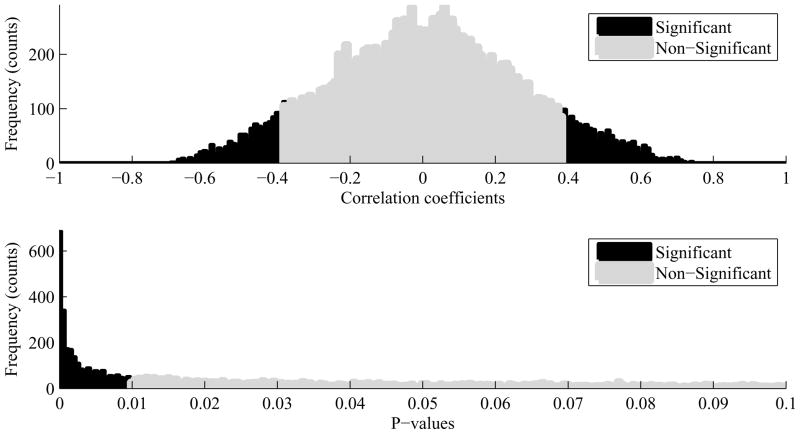
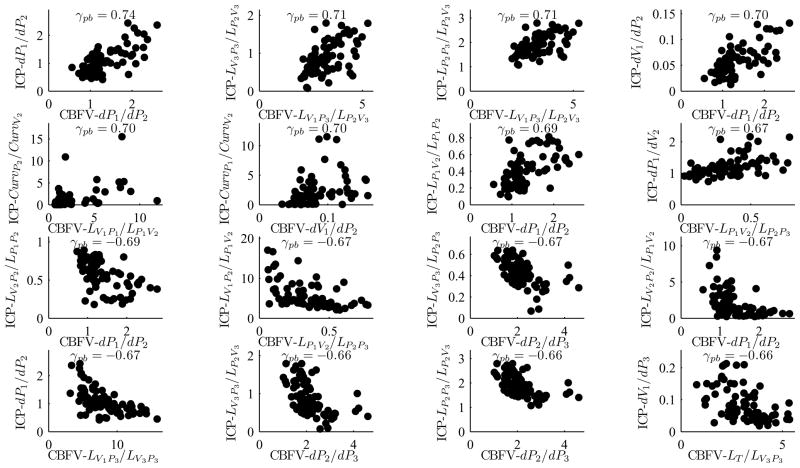
Among a total of 16, 384 (=1282) metric pairs, 2, 494 (=15.2%) pairs were found to be correlated significantly (p < 0.01). Among them 145 pairs had the correlation coefficient whose value was either greater than 0.6 or smaller than −0.6. The top plot in Fig. 3 represents the histogram of correlation coefficients and the bottom plot in Fig. 3 illustrates the histogram of corresponding p-values. Overall, the MOCAIP metrics associated with the first peak (P1) were more significantly correlated than those associated with the third peak (P3) were. Plots in Fig. 4 show top 16 most significantly correlated MOCAIP metric pairs: 8 positively correlated ones (top 2 rows) and 8 negatively correlated ones (bottom 2 rows). The p-values of those metric pairs were virtually 0. It should be noticed that all top 16 metrics were the ratio-based ones.
Fig. 3.
Top: Histogram of 16, 384 correlation coefficients, Bottom: Histogram of corresponding p-values. Black bars are for significant (p < 0.01) correlation coefficients and grey bars for non-significant correlation coefficients.
Fig. 4.
Most significantly correlated MOCAIP metrics pairs of ICP and CBFV signals: 8 positively correlated MOCAIP metrics pairs (top 2 rows) and 8 negatively correlated MOCAIP metrics pairs (bottom 2 rows): All 16 pairs’ correlation coefficients (γpb) are either greater than 0.66 or smaller than −0.66 with p < 0.01.
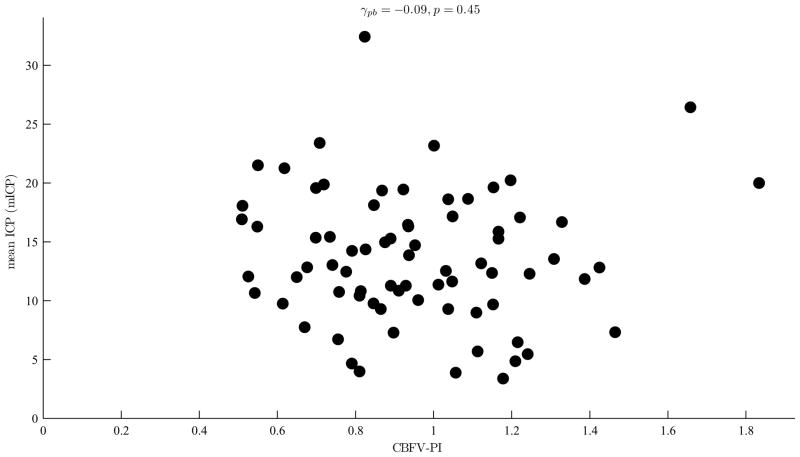
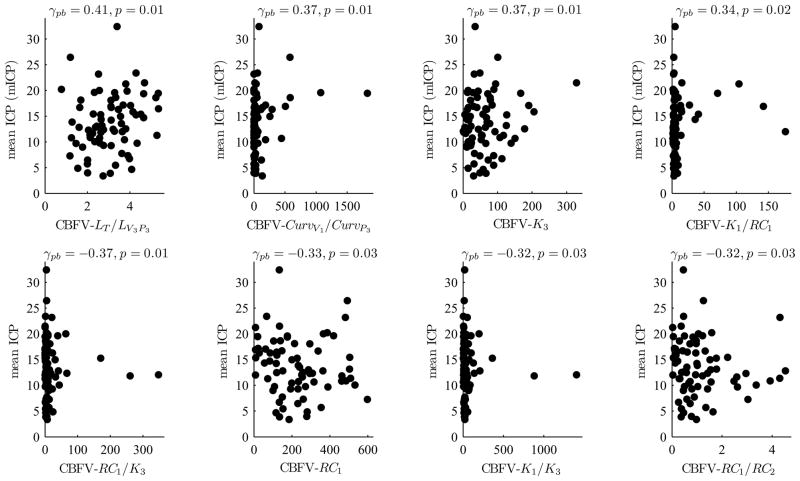
We could not find any significant correlation between the mean ICP and PI of CBFV (γpb=−0.09 and p=0.45) as shown in Fig. 5. However, four CBFV MOCAIP metrics were found to be significantly correlated with the mean ICP with p ≤ 0.01 as shown in Fig. 6 which illustrates scatter plots of eight CBFV MOCAIP metrics that are most significantly correlated with the mean ICP.
Fig. 5.
The mean ICP (mICP) versus pulsatility index (PI) of CBFV: The PI of CBFV is not significantly correlated with the mean ICP (p = 0.45).
Fig. 6.
8 CBFV MOCAIP metrics that are most significantly correlated with the mean ICP: 4 positively correlated CBFV MOCAIP metrics (top row) and 4 negatively correlated CBFV MOCAIP metrics (bottom row).
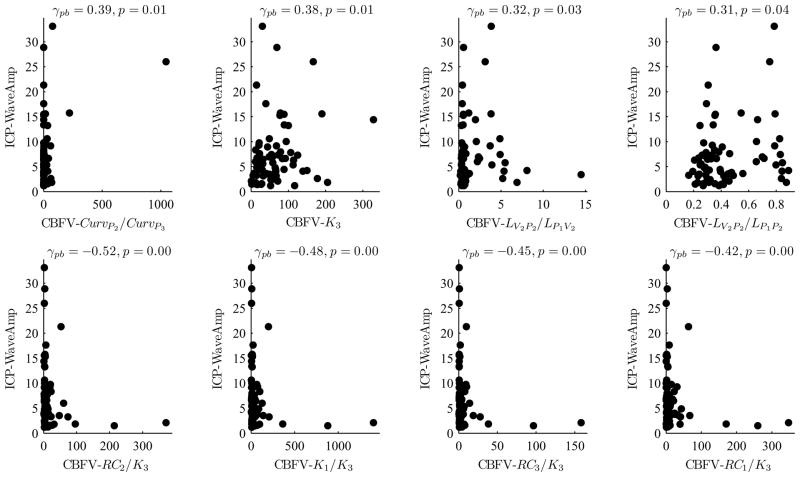
Fig. 7 shows that several CBFV MOCAIP metrics are strongly correlated with the wave amplitude (WaveAmp) of ICP, which has been found to be useful in diagnosing normal pressure hydrocephalus patients. Interestingly, five CBFV metrics (one on the top row and four on the bottom row) were significantly correlated (p ≤ 0.01) with the ICP WaveAmp, where all of them were associated with K3 (the slope of P3).
Fig. 7.
8 CBFV MOCAIP metrics that are most significantly correlated with the wave amplitude (WaveAmp) of ICP: 4 positively correlated CBFV MOCAIP metrics (top row) and 4 negatively correlated CBFV MOCAIP metrics (bottom row).
IV. DISCUSSIONS
A. Correlation between ICP and CBFV Morphological Metrics
It is very interesting to note that the majority of significantly correlated (p<0.01) metric pairs were the ratio-based (extended) ones. Fig. 4 shows 16 most significantly correlated metric pairs. The reason why the correlation between the extended metrics tends to be stronger than that between the basic ones can be explained as that the extended metrics are less susceptible to non-physiological inter-subject variability. For example, one of such inter-subject variability is related to different insonation angles used for different subjects and even for different measurements of the same subject. A supportive example of this argument is that the ratio dP1/dP2 of CBFV waveform is most strongly correlated (γpb=0.74) with that of ICP waveform while the correlation between dP1 of CBFV and ICP waveforms is nearly 0.
The similarity between the ICP and CBFV waveform morphology cannot be easily quantified by a few numbers because the morphology of the waveforms reflects the complex interaction between the intracranial arterial input, intracranial contents, and venous outflow [6]. However, it is very convincing to believe that the ICP and CBFV waveforms are influenced by the intracranial dynamics in a very similar fashion because significant inter-subject correlation (p < 0.01) could be found consistently in many pairs (15.2%) of ICP-CBFV MOCAIP metrics. This may offer a new opportunity for TCD-based noninvasive inferences of pathophysiological conditions of the intracranial dynamics. For example, the ratio dP1/dP2 of ICP waveform has been investigated as a predictor of intracranial adaptive capacity in [13] and as an indicator of acute ventricular dilation in [17]. Since the ratio dP1/dP2 of CBFV waveform is strongly correlated with that of ICP waveform as shown in Fig. 4, it may be possible to draw clinically meaningful inferences on the intracranial pathophysiological conditions noninvasively using the ratio dP1/dP2 of CBFV waveforms.
B. Correlation between Mean ICP and CBFV Pulsatility Index
Several studies have shown that there is a strong correlation between ICP and PI of CBFV in patients with various intracranial pathologies [25], [26], [30], [33]. However, other studies disagree that PI is an accurate index to assess ICP [34], [35]. As shown in Fig. 5 our results also indicate that there is no significant correlation between the mean ICP and PI. These results may seem to be contradicting at first. As Behrens et al. pointed out, however, the discrepancy between different studies can be explained by considering the fact that the ICP-PI relationship is not static since vessel compliance and cerebral autoregulation vary depending on the intracranial dynamics associated with various neuropathological conditions [35]. The correlation between ICP and PI may appear to be strong within a certain group of patients whose ICP-PI relationship is governed by the similar intracranial dynamics. However, it would be hard to find such a correlation among patients of heterogeneous conditions. Our study included 47 patients, who suffered from various types of brain injury such as traumatic brain injury (TBI), subarachnoid hemorrhage (SAH), intraparenchymal hematoma, and hydrocephalus, where their age range spread from 18 to 89. This heterogeneity in patient population may have led to almost no correlation between the mean ICP and PI as shown in Fig. 5.
C. Positive Correlation between Mean ICP and CBFV Latency
Although we could not find any significant inter-subject correlation between mean ICP and PI, several CBFV metrics were found to be well correlated with mean ICP. Especially, those metrics with CBFV latency involvement tend to be better correlated with mean ICP as shown in the top row of Fig. 6. The positive correlation between mean ICP and CBFV latency can be accounted for by considering the influence of cerebral vasoconstriction and vasodilatation on both mean ICP and CBFV latency. Since the cranial compartment is a rigid space, an increase of cerebral blood volume, caused by vasodilation, would result in ICP elevation. Cerebral vasodilation also decreases PWV of wave propagation through the cerebral vasculature and hence leads to an increase of CBFV latency resulting in a positive correlation between mean ICP and CBFV latency as observed in the present study. However, ICP elevation can be caused by other non-vascular changes of the intracranial compartment and hence only a weak positive correlation between the CBFV latency and mean ICP is expected. This has also been confirmed by the finding of the present work.
D. Comparison between TBI and SAH Patient Groups
Our database mainly consists of two patient groups: TBI and SAH. Since the vasospasm-related injuries are commonly related with SAH, the MOCAIP metrics correlation analysis results may differ between two patients groups. In order to examine any variability between two groups, we have applied our MOCAIP metrics correlation analysis to the TBI and SAH patient groups separately. Although the MOCAIP metrics of the SAH group tend to be correlated slightly stronger than those of the TBI group, we could not observe any significant difference between two groups’ correlation results. Although the pathophysiology of TBI and SAH is very different, the morphological relation between ICP and CBFV signals may not vary considerably between two groups.
E. Clinical Implications
TCD is a well-established brain monitoring modality. Due to its low cost, noninvasiveness, and readiness as a bedside interrogation tool, further investigation of the clinical values of those additional morphological metrics of CBFV pulses, especially those indifferent to inter-operator variability, could have significant impact on neurocritical care monitoring. One immediate direction could be related to incorporating the CBFV morphological metrics into several existing noninvasive ICP assessment techniques that are based on relating CBFV to mean ICP [40]–[43]. Such an effort can potentially improve noninvasive ICP accuracy because ICP pulse morphology is tightly associated with mean ICP and our present work has demonstrated the inter-subject correlation between ICP pulse morphology and CBFV pulse morphology. Therefore, the subsequent work in this direction would be to link the dots through the common pulse morphological association.
V. CONCLUSION
To the best of our knowledge, this is the first quantitative study of the CBFV pulse morphology in a great detail except what we reported in [21]. Our results demonstrate that CBFV pulse is also triphasic as ICP pulse. Several MOCAIP metrics from both CBFV and ICP pulses are highly correlated in an inter-subject fashion. According to our findings CBFV pulse morphology characterization may have a potential for noninvasive ICP morphology assessment and hence noninvasive inference of the mean ICP.
Acknowledgments
The present work is partially supported by NINDS research grant awards NS059797, NS054881 and NS066008. We would also like to thank technicians of the UCLA Cerebral Blood Flow Laboratory for helping data acquisition. The authors would also like to thank reviewers for their constructive comments that helped improve the manuscript.
The authors state that the material in the present manuscript has not been published or is under consideration for publication elsewhere.
References
- 1.Piper IR, Chan KH, Whittle IR, Miller JD. An experimental study of cerebrovascular resistance, pressure transmission, and craniospinal compliance. Neurosurgery. 32(5):805–15. doi: 10.1227/00006123-199305000-00014. discussion 815–6, May 1993. [DOI] [PubMed] [Google Scholar]
- 2.Piper IR, Miller JD, Dearden NM, Leggate JR, Robertson I. Systems analysis of cerebrovascular pressure transmission: an observational study in head-injured patients. J Neurosurg. 1990 Dec;73(6):871–880. doi: 10.3171/jns.1990.73.6.0871. [Online]. Available: http://dx.doi.org/10.3171/jns.1990.73.6.0871. [DOI] [PubMed]
- 3.Portnoy HD, Chopp M. Cerebrospinal fluid pulse wave form analysis during hypercapnia and hypoxia. Neurosurgery. 1981 Jul;9(1):14–27. doi: 10.1227/00006123-198107000-00004. [DOI] [PubMed] [Google Scholar]
- 4.Hirai O, Handa H, Ishikawa M. intracranial pressure pulse waveform: considerations about its origin and methods of estimating intracranial pressure dynamics. No To Shinkei. 1982 Nov;34(11):1059–1065. [PubMed] [Google Scholar]
- 5.Balestreri M, Czosnyka M, Steiner LA, Schmidt E, Smielewski P, Matta B, Pickard JD. Intracranial hypertension: what additional information can be derived from icp waveform after head injury? Acta Neurochir (Wien) 2004 Feb;146(2):131–141. doi: 10.1007/s00701-003-0187-y. [Online]. Available: http://dx.doi.org/10.1007/s00701-003-0187-y. [DOI] [PubMed]
- 6.Kirkness CJ, Mitchell PH, Burr RL, March KS, Newell DW. Intracranial pressure waveform analysis: clinical and research implications. J Neurosci Nurs. 2000 Oct;32(5):271–277. doi: 10.1097/01376517-200010000-00007. [DOI] [PubMed] [Google Scholar]
- 7.Contant CF, Robertson CS, Crouch J, Gopinath SP, Narayan RK, Grossman RG. Intracranial pressure waveform indices in transient and refractory intracranial hypertension. J Neurosci Methods. 1995 Mar;57(1):15–25. doi: 10.1016/0165-0270(94)00106-q. [DOI] [PubMed] [Google Scholar]
- 8.Matsumoto T, Nagai H, Kasuga Y, Kamiya K. Changes in intracranial pressure (icp) pulse wave following hydrocephalus. Acta Neurochir (Wien) 1986;82(1–2):50–56. doi: 10.1007/BF01456319. [DOI] [PubMed] [Google Scholar]
- 9.Eide PK. A new method for processing of continuous intracranial pressure signals. Med Eng Phys. 2006 Jul;28(6):579–587. doi: 10.1016/j.medengphy.2005.09.008. [Online]. Available: http://dx.doi.org/10.1016/j.medengphy.2005.09.008. [DOI] [PubMed]
- 10.Eide P, Brean A. Cerebrospinal fluid pulse pressure amplitude during lumbar infusion in idiopathic normal pressure hydrocephalus can predict response to shunting. Cerebrospinal Fluid Research. 2010 Feb;7(5) doi: 10.1186/1743-8454-7-5. [DOI] [PMC free article] [PubMed] [Google Scholar]
- 11.Eide P, Sorteberg W. Changes in intracranial pulse pressure amplitudes after shunt implantation and adjustment of shunt valve opening pressure in normal pressure hydrocephalus. Acta Neurochirurgica. 2008 Nov;150(11):1141–1147. doi: 10.1007/s00701-008-0138-8. [DOI] [PubMed] [Google Scholar]
- 12.Fan JY, Kirkness C, Vicini P, Burr R, Mitchell P. An approach to determining intracranial pressure variability capable of predicting decreased intracranial adaptive capacity in patients with traumatic brain injury. Biological Research for Nursing. 2010 Apr;11(4):317–324. doi: 10.1177/1099800409349164. [DOI] [PMC free article] [PubMed] [Google Scholar]
- 13.Fan J-Y, Kirkness C, Vicini P, Burr R, Mitchell P. Intracranial pressure waveform morphology and intracranial adaptive capacity. American Journal of Critical Care. 2008;17:545–554. [PubMed] [Google Scholar]
- 14.Hu X, Xu P, Scalzo F, Vespa P, Bergsneider M. Morphological clustering and analysis of continuous intracranial pressure. IEEE Transactions on Biomedical Engineering. 2009 Mar;56(3):696–705. doi: 10.1109/TBME.2008.2008636. [Online]. Available: http://dx.doi.org/10.1109/TBME.2008.2008636. [DOI] [PMC free article] [PubMed]
- 15.Asgari S, Xu P, Bergsneider M, Hu X. A subspace decomposition approach toward recognizing valid pulsatile signals. Physiological Measurement. 2009;30:1211–1225. doi: 10.1088/0967-3334/30/11/006. [DOI] [PMC free article] [PubMed] [Google Scholar]
- 16.Scalzo F, Xu P, Bergsneider M, Hu X. Nonlinear regression for sub-peak detection of intracranial pressure signals. 30th Annual International IEEE EMBS Conference; Vancouver, British Columbia, Canada. Aug. 2008; pp. 5411–5414. [DOI] [PubMed] [Google Scholar]
- 17.Hu X, Xu P, Lee DJ, Paul V, Bergsneider M. Morphological changes of intracranial pressure pulses are correlated with acute dilatation of ventricles. Acta Neurochir Suppl. 2008;102:131–136. doi: 10.1007/978-3-211-85578-2_27. [DOI] [PubMed] [Google Scholar]
- 18.Hu X, Xu P, Asgari S, Vespa P, Bergsneider M. Forecasting icp elevation based on prescient changes of intracranial pressure waveform morphology. IEEE Transactions on Biomedical Engineering. 2010 May;57(5):1070–1078. doi: 10.1109/TBME.2009.2037607. [DOI] [PMC free article] [PubMed] [Google Scholar]
- 19.Kasprowicz M, Asgari S, Bergsneider M, Czosnyka M, Hamilton R, Hu X. Pattern recognition of overnight intracranial pressure slow waves using morphological features of intracranial pressure pulse. Journal of Neuroscience Methods. 2010 Jul;190(2):310–318. doi: 10.1016/j.jneumeth.2010.05.015. [DOI] [PMC free article] [PubMed] [Google Scholar]
- 20.Hu X, Glenn T, Scalzo F, Bergsneider M, Sarkiss C, Martin N, Vespa P. Intracranial pressure pulse morphological features improved detection of decreased cerebral blood flow. Physiological Measurement. 2010;31(5):679–695. doi: 10.1088/0967-3334/31/5/006. [DOI] [PMC free article] [PubMed] [Google Scholar]
- 21.Hu X, Hamilton R, Vespa P, Glenn T, Martin N, Bergsneider M. Inter-Subject Correlation between Morphological Metrics of Cerebral Blood Flow Velocity Pulse and Intracranial Pressure Pulse Exists. 14th International Conference on Intracranial Pressure and Brain Monitoring; Tübingen, Germany. Sep. 12–16, 2010. [Google Scholar]
- 22.Lee SC, Chen JF, Lee ST. Continuous regional cerebral blood flow monitoring in the neurosurgical intensive care unit. Journal of Clinical Neuroscience. 2005 Jun;12(5):520–523. doi: 10.1016/j.jocn.2004.07.016. [DOI] [PubMed] [Google Scholar]
- 23.Sioutos P, Orozco J, Carter L, Weinand M, Hamilton A, Williams F. Continuous regional cerebral cortical blood flow monitoring in head-injured patients. Neurosurgery. 1995;36(5):943–950. doi: 10.1227/00006123-199505000-00009. [DOI] [PubMed] [Google Scholar]
- 24.Martin N, Doberstein C, Zane C, Carbon M, Thomas K, Becker D. Posttraumatic cerebral arterial spasm: transcranial doppler ultrasound, cerebral blood flow, and angiographic findings. Journal of Neurosurgery. 1992;77:575–583. doi: 10.3171/jns.1992.77.4.0575. [DOI] [PubMed] [Google Scholar]
- 25.Hunter G, Voll C, Rajput M. Utility of transcranial doppler in idiopathic intracranial hypertension. Cannadian Journal of Neurologicla Sciences. 2010 Mar;37(2):235–239. doi: 10.1017/s0317167100009987. [DOI] [PubMed] [Google Scholar]
- 26.Bellner J, Romner B, Reinstrup P, Kristiansson K-A, Ryding E, Brandt L. Transcranial doppler sonography pulsatility index (pi) reflects intracranial pressure (icp) Surg Neurol. 62(1):45–51. doi: 10.1016/j.surneu.2003.12.007. discussion 51, Jul 2004. [Online]. Available: http://dx.doi.org/10.1016/j.surneu.2003.12.007. [DOI] [PubMed]
- 27.Schmidt B, Czosnyka M, Raabe A, Yahya H, Schwarze JJ, Sackerer D, Sander D, Klingelhfer J. Adaptive noninvasive assessment of intracranial pressure and cerebral autoregulation. Stroke. 2003 Jan;34(1):84–89. doi: 10.1161/01.str.0000047849.01376.ae. [DOI] [PubMed] [Google Scholar]
- 28.Schmidt B, Czosnyka M, Schwarze J, Sander D, Gerstner W, Lumenta C, Klingelhofer J. Evaluation of a method for noninvasive intracranial pressure assessment during infusion studies in patients with hydrocephalus. Journal of Neurosurgery. 2000;92(5):793–800. doi: 10.3171/jns.2000.92.5.0793. [DOI] [PubMed] [Google Scholar]
- 29.Belfort MA, Tooke-Miller C, Varner M, Saade G, Grunewald C, Nisell H, Herd JA. Evaluation of a noninvasive transcranial doppler and blood pressure-based method for the assessment of cerebral perfusion pressure in pregnant women. Hypertension and Pregnancy. 2000;19(3):331–340. doi: 10.1081/prg-100101995. [DOI] [PubMed] [Google Scholar]
- 30.Vakalos A, Matamis D, Rodini I, Rigos D. Correlation of transcranial doppler (tcd) parameters with intracranial pressure (icp). 19th International Symposium on Intesive Care and Emergency Medicine; Brussels, Belgium. Mar. 1999; p. 218. [Google Scholar]
- 31.Ueno T, Ballard RE, Shuer LM, Cantrell JH, Yost WT, Hargens AR. Noninvasive measurement of pulsatile intracranial pressure using ultrasound. Acta Neurochir Suppl. 1998;71:66–69. doi: 10.1007/978-3-7091-6475-4_21. [DOI] [PubMed] [Google Scholar]
- 32.Czosnyka M, Matta BF, Smielewski P, Kirkpatrick PJ, Pickard JD. Cerebral perfusion pressure in head-injured patients: a noninvasive assessment using transcranial doppler ultrasonography. J Neurosurg. 1998 May;88(5):802–808. doi: 10.3171/jns.1998.88.5.0802. [Online]. Available: http://dx.doi.org/10.3171/jns.1998.88.5.0802. [DOI] [PubMed]
- 33.Nagai H, Moritake K, Takaya M. Correlation between transcranial doppler ultrasonography and regional cerebral blood flow in experimental intracranial hypertension. Stroke. 28(3):603–7. doi: 10.1161/01.str.28.3.603. discussion 608, Mar 1997. [DOI] [PubMed] [Google Scholar]
- 34.Ekelund A, Sveland H, Romner B, Brandt L. Transcranial doppler ultrasound in hypertensive versus normotensive patients after aneurysmal subarachnoid hemorrhage. Stroke. 1995 Nov;26(11):2071–2074. doi: 10.1161/01.str.26.11.2071. [DOI] [PubMed] [Google Scholar]
- 35.Behrens A, Lenfeldt N, Ambarki K, Malm J, Eklund A, Koskinen L-O. Transcranial doppler pulsatility index: not an accurate method to assess intracranial pressure. Neurosurgery. 2010 Jun;66(6):1050–1057. doi: 10.1227/01.NEU.0000369519.35932.F2. [Online]. Available: http://dx.doi.org/10.1227/01.NEU.0000369519.35932.F2. [DOI] [PubMed]
- 36.Wilcox RR. Introduction to robust estimation and hypothesis testing. 2. New York: Elsevier; 2005. [Google Scholar]
- 37.Wilcox RR. The percentage bend correlation coefficient. Psychometrika. 1994 Dec;59(4):601–616. [Google Scholar]
- 38.R Development Core Team. R: A language and environment for statistical computing. R Foundation for Statistical Computing; Vienna, Austria: [Online]. Available: http://www.R-project.org. [Google Scholar]
- 39.Wilcox R, Schoenbrodt F. WRS: A compiled package of R.R. Wilcox’ robust statistics functions. R package version 0.11/r8. 2009 [Online]. Available: http://R-Forge.R-project.org/projects/wrs.
- 40.Aggarwal S, Brooks D, Kang Y, Linden P, JP Noninvasive Monitoring of Cerebral Perfusion Pressure in Patients with Acute Liver Failure Using Transcranial Doppler Ultrasonography. Liver Transplantation. 2008;14:1048–1057. doi: 10.1002/lt.21499. [DOI] [PubMed] [Google Scholar]
- 41.Hu X, Nenov V, Bergsneider M, Martin N. A data mining framework of noninvasive intracranial pressure assessment. Biomedical Signal Processing & Control. 2006;1:64–77. [Google Scholar]
- 42.Schmidt B, Bocklisch S, Päßler M, Czosnyka M, Schwarze J, Klingelhöfer J. Fuzzy pattern classification of hemodynamic data can be used to determine noninvasive intracranial pressure. Acta Neurochirurgica Supplementum. 2005;95:345–349. doi: 10.1007/3-211-32318-x_71. [DOI] [PubMed] [Google Scholar]
- 43.Schmidt B, Czosnyka M, Schwarze J, Sander D, Gerstner W, Lumenta C, Pickard J, Klingelhfer J. Cerebral vasodilatation causing acute intracranial hypertension: a method for noninvasive assessment. Journal of Cerebral Blood Flow & Metabolism. 1999 Sep;19(9):990–996. doi: 10.1097/00004647-199909000-00006. [DOI] [PubMed] [Google Scholar]


