Abstract
Transient responses of sap flow to step changes in wind speed were experimentally investigated in a wind tunnel. A Granier-type sap flow sensor was calibrated and tested in a cylindrical tube for analysis of its transient time response. Then the sensor was used to measure the transient response of a well-watered Pachira macrocarpa plant to wind speed variations. The transient response of sap flow was described using the resistance–capacitance model. The steady sap flow rate increased as the wind speed increased at low wind speeds. Once the wind speed exceeded 8.0 m s−1, the steady sap flow rate did not increase further. The transpiration rate, measured gravimetrically, showed a similar trend. The response of nocturnal sap flow to wind speed variation was also measured and compared with the results in the daytime. Under the same wind speed, the steady sap flow rate was smaller than that in the daytime, indicating differences between diurnal and nocturnal hydraulic function, and incomplete stomatal closure at night. In addition, it was found that the temporal response of the Granier sensor is fast enough to resolve the transient behaviour of water flux in plant tissue.
Keywords: Nocturnal transpiration, sap flow, transient response, wind speed
Introduction
Knowledge of water movement in plants is critical to plant growth, land–atmosphere exchanges and management of forest watersheds (Wullschleger et al., 1998, Wilson et al., 2006). In the natural world, water transport from the soil into plants and from plants into the atmosphere is largely dependent on five environmental parameters: wind, radiation, temperature, humidity, and soil moisture.
Among them, wind has long been recognized as an important factor influencing plant transpiration. Grace and Russell (1982) measured the transpiration of Festuca arundinacea Schreb under two different wind speeds (1.1 m s−1 and 7.5 m s−1) and two levels of soil water in a controlled-environment wind tunnel. Transpiration was increased at high wind speed and accompanied by leaf water stress. In consequence, the growth of the leaf area was reduced as wind speed increased. Campbell-Clause (1998) used porometry to study the effect of wind on stomatal resistance of grapevine cultivars in the field. Their results show that wind increases stomatal resistance in an exponential manner. Wind speeds >4 m s−1 reduced the estimated evapotranspiration compared with wind speeds <4 m s−1. Kitaya et al. (2004) studied the effects of wind speed on photosynthesis of tomato seedlings in a wind tunnel-type chamber. The net photosynthetic rate of the plant canopy increased with increasing wind speed and was saturated when wind speed above the canopy was >0.4 m s−1.
In addition to the steady-state effects of wind on plant processes, wind is a vital parameter that typically shows large temporal variations. Variable wind speed creates unsteady effects on sap flow, due to internal dynamics responses in plants. For example, it has been discovered that the maximum water uptake rate by the roots lags behind the maximum transpiration rate (Edwards et al., 1986). Resistance–capacitance models have been used to explain the unsteady water flow through plants (e.g. Hunt and Nobel, 1987). Phillips et al. (1997) calculated the cross-correlation function between the time series of latent heat flux and sap flow data of Pinus taeda L. and found maximum correlation at ∼30 min time lag. They incorporated a time constant parameter into the resistance–capacitance model and estimated the time constant to be ∼48 min for loblolly pine trees. The term ‘time lag’ refers to a time offset between flows at two separated points in a flow system. However, the ‘time constant’ is defined as time taken for sap flow to reach 63.2% of its steady sap flow velocity when subjected to a step change in plant transpiration.
Furthermore, Phillips et al. (2004) used the transient response of sap flow to short-term variations in transpiration rate to calculate the hydraulic resistance and capacitance of trees. After a step change in transpiration at time t = 0, the sap flow velocity can be described by the following equation:
| (1) |
where Ao and A1 are constants, βτ is the total system time constant, τ=RcC (time constant of a capacitive hydraulic pathway in parallel with an axial water transport pathway), β=(Rc + Rs)/Rc, where C is bulk tissue capacitance, and Rs and Rc are axial hydraulic resistance and tissue resistance associated with storage and withdrawal of water in xylem tissue, respectively. The bulk tissue capacitance C results in an overall time constant of (Rc + Rs)C, which is in a series arrangement of resistances charging C. It results from the separation of water flow into a straight flow (along the xylem) and another one for charging the tissue (the latter decaying with time). Before the step change, the sap flow velocity V=(A1–Ao)/β at time t ≤0. When time t ≫βτ, sap flow velocity V=(A1–Ao). This analytical approach, extended to consider pulse, ramp, and half-sinusoid driving functions, worked well in describing the general patterns of tree diurnal water uptake, including the morning decoupling between transpiration and uptake, and the evening tail of uptake after transpiration approached zero. It is important to emphasize that the hydrodynamics described above are of a different nature from the dynamics of hydraulic pressure wave propagation in plants, which operate on much faster time scales (e.g. Hollinger et al., 1994; Knipfer and Steudle, 2008).
On the other hand, nocturnal sap flow and transpiration rate have been investigated recently. Fisher et al. (2007) studied the nocturnal sap flow of trees and shrubs. Their results showed that the nocturnal sap flow correlated well with vapour pressure deficit (VPD) and temperature, but the influence of wind speed on night-time transpiration was insignificant. Dawson et al. (2007) used porometry, stable isotope tracer and heat ratio sap flow sensors to study the night-time transpiration rate of a variety of vegetation types. They found that night-time transpiration rates exceeded 20% of the maximum transpiration rate measured at noon under warm and dry summer conditions; on some occasions night-time transpiration rates exceeding 40% of maximum were observed.
Numerous studies have used Granier-type (thermal dissipation) sensors to measure water flow in plants. However, it has recently been suggested (Burgess and Dawson, 2008) that the Granier-type sensor may have a time constant associated with its intrinsic heat capacitance that delays the response of the sensor to changing sap flow conditions. Therefore, they suggested that care should be taken when using Granier-type sensors to estimate the hydraulic capacitance of trees. It was further asserted that in this respect heat pulse methods have an advantage. However, the arguments presented in Burgess and Dawson (2008) do not yet have the support of experimental evidence.
Based on the studies cited above, there is a need to elucidate the role of wind on the transient behaviour of sap flow and the putative heat capacitance problem of Granier sensors. This study first measures the time constant of the Granier sensor, then uses a Granier sensor to investigate the response of sap flow under step change of wind speed, in both the daytime and the night time. The transpiration rates measured by the gravimetric method are also compared with the sap flow results.
Materials and methods
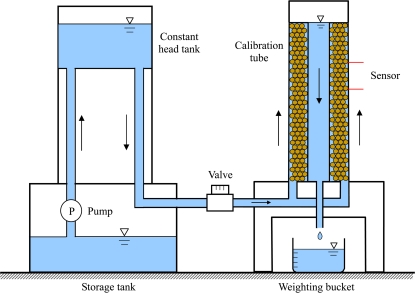
A Granier-type heat dissipation sensor was used in this study. Granier sensors were constructed according to methods described in Granier (1985, 1987). The sensor was calibrated and tested for its transient time response in a co-axial cylindrical tube containing porous media. The schematic diagram of the calibration set-up is shown in Fig. 1. The height of the tube was 60 cm, and the diameters of the inner and outer tubes were 2.5 cm and 7.0 cm, respectively. The space between the inner and outer tubes was filled with plastic beads of diameter 1.0–2.0 mm to moderate flow rates. Water was supplied by a constant head tank to provide a steady flow rate between the tubes. The flow rate could be controlled by a valve. The water flowed from the bottom of the tube to the top in order to simulate the direction of water flow through plant xylem. Once the water overflowed at the top of the inner tube, it flowed down through the inner tube to a bucket. The flow rate was measured by a stop watch and electronic weight (BH-300, Excell Co.) with a resolution of 0.01 g.
Fig. 1.
Schematic diagram of the calibration set-up. The valve can be used to control the flow rate in the co-axial cylindrical tube filled with plastic beads. The flow rate was measured by the weighting bucket. (This figure is available in colour at JXB online.)
The heated probe was coated with silicon heat-conducting paste and inserted into a 2 mm (outer) diameter aluminium tube, and this apparatus was then inserted into a hole drilled through the outer wall of the cylinder into the space between the inner and outer tubes. The reference probe was similarly installed 10 cm upstream. Entry points of the sensors were sealed so that no water escaped from the cylinder via sensor entry points.
Because there was no hydraulic capacitance in the calibration tube that would cause delays in water movement past the sensor, any dynamic changes in probe temperature in response to step changes in flow rate reflected the thermal response time of the sensor itself. In contrast, in real plants, the sensor response time reflected a combination of intrinsic sensor thermal response and the genuine hydrodynamic response of sap flow to step changes in transpiration demand. The differential voltage, which was proportional to the temperature difference across the probes, was measured by a nano-voltmeter (34420A, Agilent Inc.) with a resolution of 1×10⁻⁹ V.
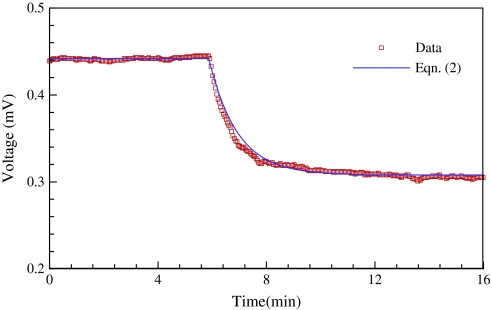
In order to test the transient response of the sensor, the valve in the calibration set-up was suddenly opened. Figure 2 shows the transient response of the sensor output voltage when flow velocity in the calibration tube suddenly changed from 0 μm s−1 to 190 μm s−1. The sensor output voltage E(t) was fitted to the exponential curve:
| (2) |
where Ts is the time constant of the sensor, Eo is the initial voltage (maximum voltage) when the velocity is zero, and E1 is the steady voltage when water is flowing. The time constant (time to reach 63.2% of maximum voltage) Ts equals 1.1 min in this case. This transient response was tested for several other flow velocities (18, 60, and 106 μm s−1) and the time constants were all <1.5 min.
Fig. 2.
Transient response of the sap flow sensor as the flow velocity in the calibration tube suddenly changes from 0 μm s−1 to 190 μm s−1. The symbols are measured data and the line is the prediction of Eqn (2) with time constant Ts=1.1 min. (This figure is available in colour at JXB online.)
Do and Rocheteau (2002a, b) studied the influence of the natural temperature gradient on the performance of a thermal dissipation sensor. They applied cyclic heating on the sensors inserted in an artificial hydraulic column and in the trunk of an Acacia tree in the field. Their results reveal that it takes 1 min to reach 74% and 5 min to reach 90% of the maximum temperature difference once the heater was switched off. This is close to the sensor performance shown in Fig. 2. As Burgess and Dawson (2008) suspected, when the sap flow velocity is zero, the heat will accumulate around the sensor, and it will take some time to ‘wash’ away the heat once the sap flow commences. However, the present experimental evidence and the results of Do and Rocheteau (2002b) show that it takes ∼1 min to wash away the accumulated heat. Once the heat has been washed away, even at low flow rates, the sensor response from one flow rate to another flow rate is rather fast (<1 min).
The calibration curve relating flow velocity V to steady output voltage:
| (3) |
where K is the flux index:
| (4) |
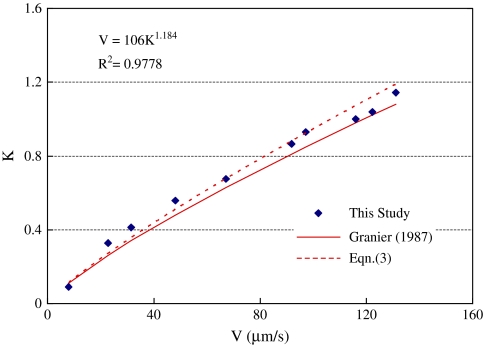
where Eo is the output voltage when flow velocity V is equal to zero, and Ev is the output voltage when the sap flow is moving. Figure 3 compares the original curve of Granier (1987) with measured data from the calibration tube. The dashed line is the prediction of Eqn (3) with new calibration constants a=106×10−6 m s−1, k=1.184, R2=0.9778. The calibration constants were very close to the constants a=119×10−6 m s−1, k=1.231 suggested by Granier (1987).
Fig. 3.
Calibration curve of the sap flow sensor. The symbols are measured data, the solid line is the original curve of Granier (1987), and the dashed line is the prediction of Eqn (3) with new calibration constants. (This figure is available in colour at JXB online.)
The wind speed experiment was carried out in an open-circuit suction-type wind tunnel. Its test section is 3.0 m wide, 2.1 m high, and 18.5 m long. A potted plant of the species Pachira macrocarpa was placed on the floor of the test section. The total height of the plant was 93 cm, stem height was 63 cm, and basal diameter was 6.5 cm. Styrofoam was used to insulate the sensor from the potential cooling effects of the wind. The air temperature and relative humidity inside the wind tunnel were measured by a hygrotransmitter (HD9008TR, Delta Ohm Inc.) and recorded by a data logger (CR10X, Campbell Scientific Inc.) throughout the experiments.
Before each wind speed experiment, the plant was well watered and the water was allowed to drain through a small hole at the bottom of the pot for at least 3 h. Soil moisture in the pot was measured by a moisture sensor (EC10, Decagon Inc.). Volumetric water content was ∼0.35 throughout the experiments. During measurement periods, the soil surface was covered with a plastic bag to prevent evaporation from the soil. The weight of the plant before and after each experiment was measured by an electronic scales (24HG-30KS, Shinko Denshi Inc.) with a resolution of 0.10 g. The plant transpiration rate was calculated by dividing the weight loss by the duration of experiment (3–8 h).
Results and discussion
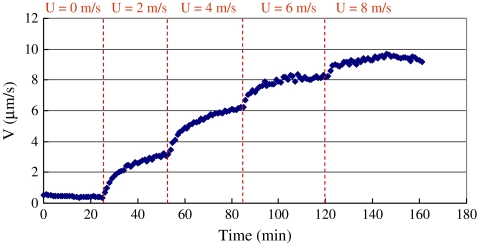
Once the wind tunnel fan was turned on, it took ∼1–2 min to reach a steady wind speed in the test section. As shown in Fig. 4, when the wind speed suddenly changed from 0 m s−1 to 2.0 m s−1, the sap flow velocity V(t) gradually increased from 0.5 μm s−1 to 3.0 μm s−1. It took 25–30 min for the sap flow velocity to reach a steady value. After that, the wind speed was adjusted from 2.0 m s−1 to 4.0 m s−1 in 1 min, and the sap flow again took ∼30 min to reach a new steady value of 6.0 μm s−1. The transient behaviour of sap flow when the wind speed changed to U=6.0 m s−1 and 8.0 m s−1 is also shown in Fig. 4. This information indicates that the response time of sap flow is much longer than the time constant of the sensor (Ts=1.1 min). Therefore, the Granier-type sensor can be used to examine the transient behaviour of sap flow.
Fig. 4.
Time course of sap flow velocity as the wind speed go through a series of step changes. The height of the stem of the plant is 63 cm. For each wind speed change, it took 25–30 min for the sap flow velocity to reach a steady value. (This figure is available in colour at JXB online.)
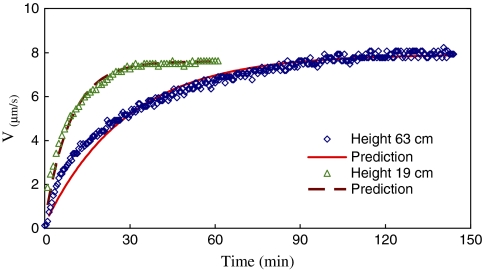
In order to investigate the effect of stem height on the time constant, two P. macrocarpa plants were tested at the same wind speed change (from 0 m s−1 to 6.0 m s−1). Figure 5 compares the transient behaviours of the taller plant (stem height 63 cm, diameter 6.5 cm) with that of the shorter plant (height 19 cm, diameter 5.8 cm) as the wind speed suddenly changed from 0 m s−1 to 6.0 m s−1. The vertical distances between the heated probe and reference probe were 10 cm for both plants. The reference probe was 5 cm from the soil surface for the shorter plant, but 30 cm for the taller plant. The numbers of leaves of the two plants were about the same.
Fig. 5.
Time courses of sap flow velocity of taller stem (height 63 cm) and shorter stem (height 19 cm) plants as the wind speed suddenly increases from 0 m s−1 to 6.0 m s−1. The symbols are measured data and the solid and dashed lines are the predictions of Eqn (5). The time constant for the taller plant is Tc=28.8 min, and for the shorter plant is Tc=9.1 min. (This figure is available in colour at JXB online.)
A simplified version of Eqn (1) was utilized to describe the transient behaviour of sap flow to a sudden change of wind speed:
| (5) |
where Vs is the steady sap flow velocity after the change and Tc is the time constant of the transient response (equal to the total system time constant βτ). Based on the measured data, the time constants for the data shown in Fig. 5 are calculated. The lines are the predictions of Eqn (5). The time constant of the taller plant is Tc=28.8 min, and that of the shorter plant is Tc=9.1 min. As can be seen, the steady sap flow velocities are very close, but the shorter plant responds faster than the plant with the taller stem. This is consistent with the taller plant having a greater total effective hydraulic resistance and/or capacitance, the product of which should lead to a larger time constant.
The taller plant was used to test the repeatability of the wind speed experiment. For a step change of wind speed from 0 m s−1 to 2.0 m s−1, the same experiment was performed three times on different days. The time constants were Tc=20.9, 20.0, and 20.1 min, respectively. The difference was within 3.0%.
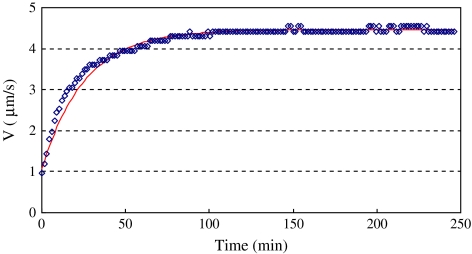
Wind speed experiments were carried out for the taller plant during the night-time (without any artificial light). Figure 6 shows the time course of nocturnal sap flow as the wind speed suddenly increased from 0 m s−1 to 6.0 m s−1. The time constant Tc=30.3 min was very close to the time constant Tc=28.8 min during the daytime under the same wind speed change. However, the steady sap flow velocity Vs=4.4 μm s−1 is smaller than the value Vs=7.8 μm s−1 in the daytime under the same wind speed of 6.0 m s−1, as shown in Fig. 5. For the night-time experiment, the same wind speed change (from 0 m s−1 to 6.0 m s−1) was repeated 1 week later, and the time constant was Tc=29.4 min; the difference between two night-time experiments was 3.0%.
Fig. 6.
Time course of nocturnal sap flow as the wind speed suddenly increases from 0 m s−1 to 6.0 m s−1. The symbols are measured data and the solid line is the prediction of Eqn (5) with time constant Tc=30.3 min. The plant stem height is 63 cm. (This figure is available in colour at JXB online.)
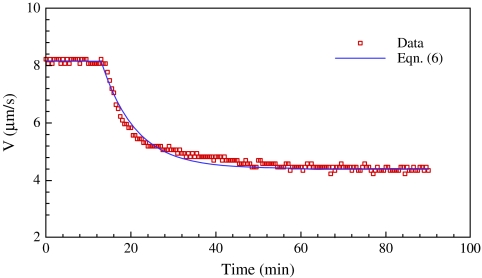
The time course of sap flow in the taller plant as the wind speed suddenly decreased from 8.0 m s−1 to 2.0 m s−1 in the daytime is shown in Fig. 7. In order to fit the measured data, Eqn (5) is modified as:
| (6) |
The sap flow velocity V=Vs when time t=0. As the wind speed decreases, the sap flow velocity V=Vs/β when time t≫Tc. In this way, the value β>1 is consistent with β=(Rc + Rs)/Rc. The solid line in Fig. 7 is the prediction of Eqn (6) with the time constant Tc=9.0 min. It is shorter than the time constant Tc=28.8 min for the wind speed suddenly increasing from 0 m s−1 to 6.0 m s−1. This implies that plants respond faster to stopping the withdrawal of water from xylem tissue than starting to withdraw water from the same tissue.
Fig. 7.
Time course of sap flow as the wind speed suddenly decreases from 8.0 m s−1 to 2.0 m s−1. The solid line is the prediction of Eqn (6) with the time constant Tc=9.0 min. (This figure is available in colour at JXB online.)
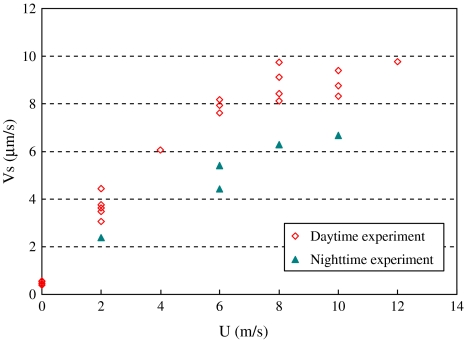
Figure 8 shows the relationship between the steady sap flow velocity Vs and wind speed U. As can be seen, the steady sap flow velocity Vs increases as wind speed U increases at low wind speed (U <7.0 m s−1). However, the increase in sap flow velocity slows down when the wind speed exceeds 8.0 m s−1. Under the same wind speed, the steady sap flow velocities Vs during the night-time are smaller than those during the daytime. The ratio between night-time and daytime sap flow velocities is in the range 66–70%. This indicates only very modest stomatal closure at night. The values determined are larger than the observations of Dawson et al. (2007). This is because they compared the values with the maximum transpiration rate measured at noon. However, the present measurements were not under the influence of radiation.
Fig. 8.
Relationship between steady sap flow velocity Vs and wind speed U for daytime and night-time experiments. The plant stem height is 63 cm. (This figure is available in colour at JXB online.)
Due to the fact that the wind speed experiments were conducted in an open-type wind tunnel, air temperature and humidity were not controlled. The air temperatures were in the range of 24–29 °C and the VPD ranged from 0.6 kPa to 2.0 kPa for the daytime experiment. For the night-time experiment, air temperatures ranged between 20 °C and 22 °C, and the VPD ranged between 0.3 kPa and 0.73 kPa.
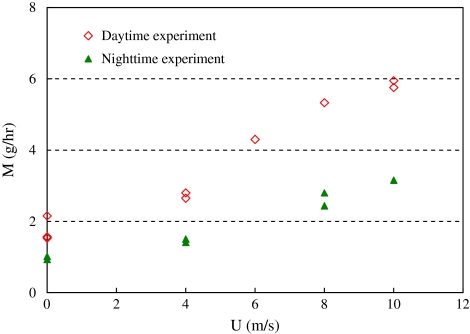
Figure 9 shows the effects of wind speed on the transpiration rate  as calculated gravimetrically. The transpiration rate increased with increasing wind speed but the rate of increase diminished when the wind speed exceeded 8.0 m s−1. Again, the night-time transpiration rate was smaller than the daytime transpiration under the same wind speed. The ratio between night-time and daytime transpiration rates was 49–53%. The reason that this ratio is smaller than that of the sap flow (66–70%) is because the duration of the transpiration experiments (3–8 h) included initial stages when the wind speed was stabilizing between two steady states.
Fig. 9.
Relationship between wind speed U and transpiration rate  for daytime and night-time experiments. The plant stem height is 63 cm. (This figure is available in colour at JXB online.)
The results in Figs 8 and 9 demonstrate that the influence of wind speed on sap flow and transpiration rate were quite significant. This is different from the observations of Fisher et al. (2007). It is believed that the shelter effect in natural forest reduces the wind speed and its influence on sap flow and transpiration. Thus, the results from the present study are most directly relevant to plants in sparsely vegetated areas, such as savannas or otherwise exposed plants.
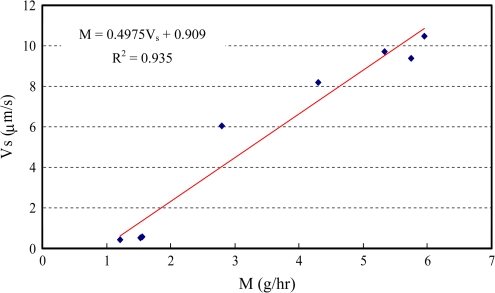
Figure 10 shows the relationship between the steady sap flow velocity Vs and transpiration rate  of the daytime experiments. Based on the measured data, an empirical relationship (R2=0.935) can be found for the plant:
| (7) |
where the sap flow velocity V is in [μm s−1], and the transpiration rate  in [g h−1]. Based on the measured data, the effective area for sap flow in the stem can be estimated as:
| (8) |
where ρ (=1.0 g cm−3) is the density of water. The ratio between the effective area and cross-section area of the stem is in the range 5.0–8.0%.
Fig. 10.
Relationship between the transpiration rate  and steady sap flow velocity Vs for daytime experiments. The plant stem height is 63 cm. (This figure is available in colour at JXB online.)
Conclusions
The temporal response of the Granier-type sensor to a step change of flow velocity has been tested in an artificial set-up. The time constant of the sensor is ∼1 min. The sensor was then used to investigate the effects of wind on the sap flow of a well-watered P. macrocarpa plant in a wind tunnel. The experimental results demonstrate that the transient response of sap flow to a step change in wind speed can be described by the analytical model suggested by Phillips et al. (2004). Also, the response time of sap flow to wind speed change in this species was much longer than the time constant of the Granier sensor. In addition, it was found that the time constant of sap flow to a sudden change of wind speed is proportional to the height of the stem, but the steady sap flow velocity is independent of stem height.
Under the same wind speed change, the time constant of nocturnal sap flow is close to the time constant in the daytime. However, the steady sap flow velocity Vs in the night-time is only 66–70% of the sap flow in the daytime. The steady sap flow velocity increases as wind speed U increases at low wind speeds (U <7.0 m s−1) both in the daytime and in the night-time. However, the rate of increase diminishes when the wind speed exceeds 8.0 m s−1. The transpiration rate, calculated gravimetrically, displays behaviour similar to sap flow as wind speed increases. The results of this wind tunnel experiment on an isolated plant demonstrate the influence of wind speed on sap flow and transpiration. This is different from observations in natural dense forests because the shelter effect of trees reduces wind speeds and their influence. However, the results from this study have potentially important implications for natural open-grown vegetation.
The results from this study have particularly important inferences regarding the suitability of Granier-type thermal sensors for studies of plant hydrodynamics and plant nocturnal water flux. The suitability of this thermal dissipation sensor for these studies has been called into question recently (Burgess and Dawson, 2008). In contrast, the results presented here suggest that the Granier sensor shows adequately fast temporal responses to resolve plant hydrodynamics and nocturnal flux rates in the species studied here. To generalize this conclusion, future studies may repeat the approach taken here to include a wider diversity of plant species and environmental parameters.
Acknowledgments
The authors thank the National Science Council, Taiwan for their support of this study (Grant 96-2621-Z-008-007).
References
- Burgess SSO, Dawson TE. Using branch and basal trunk sap flow measurements to estimate whole-plant water capacitance: a caution. Plant and Soil. 2008;305:5–13. [Google Scholar]
- Campbell-Clause M. Stomatal response of grapevines to wind. Australian Journal of Experimental Agriculture. 1998;38:77–82. [Google Scholar]
- Dawson TE, Burgess SSO, Tu KP, Oliveira RS, Santiago LS, Fisher JB, Simonin KA, Ambrose AR. Nighttime transpiration in woody plants from contrasting ecosystems. Tree Physiology. 2007;27:561–575. doi: 10.1093/treephys/27.4.561. [DOI] [PubMed] [Google Scholar]
- Do F, Rocheteau A. Influence of natural temperature gradients on measurements of xylem sap flow with thermal dissipation probes. 1. Field observations and possible remedies. Tree Physiology. 2002a;22:641–648. doi: 10.1093/treephys/22.9.641. [DOI] [PubMed] [Google Scholar]
- Do F, Rocheteau A. Influence of natural temperature gradients on measurements of xylem sap flow with thermal dissipation probes. 2. Advantages and calibration of a noncontinuous heating system. Tree Physiology. 2002b;22:649–654. doi: 10.1093/treephys/22.9.649. [DOI] [PubMed] [Google Scholar]
- Edwards WR, Jarvis PG, Landsberg JJ, Talbot H. A dynamic model for studying flow of water in a single tree. Tree Physiology. 1986;1:309–324. doi: 10.1093/treephys/1.3.309. [DOI] [PubMed] [Google Scholar]
- Fisher JB, Baldocchi DD, Misson L, Dawson TE, Goldstein AH. What the towers don't see at night: nocturnal sap flow in trees and shrubs at two AmeriFlux sites in California. Tree Physiology. 2007;27:597–610. doi: 10.1093/treephys/27.4.597. [DOI] [PubMed] [Google Scholar]
- Grace J, Russell G. The effect of wind and a reduced supply of water on the growth and water relations of Festuca arundinacea Schreb. Annals of Botany. 1982;49:217–225. [Google Scholar]
- Granier A. Une nouvelle methode pour la mesure du flux de se‘ve brute dans le tronc des arbres. Annales des Sciences Forestieres. 1985;42:193–200. [Google Scholar]
- Granier A. Evaluation of transpiration in a Douglas-fir stand by means of sap-flow measurements. Tree Physiology. 1987;3:309–320. doi: 10.1093/treephys/3.4.309. [DOI] [PubMed] [Google Scholar]
- Hollinger DY, Kelliher FM, Schulze E-D, Köstner BMM. Coupling of tree transpiration to atmospheric turbulence. Nature. 1994;371:60–62. [Google Scholar]
- Hunt ER, Nobel PS. Non-steady-state water flow for three desert perennials with different capacitances. Australian Journal of Plant Physiology. 1987;14:363–375. [Google Scholar]
- Kitaya Y, Shibuya T, Yoshida M, Kiyota M. Effects of air velocity on photosynthesis of plant canopies under elevated CO2 level in a plant culture system. Advances in Space Research. 2004;34:1466–1469. doi: 10.1016/j.asr.2003.08.031. [DOI] [PubMed] [Google Scholar]
- Knipfer T, Steudle E. Root hydraulic conductivity measured by pressure clamp is substantially affected by internal unstirred layers. Journal of Experimental Botany. 2008;59:2071–2084. doi: 10.1093/jxb/ern064. [DOI] [PMC free article] [PubMed] [Google Scholar]
- Phillips NG, Nagchaudhuri A, Oren R, Katul G. Time constant for water transport in loblolly pine trees estimated from time series of evaporative demand and stem sapflow. Trees–Structure and Function. 1997;11:412–419. [Google Scholar]
- Phillips NG, Oren R, Licata J, Linder S. Time series diagnosis of tree hydraulic characteristics. Tree Physiology. 2004;24:879–890. doi: 10.1093/treephys/24.8.879. [DOI] [PubMed] [Google Scholar]
- Wilson KB, Hanson PJ, Mulholland PJ, Baldocchi DD, Wullschleger SD. A comparison of methods for determining forest evapotranspiration and its components: sap-flow, soil water budget, eddy covariance and catchment water. Agricultural and Forest Meteorology. 2006;106:153–168. [Google Scholar]
- Wullschleger SD, Meinzer FC, Vertessy RA. A review of whole plant water use studies in trees. Tree Physiology. 1998;18:499–512. doi: 10.1093/treephys/18.8-9.499. [DOI] [PubMed] [Google Scholar]


