

Abstract
To facilitate the monitoring of guard cells during development and isolation, a population of 704 GAL4 GFP enhancer trap lines was screened and four single insert lines with guard cell GFP expression and one with developmentally-regulated guard cell GFP expression were identified. The location of the T-DNA inserts, the expression of the flanking genes, and the promoter activity of the genomic DNA upstream of the T-DNA were characterized. The results indicated that the GFP expression pattern in at least one of the lines was due to elements in the intergenic DNA immediately upstream of the T-DNA, rather than due to the activity of the promoters of genes flanking the insert, and provide evidence for the involvement of Dof elements in regulating guard cell gene expression. It is shown further that the GAL4 GFP lines can be used to track the contribution of guard cell material in vitro, and this method was used to assess the purity of guard cell samples obtained using two methods of guard cell isolation.
Keywords: Arabidopsis, development, enhancer trap, GFP, guard cells, stomata, T-DNA
Introduction
Stomatal pores are located on the surface of the leaves and stems of all vascular plants and act as the primary route for gas exchange between the plant and the atmosphere. The pores are delimited by two stomatal guard cells which respond to a range of environmental and physiological signals to regulate the pore aperture and, consequently, the uptake of CO2 and the release of water vapour by the plant (Schroeder et al., 2001; Hetherington and Woodward, 2003). Guard cells are symplastically isolated from the remainder of the leaf cells at an early stage in their development (Willmer and Sexton, 1979), making them an attractive system for the study of plant biology at the level of the single cell. Attempts to identify molecular determinants of guard cell functioning and development can be hindered by the difficulties associated with the isolation of guard cells from Arabidopsis, which has stomatal complexes smaller than in other species and leaves that do not allow for the easy removal of the epidermis (Pandey et al., 2002). To circumvent these difficulties, gene traps based on the expression of β-glucuronidase (GUS) in guard cells have been used to identify several guard cell expressed genes, including INWARD RECTIFYING K+ CHANNEL 1 (KAT1; Anderson et al., 1992; Nakamura et al., 1995; HIGH IN CO2 (HIC; Gray et al., 2000), CYTOCHROME P450 86A2 (CYP86A2) mono-oxygenase, the PLEIOTROPIC DRUG RESISTANCE 3 (AtPDR3) transporter, and a PP2C protein phosphatase (Galbiati et al., 2008).
The identification and molecular and physiological characterization of a GAL4 GFP enhancer trap population that marks stomatal guard cells or developing stomatal complexes are reported here. In vivo imaging of GFP allowed the identification of lines that marked guard cells and lines which track development of stomatal complexes. The GAL4 GFP enhancer trap lines contain a construct comprising a GAL4-VP16 transcriptional activator and a modified GFP gene (mGFP5ER) under the control of GAL4 upstream activation sequences (UAS). The construct is randomly located in the genome and reports the activity of endogenous enhancer elements in the vicinity of reporter gene insertion (Haseloff, 1999; Laplaze et al., 2005). Enhancer elements are autonomous modules that vary in size from about 50 bp to 1.5 kb, with each module performing a specific function, such as activation of its cognate gene at a specific developmental stage or in a specific cell type in a distance and orientation independent manner (Blackwood and Kadonaga, 1998; Struhl, 2001). Since GFP expression marks the activity of such enhancer modules, enhancer trap lines have been used to identify regulatory sequences responsible for specific expression patterns (Tsugeki and Fedoroff, 1999). In cases where the enhancer modules drive cell-specific GFP expression, the lines may be used for fluorescence-based sorting and mapping of the transcriptional profiles of the cell types in question (Birnbaum et al., 2003, 2005). In addition, the ability easily to visualize GFP expression in the same plant material over extensive timescales has enabled the identification of genes involved in processes such as senescence, responses to oxygen deprivation, and shoot induction (Swaminathan et al., 2000; He et al., 2001; Cary et al., 2002; Baxter-Burrell et al., 2003). More recently, Dodd et al. (2006) utilized a GAL4 GFP enhancer-trap line to target AEQUORIN (AEQ) expression specifically to guard cells, and thus characterize time-of-day dependent alterations in cold-induced increases in cytoplasmic free calcium in guard cells.
Five GAL4-GFP enhancer trap lines have been isolated, four with predominant guard cell expression and one which tracks development of the stomatal complex. It is demonstrated that these lines are not compromised in stomatal function and, as such, might be useful in further analysis of stomatal function. It is shown that guard cell-specific expression of GFP is likely to be driven by proximal elements in the intergenic DNA immediately upstream of the insert. Using one of the guard cell-specific enhancer trap lines along with lines marking other cell types, it is demonstrated that the GAL4 GFP lines can be used to track guard cell-derived material in complex mixtures and to compare the efficacy of protoplasting and epidermal fragmentation in isolating pure guard cell RNA samples.
Materials and methods
Plant material and growth conditions
GAL4 GFP enhancer trap lines and their wild-type ecotypes were obtained from the Haseloff and Poethig collections (http://www.arabidopsis.org). Lines KS019-1, J2103-1, and E361-1 were derived by backcrossing to the respective wild-type ecotypes. Lines KC274, KC380, and KC464 were obtained from Dr JP Carr (Cambridge University). Seeds were surfaced-sterilized and sown on 0.5× Murashige and Skoog (MS) medium, 1% w/v sucrose, 0.8% w/v agar, supplemented with 50 mg l−1 kanamycin when required. Seedlings were grown in 12/12 h light/dark at 19 °C for 2 weeks before being transferred onto a 3:1(v/v) mix of potting compost:vermiculite and grown at 20 °C and 200 μmol photons m−2 s−1 photosynthetically active radiation (PAR) in a Fitotron growth chamber.
GFP imaging and line selection
GFP expression in whole seedlings was visualized using a Leica fluo III fluorescence microscope (Wetzlar, Germany). Light was provided by a 100 W mercury lamp and wavelength selectivity by GFP1 (excitation wavelength 425 nm, 480 nm barrier filter for emission) and GFP3 (excitation wavelength 480 nm, emission 525 nm) filters. For confocal microscopy, plants or tissues were imaged using a Leica DMRXA microscope as described by Kiegle et al. (2000). Excitation was provided by the 488 nm line of an argon laser. A long pass 500 nm dichroic was used as the beam splitter. Emission maxima were 510 nm for GFP and 610 nm for propidium iodide.
Phenotypic assays
The analysis of the rate of water loss from detached leaves was performed as described by Dodd et al. (2006). Leaves were detached from mature soil-grown plants and placed in a Sanyo MLR-350 growth cabinet held at 20 °C. Leaves were weighed at regular intervals over a 3 h period. The drought stress screen was carried out by withholding water from 2-week-old plants growing at 20 °C and 200 μmol photons m−2 s−1 PAR. Plants were photographed daily to allow monitoring of phenotypic responses. Root length and lateral root measurements were obtained by growing seedlings on vertical MS agar plates supplemented with either 10 nM or 20 nM 2,4-dichlorophenoxyacetic acid (2,4-D), 0.5 μM or 1 μM indole-3-acetic acid (IAA) or 1 μM kinetin (Sigma) or kept at either 4 °C and 45 μmol photons m−2 s−1 PAR or in constant dark. Root lengths and lateral root number were measured from the images of the plates using MetaMorph (Molecular Devices, USA).
Determination of insert number and location
Analysis of the copy number of T-DNA inserts was carried out as described by Dodd et al. (2006). Genomic DNA was prepared from all lines using the DNeasy Plant DNA extraction kit (Qiagen, Germany) and 1 μg digested with BglII and SpeI restriction endonucleases (NEB, UK). All digests were carried out for 6 h at 37 °C. DNA fragments were separated by 0.8% (w/v) agarose gel electrophoresis and transferred to Hybond-N nylon membrane (Amersham Pharmacia Biotech). Southern blot analysis was carried out as outlined in Ausubel et al. (1999) using a 504 bp GAL4 DNA probe amplified from the ET15 plasmid (Haseloff, 1999) using the primers [5′-CGGCAAGCTTGGATCCAACAATG-3′] and [5′-CCCGGAGCTCGTCCCCC AGGCTG-3′].
To identify the location of the T-DNA inserts in the GAL4 GFP enhancer trap lines, genomic DNA flanking the T-DNA insertions was amplified by TAIL PCR (Liu and Whittier, 1995) using nested specific primers complementary to the right or left T-DNA borders and a degenerate primer (see Supplementary Table S1 at JXB online). The products of the tertiary reaction were cloned and sequenced.
Promoter fusions and GUS assays
Genomic DNA fragments upstream of the T-DNA inserts or genes flanking the T-DNA inserts were amplified by PCR using the Expand High Fidelity PCR System (Roche, Germany) according to the manufacturer's instructions. The primers used incorporated a BamHI recognition site at the 3′ end of each of the DNA fragments and either HindIII or SalI sites at the 5′ of the fragments (see Supplementary Table S2 at JXB online). Fragments were sequence verified and cloned into the pGEM-T Easy vector system (Promega, USA) for amplification and subsequently into the pBI101 binary vector (BD Biosciences Clontech, USA). The pBI101 plasmids were electroporated into Agrobacterium tumefaciens strain GV3101 (Stratagene, USA), which was used for transformation of Arabidopsis by floral dipping (Clough and Bent, 1998). Transformants were selected using 50 mg l−1 kanamycin (Sigma, UK).
For GUS staining, whole seedlings or individual tissues from transformed plants were vacuum-infiltrated and incubated at 37 °C for 4–48 h in staining solution (100 mM sodium phosphate, 10 mM EDTA, 0.5 mM potassium ferrocyanide, 0.5 mM potassium ferricyanide, 1 ml l−1 Triton X-100; pH 7.0) containing 0.5 mg ml−1 X-glucoronic acid. Tissues were cleared with 70% ethanol and examined using a Leica fluo III dissecting microscope (Wetzlar, Germany) and a Leica DMRXA microscope. The DR5::uidA line (Ulmasov et al., 1997) was used as positive control and A. thaliana Col-0 transformed with the binary vector pBI101 (BD Biosciences Clontech, Palo Alto, CA, USA) as a negative control.
Epidermal fragmentation and guard cell protoplast isolation
Epidermal fragments were isolated by blending 2.5 g mature A. thaliana leaves in approximately 100 ml of ice-cold deionized water in a Waring laboratory blender (Waring Commercial, USA), four bursts of 15 s each as described by Kopka et al. (1997) and Hugouvieux et al. (2001). The resulting homogenate was filtered through a 200 μm nylon mesh (Normesh, UK) lined with ice and the retained epidermal fragments rinsed with ice-cold water. The blending and straining cycle was repeated three times. Guard cell protoplasts were prepared as described by Leonhardt et al. (2004) either with or without 100 mg l−1 cordycepin (Berry and Associates, USA), 33 mg l−1 actinomycin D, and 100 mM cycloheximide (Sigma).
Analysis of gene expression
RNA was isolated from whole leaves, epidermal fragments or guard cell protoplasts using TRIzol® (Invitrogen, UK) as described by the manufacturers. Contaminating DNA was degraded using RQ1 RNase-free DNase I (Promega, USA) and the samples further purified on RNeasy Cleanup columns (Qiagen, Germany). RNA was confirmed to be free of contaminating DNA by PCR analysis. RNA was reverse transcribed into cDNA using Oligo(dT)15 primers (Roche, USA) and the Superscript II RNase H– reverse transcriptase system (Invitrogen, UK). Analysis of relative transcript abundance by semi-quantitative RT-PCR was performed as outlined by Pandey et al. (2002) and Leonhardt et al. (2004). All primers used are described in Supplementary Table S3 at JXB online.
Results
Isolation of enhancer trap lines with guard cell GFP expression
The Haseloff and Poethig electronic GAL4 GFP enhancer trap line collections were screened to identify lines potentially expressing GFP in stomatal guard cells. Nine of the 401 lines in the Haseloff collection and 14 of the 303 lines in the Poethig collection were identified as potential guard cell GFP-expressing lines. The GFP expression patterns in these 23 lines were characterized in greater detail over 18 d following germination. GFP was stably expressed in guard mother cells or mature guard cells, and in other parts of the roots or shoot, in 16 of the lines examined (Table 1). In the remaining seven lines, GFP was expressed only transiently in some cell or tissue types, suggesting that GFP expression was driven by developmentally regulated enhancers. In one of these lines (E2306), GFP was strongly expressed in the meristemoids and GMCs in both the cotyledons and leaves, but expression became significantly weaker in, or disappeared completely from, both guard cells and subsidiary cells when a stoma was fully formed (Fig. 1). The results suggest that E2306 might be useful for tracking stomatal development in Arabidopsis.
Table 1.
GFP expression patterns of GAL4 GFP enhancer trap lines selected from the electronic databases on the basis of GFP expression in stomatal guard cells
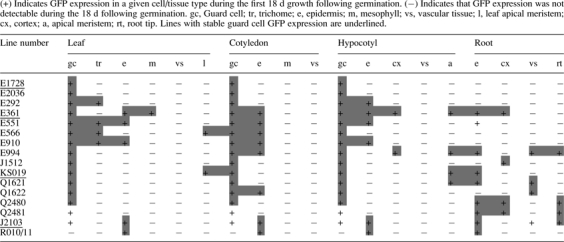 |
Fig. 1.

3-D projections of CLSM images of the GAL4 GFP enhancer trap line E2306. In E2306 this first asymmetric division in stomatal development was marked by activation of GFP expression in the meristemoid (A). Meristemoids (M) then either convert directly to a guard mother cell (GMC) (B) or divide one (E) or more (G) times before converting to a GMC. The GMC then divides symmetrically to form a pair of guard cells (C, F). Satellite meristemoids (SM) can subsequently form by asymmetric division of one of the subsidiary cells (D, H). Once development of the stomatal complex is complete GFP expression fades significantly from the guard cells and subsidiary cells (I). All projections comprise six optical sections each separated by 1.47 μm. The scale bar represents 20 μm and applies to all images.
Of the 16 lines stably expressing GFP, only four (E1728, KS019, J2103, and E331) maintained GFP expression patterns in the majority of individuals in T3–T5 generations. In lines J1512, Q2480, Q2481, Q1621, Q1622, R010, and R011, GFP was only expressed in a small proportion of kanamycin-resistant T2 seedlings. In lines E292, E551, E910, and E994, GFP was expressed strongly in all T2 and T3 generation seedlings, but could only be observed in <10 % of T4 generation kanamycin-resistant seedlings, suggesting that either the GAL4 or the GFP transgene was susceptible to gene silencing in these lines.
Analyses of the numbers of T-DNA inserts in each of the four lines stably expressing GFP (E1728, KS019, J2103, and E361) were carried out. Southern blots using radioactively labelled GAL4 DNA probes indicated that line E1728 contained a single tandem T-DNA insertion, while lines E361, KS019, and J2103 contained at least two inserts each. This was in contrast to the 19 discarded lines with unstable GFP expression, which carried as many as nine T-DNA inserts. To obtain lines in which GFP was restricted to guard cells, or at least to fewer tissue types, lines E361, KS019, and J2103 were back-crossed with wild-type plants. Single segregants with predominant GFP expression in guard cells and more limited GFP expression in other parts of the plant were isolated from each population. These lines were designated KS019-1, J2103-1, and E361-1. Southern blot analysis indicated that these were all single insert lines (data not shown). E1728, KS019-1, J2103-1, and E361-1 had stable and heritable GFP expression patterns (Fig. 2). In E1728, GFP expression was exclusive to the stomatal guard cells (Fig. 2A–C; Dodd et al., 2006). Similarly, GFP expression was limited to guard cells alone in the single insert E361-1 line, in contrast to the parental E361 line which showed GFP expression in guard cells, epidermal pavement cells, and roots (Fig. 2D–F). In KS019-1, GFP was expressed primarily in the guard cells, but was also expressed in the leaf apical meristem, leaf primordial and root epidermal cells (Fig. 2G–I). Line J2103-1 had GFP expression in the guard cells on the abaxial leaf surface, epidermal pavement cells on the hypocotyl and adaxial leaf surface, and in the root cap, root tips, and root vascular tissue (Fig. 2J–L). The GFP expression patterns of the guard cell enhancer trap lines remained unchanged under a variety of stress conditions which included exposure to cold (4 °C), prolonged darkness, 0.5 μM ABA, 20 nM 2,4-D, or 1 μM kinetin treatments (data not shown).
Fig. 2.

3-D projections of CLSM images of single insert enhancer trap lines stably expressing GFP in stomatal guard cells. E1728 (A–C) and E361-1 (D–F) had guard cell-specific GFP expression. Lines KS019-1 (G–I) and J2103-1 (J–L) had predominant guard cell GFP expression, but GFP was also detected in leaf and root epidermal cells. All scale bars represent 20 μm.
Phenotypic characterization
To determine whether the growth or development of the plants was affected by the T-DNA insertions responsible for GFP expression, the morphology, growth rate, flowering time, and root growth of each of the selected GFP enhancer trap lines relative to their respective wild type were recorded. Overall, there were no detectable morphological differences between the GFP enhancer trap lines and their respective wild-type ecotypes when grown in greenhouse conditions (data not shown). Analysis of the rate of water loss from leaves detached from plants and weighed over the successive 3 h indicated that there were no significant differences in stomatal responses between GAL4 GFP enhancer trap lines and their respective wild-type ecotypes (data not shown). All lines and their respective wild types lost 10–15% of their fresh weight within 40 min of leaf excision, in contrast to the approximately 90% loss in fresh weight recorded for the drought-sensitive positive control (abscisic acid insensitive 1-1 (abi1-1); Leung et al., 1997; Webb and Baker, 2002; Dodd et al., 2006). Similarly, there were no detectable differences in the phenotypic responses of the GAL4 GFP enhancer trap lines and the respective wild-type backgrounds to imposed drought stress. Plants were grown on soil for 2 weeks after which water was withheld. All plants were imaged daily over the subsequent 3 weeks to assess phenotypic responses. All lines and wild types began to show visible signs of water deficit stress (wilting and accumulation of anthocyanins) 9–10 d after water was withheld (data not shown). For root growth assays, plants were grown on upright MS agar plates under a variety of conditions. Root length and lateral root number were assessed daily using image analysis software. There were no significant differences in root growth over 5 d between the GAL4 GFP enhancer trap lines and the respective wild-type backgrounds when plants were grown under 12/12 h light/dark cycles at 20 °C, on plates supplemented with 1 μM kinetin or at 4 °C (data not shown). Overall, the results of our phenotypic analysis suggest that the four selected guard cell expressing GAL4 GFP enhancer trap lines (E1728, KS019-1, J2103-1, and E361-1) were not significantly compromized in growth or development by insertion of the GAL4 GFP T-DNA.
Characterization of insert location
We were interested in identifying the genes flanking the T-DNA inserts, and in determining whether their expression patterns correlated with the GFP expression patterns observed in the enhancer trap lines (Cary et al., 2002). Thermal asymmetric interlaced PCR (TAIL PCR; Liu and Whittier, 1995) was used to characterize the positions of the T-DNA inserts in the genome and the identity of the genes flanking each insert. The T-DNA insertion in E1728 was flanked by the coding sequences of a putative 316 amino acid, 34.8 kDa, chloroplast-targeted Dof zinc finger transcription factor (At5g65590, position 28387–29337, TAC K21L13) and a putative 675 amino acid, 75.3 kDa, transmembrane receptor-like kinase (At5g65600, position 32429–34456, TAC K21L13). The T-DNA was coding in the opposite direction to the two flanking genes (see Supplementary Fig. S1 at JXB online). The T-DNA insert in J2103-1 was located between the coding sequences of a putative 620 amino acid, 68.6 kDa endo-β-1,4-glucanase (At1g64390, position 29032–32345 in BAC F15H21), and a 351 amino acid, 38.1 kDa unknown protein (At1g64385, position 41718–43365 in BAC F15H21). The T-DNA was in the same coding direction as both the flanking genes (see Supplementary Fig. S1 at JXB online). The T-DNA insert in E361-1 was located 23 bp upstream, in the opposite coding direction, from the 3′ terminus of the coding sequence of a 189 amino acid, 21 kDa, putative IAA6 gene (At1g52830), position 42631–41742 (BAC F14G24) and 2.37 kb downstream from the translational termination codon of a 317 amino acid, 36.6 kDa putative oxidoreductase gene, coding in the same direction (At1g52820, position 38288–39393, BAC F14G24). The T-DNA insert in KS019-1 was located 506 bp upstream from the translational start site of a 599 amino acid, 66.7 kDa transmembrane hypothetical protein, in the same coding direction (At3g27390, position 36376–33637, TAC K1G2) and 3.8 kb upstream from the translational start site of a 412 amino acid, 46 kDa putative pectate lyase, coding in the opposite direction to the T-DNA (At3g27400, position 40588–43288, TAC K1G2; see Supplementary Fig. S1 at JXB online).
To determine whether any of the genes flanking the T-DNA inserts in the guard cell GFP lines E1728, KS019-1, and E361-1 were expressed either preferentially or exclusively in guard cells, the patterns of GUS activity in wild-type plants transformed with constructs containing the promoter regions of the adjacent genes fused to a uidA reporter gene were monitored. A 1.7 kb fragment (29344–31044, TAC K21L13; see Supplementary Fig. S1 at JXB online) of the promoter region of the Dof zinc finger transcription factor (At5g65590) that flanks the insert in E1728 drove GUS expression in guard cells, epidermal cells, mesophyll cells, and vascular tissue in the hypocotyl, petiole, and young leaves in all six independently transformed T1 lines (Fig. 3A–C). GUS activity was also present in root vascular tissue (Fig. 3D). By contrast a 1.2 kb fragment (34456–35656 TAC K21L13; see Supplementary Fig. S1 at JXB online) of the receptor-like kinase (At5g65600) promoter that flanks the left border of the T-DNA insert in E1728 did not drive detectable GUS activity in any of six independent kanamycin resistant T1 (Fig. 3E–H). These data indicated that neither gene flanking the T-DNA insert in E1728 is preferentially expressed in guard cells and are consistent with published microarray data on guard cell-expressed genes (Leonhardt et al., 2004; Yang et al., 2008).
Fig. 3.

Analysis of the expression of genes flanking the T-DNA inserts in E1728, E361-1, and KS019-1. GUS activity resulting from fusion of 1.7 kb of the promoter of At5g65590 flanking the T-DNA in E1728 to the uidA reporter gene was detected in guard cells, epidermal cells, mesophyll cells, and vascular tissue in the top half of the hypocotyl (A), petiole (B, C), and young leaves and in root vascular tissue (D). GUS activity was not detected following fusion of the 1.2 kb of the promoter of At5g65600 flanking the T-DNA in E1728 to the uidA reporter gene (E–H). GUS activity resulting from fusion of the 0.98 kb of the promoter of At1g52830 flanking the T-DNA insert in E361-1 to the uidA reporter gene was detected in the vascular tissue of leaves (I, J), cotyledons and petioles, and in guard cells and epidermal cells in leaves (K). GUS activity resulting from fusion of 2.3 kb of the promoter region of At3g27390 flanking the T-DNA insert in KS019-1 to the uidA reporter gene was detected in all leaf cell types (L, M), including guard cells (N, abaxial epidermal peel) and also in roots (O). Images are representative of six independently transformed T1 seedlings and 12 T2 seedlings. In all cases, GUS activity was detected in the DR5::uidA (Ulmasov et al., 1997) positive control but undetectable in the Col-0 wild-type negative control. Bars represent 5 mm (A, I, L), 1 mm (B), 20 μm (C, D, G, H, J, K), 10 mm (E), 100 μm (F), 40 μm (M, N), 2 mm (O).
The TAIL-PCR mapping results indicated that the T-DNA was inserted within a putative IAA6 gene (At1g52830) in line E361-1 and in the promoter region of a putative protein gene (At3g27390) in KS019-1. Consequently, only the expression of the appropriate gene was considered for each line. In plants transformed with uidA fused to a 0.98 kb IAA6 promoter fragment, GUS activity was detected in the vascular tissue, guard cells, and epidermal cells of all four independent T1 seedling lines (Fig. 3I–K). Weak GUS activity was also detected in the vascular tissue of roots of kanamycin-resistant T2 seedlings. This indicates that the putative IAA6 gene is likely to be expressed in guard cells, but its expression pattern is not replicated by the GFP expression pattern observed in line E361-1. Similarly, T2 seedlings containing a 2.3 kb fragment of the At3g27390 promoter upstream of uidA, had GUS activity in the roots, shoot vascular tissue, epidermis, mesophyll cells, and guard cells (Fig. 3L–O), indicating that the expression of the putative protein did not match that observed for GFP in KS019-1.
The patterns of GFP expression observed in E1728, KS019-1, and E361-1 might be due to pseudo-promoter activity arising from proximal sequences in the genomic DNA immediately upstream of the T-DNA inserts. To explore this possibility, wild-type Col-0 plants were transformed with a construct containing the uidA reporter fused to a 1.45 kb DNA fragment comprising 74 bp of the T-DNA RB and 1.391 kb of the genomic DNA adjacent to the T-DNA RB in E1728. Strong GUS activity was detected in guard cells and significantly weaker GUS activity in vascular tissue and some epidermal pavement cells in leaves of each of four independent T1 and T2 transformants (Fig. 4A–D). By contrast, however, seedlings transformed with constructs containing the uidA gene fused to the genomic DNA flanking the inserts in K019-1 and E361-1 did not have any GUS activity in guard cells (Fig. 4E–G). Given the similarity of the GUS activity patterns to the GFP expression patterns in E1728, it was considered likely that the regulatory DNA sequences driving guard cell-specific GFP expression in E1728 were contained within the 1.391 kb genomic DNA fragment adjacent to the T-DNA RB. A motif analysis of this region using PLACE (http://www.dna.affrc.go.jp/PLACE) indicated that it contains eight putative Dof transcription factor binding sites ([T/A]AAAG), which have previously been shown to be sufficient to drive reporter gene expression in guard cells (Plesch et al., 2001; Galbiati et al., 2008; Yang et al., 2008). A series of five successive deletions of this region was constructed in an attempt to refine the identity of the guard cell regulatory elements. The genomic DNA fragment adjacent to the T-DNA RB in E1728 was truncated to 1.036 kb (DD1), 0.616 kb (DD2), 0.211 kb (DD3), 0.105 kb (DD4), or 0.080 kb (DD5), removing two, four, six, seven, and eight of the dof transcription factor binding sites, respectively (see Supplementary Fig. S2 at JXB online). Plants transformed with a construct containing the 1.036 kb fragment (DD1) upstream of the uidA gene had very weak GUS expression in leaf vascular tissue, some epidermal cells, and some guard cells, while plants transformed with constructs containing any of the other fragments had no detectable GUS activity (data not shown). The data therefore suggest that GUS expression in guard cells might be dependent on the presence of the six proximal dof transcription factor binding sites, and confirmed that sequences in the genomic DNA upstream of the T-DNA insert in E1728 were likely to be responsible for driving GFP expression in stomatal guard cells.
Fig. 4.

GUS activity following fusion of DNA fragments adjacent to the T-DNA RB to the uidA reporter gene. The 1.4 kb fragment of genomic DNA adjacent to the right border of the T-DNA insert in E1728 drove uidA expression in the vascular tissue and guard cells of leaves of T1 individuals (A–C). Activity was also detected in hypocotyl guard cells of T2 seedlings and in some epidermal pavement cells in T1 and T2 individuals (D). GUS activity was not observed in plants transformed with a construct carrying a 2.4 kb fragment of the DNA upstream of the T-DNA right border in E361-1 (E, F), whereas those transformed with a construct carrying 1.75 kb genomic DNA upstream of the T-DNA right border in KS019-1 had no GUS activity in the leaves (G) but did have GUS activity in the hypocotyl and root vascular tissue (H). GUS activity was analysed in four independently transformed, kanamycin resistant T1 seedlings and 10 kanamycin resistant T2 seedlings. Bars represent 5 mm (A, E, G), 200 μm (B, F, H), 50 μm (C, D).
Utilization of the lines as markers of guard cell purity
A primary motivation for isolating guard cell-specific GFP enhancer trap lines was to use them to track guard cells during purification protocols. GFP-specific enhancer trap lines were used as markers to assess two published methods of guard cell isolation, namely guard cell protoplasting (Zeiger and Hepler, 1976; Boorse and Tallman, 1999; Pandey et al., 2002) and epidermal fragmentation (Kopka et al., 1997; Hugouvieux et al., 2001; Desikan et al., 2005). Epidermal fragmentation has been reported to yield guard cell samples of up to 95% purity (Hugouvieux et al., 2001; Zimmermann et al., 2001; Kwak et al., 2002; Desikan et al., 2005). This was confirmed by microscopic analysis of samples after various homogenization times. Epidermal cell and mesophyll cell contamination was observed in all samples (Fig. 5A–C), but declined in relation to the homogenization time used (Fig. 5G). After 6 min homogenization, guard cells accounted for approximately 90% of the cells attached to epidermal fragments, epidermal cells for approximately 9%, and mesophyll cells for the remaining 1% (Fig. 5G). Although a considerable amount of vascular tissue was observed, it was not possible to estimate via microscopy the number of intact cells in cylindrical vascular strands.
Fig. 5.

Guard cells isolated via the epidermal fragmentation method (A–C). Guard cells (GC) were considered viable on the basis of being able to take up and retain toluidine blue but neighbouring epidermal cells (EC) lacking cytoplasm did not retain the stain (A). EC and mesophyll cell (MC) were observed in all fragment preparations (B, C). GCPs were isolated following the method of Leonhardt et al. (2004) (D, E). Following release of GCPs from intact, purified epidermal fragments (D), the GCPs comprised approximately 90% of the cell population (E). (F) The cellular identity of protoplasts was confirmed by confocal microscopy of samples from the guard cell-specific enhancer trap line E1728. (G) Determination of the cellular composition of epidermal fragments with increasing homogenization times. For all cell counts, 500 cells were examined in three independent replicates. The contribution of vascular tissue could not be determined and is therefore not represented. Scale bars in (A)–(F) represent 15 μm.
Guard cell protoplasting utilizes a range of filtration steps to remove much of the cell debris after homogenization, and has been reported to yield samples of greater than 98% purity (Zieger and Hepler, 1976; Boorse and Tallman, 1999; Pandey et al., 2002; Leonhardt et al., 2004). Guard cell protoplasts were prepared from 15–20 mature A. thaliana plants using the method of Leonhardt et al. (2004). Samples contained less than 2% contaminating mesophyll protoplasts which were distinguished by their larger size and higher chloroplast content (Fig. 5D–F).
Lines expressing GFP in specific cell types were used to assess whether the cell count-based estimation of guard cell purity could be substantiated by quantification of the amount of GFP present in RNA derived from guard cell isolations. The relative contribution of RNA from various cell types to the pool of ‘guard cell’ cDNA obtained using either protoplasting or epidermal fragmentation to purify guard cells was established. GFP expression in guard cells (E1728, Fig. 2A–C), spongy mesophyll (JR11-2), vasculature (KC274), trichome (KC380), and epidermal pavement cell (KC464) enhancer trap lines (Fig. 6A) was used as a cell-type marker. GFP was detected in whole leaves, epidermal fragments, and GCP cDNA pools obtained from E1728 indicating that guard cell RNA was present in each sample (Fig. 6B, C). Substantial GFP was present in epidermal fragment cDNA pools obtained from both KC380 and KC274 suggesting that the ‘epidermal fragment’ RNA pools were contaminated with RNA from both trichome and vascular cells (Fig. 6B, C). In GCP cDNA pools GFP was only substantially detected in the pool derived from E1728, though a small amount of GFP was detected in pools derived from KC464 (Fig. 6B, C) indicating that GCP cDNA pools were derived almost exclusively from guard cells and contained little contaminating RNA.
Fig. 6.

Comparison of purification of guard cells by epidermal fragmentation and protoplasting using GAL4-GFP enhancer trap lines. (A) Tissue-specific localization of GFP in selected enhancer trap lines. (I) JR11-2, spongy mesophyll. (II) KC274, vasculature. (III) KC380, trichomes, and (IV) KC464, epidermal pavement cells. Images are pseudo-coloured, with red representing chlorophyll autoflourescence collected between 750 and 780 nm, and green representing GFP fluorescence collected at 510 nm. (B) GFP and ACT8 were amplified in the linear range from whole leaf, epidermal fragment, and protoplast cDNA prepared from the GFP GAL4 enhancer trap lines. (C) The band intensities of GFP represented relative to ACT8 band intensities for epidermal fragment and guard cell protoplast RNA. Results are means of three independent experiments. (D) Semi-quantitative RT-PCR analysis of the expression of cell-specific markers in serial dilutions of whole leaf, epidermal fragment, and GCP cDNA. Transcripts of KAT1 (At5g46240), HIC (AT2g46720), CA (AT3G01500), CAB2 (At1g29920), and ACT8 (At1g49240) were amplified in the linear range from the fold dilution of cDNA indicated. Minus RT and primerless controls were included for all PCR reactions, and the identities of the PCR products were confirmed by sequencing. Similar results were obtained in three independent experiments. Abbreviations are described in the text.
By quantifying the amount of GFP measured relative to actin in each cDNA pool it was possible to estimate the enrichment of cell-type RNA in epidermal fragments and GCP compared to a whole leaf RNA extraction. There was no difference in the amount of GFP relative to actin in whole leaf and epidermal fragment preparations obtained from E1728 whereas the ratio of GFP:ACTIN8 was four times greater in GCP preparations of E1728 (Fig. 6B, C). Therefore, guard cell RNA was enriched compared with the total pool in GCP preparations, but not in epidermal fragments.
As a confirmation of the GFP tracking experiment, the expression levels of guard cell and mesophyll marker transcripts were characterized using semi-quantitative RT-PCR analysis of serial dilutions of whole leaf and guard cell cDNA (Pandey et al., 2002). It was found that neither KAT1 nor HIC were greatly enriched in epidermal fragment cDNA pools compared with whole leaf cDNA pools (Fig. 6D) whereas both KAT1 and HIC were enriched in GCP relative to whole leaf cDNA pools. When normalized to ACT8 expression levels, KAT1 expression was, on average, 2.8-fold higher in 5–50× guard cell protoplast cDNA dilutions compared with whole leaf samples (Fig. 6D). This level of KAT1 enrichment was similar to that reported by Pandey et al. (2002). HIC expression in guard cell protoplasts was, on average, 72-fold higher than in whole leaf samples. In addition, the levels of CAB2 and CA were considerably lower in guard cell protoplast samples than in leaf samples (Fig. 6D). Collectively, the RT-PCR results indicated that protoplasting, unlike epidermal fragmentation, yielded a significantly enriched pool of guard cell RNA that was relatively free of mesophyll, vasculature, and trichrome cell RNA contamination.
Discussion
The identification and characterization of guard cell GFP enhancer trap lines are reported here and their utility in tracking the contribution of guard cells to complex samples is demonstrated. With the exception of E1728, all of the lines initially selected for study had GFP expression in multiple cell/ tissue types (Table 1). This was not unexpected as many of the lines in the Haseloff GAL4 GFP enhancer trap database were initially selected for in a root GFP screen (Laplaze et al., 2005), and all lines contained more than one T-DNA insert. The presence of multiple inserts may account for the disappearance of GFP in antibiotic-resistant individuals and between generations in many of the lines, as the probability of post-transcriptional gene silencing (PTGS; Fagard and Vaucheret, 2000) and transcriptional gene silencing (TGS; Fagard and Vaucheret, 2000) increases with increasing copy number of highly expressed transgenes (Lechtenberg et al., 2003). This appears to be supported by our observation that the four lines stably expressing GFP had 1–2 inserts, while those with variable GFP expression had up to nine inserts. The findings of Lechtenberg et al., (2003) that different transgene sequences appear to have different thresholds at which PTGS occurs may also account for the persistence of antibiotic resistance in plants in which no GFP expression was detected. Our data therefore indicate that determination of the number of inserts may be a useful initial step in future screens for stable GFP expressing lines.
However, not all unstable GFP expression patterns were attributable to gene silencing. The disappearance of GFP expression in some lines followed a clear developmental progression. In line E2306, for example, GFP expression appeared to track stomatal development (Fig. 1). Stomatal development begins with the formation of a meristemoid mother cell (MMC), a stem cell committed to the stomatal pathway that undergoes division to produce a small meristemoid cell, and a larger neighbour cell (Nadeau and Sack, 2003). In E2306, the appearance of the meristemoid was marked by the activation of GFP expression (Fig. 1). GFP expression was maintained through the differentiation of the guard mother cell (GMC), into the guard cells that delimit the stomatal pore, but disappeared entirely in the mature guard cells (Fig. 1). Consequently, E2306 may be useful as a marker of stomatal development and as a tool to mis-target genes during early stomatal development.
Cary et al. (2002) demonstrated that the expression of the CUP SHAPED COTYLEDON1 (CUC1) gene flanking the T-DNA insert in the GAL4 GFP enhancer trap line M0233 replicated the GFP expression pattern. However, our results, consistent with published guard cell microarray data (Leonhardt et al., 2004; Yang et al., 2008), indicated that the expression of flanking genes did not mirror the patterns of GFP expression in any of the four lines studied (Fig. 3). A similar result has been reported by Tsugeki and Fedoroff (1999) who demonstrated that ROOT CAP 1 (RCP1), a gene adjacent to the insert in an enhancer trap line with GUS activity specifically in root cap cells, was expressed throughout the roots and shoots. Instead, fusion of the genomic DNA adjacent to the insert in the enhancer trap line resulted in root cap-specific reporter gene expression (Tsugeki and Fedoroff, 1999). Likewise, our analysis indicated that elements in the intergenic region neighbouring the insert in E1728 may be responsible for the observed guard cell-specific GFP expression pattern since fusion of a DNA fragment incorporating the genomic DNA adjacent to the T-DNA insert in E1728 and the GAL4 TATA box to the uidA reporter gene resulted in strong GUS activity in guard cells (Fig. 3L–O).
Motif analysis of the intergenic region upstream of the insert in E1728 revealed the presence of at least eight putative Dof transcription factor binding sites. Dof (DNA binding with one finger) transcription factors are a group of transcription factors found exclusively in plants (for a review, see Yanagisawa, 2002). Dof transcription factors are thought to regulate plant-specific genes and mediate responses to plant-specific signals (Yanagisawa, 2002) including regulation of guard cell-specific gene expression (Plesch et al., 2001; Galbiati et al., 2008; Yang et al., 2008). Short DNA fragments encompassing a cis-acting regulatory DNA sequence bound by Dof transcription factors, (T/A)AAAG, were necessary and sufficient for directing guard cell-specific reporter gene expression (Plesch et al., 2001). Moreover, a Dof transcription factor, StDof1, expressed in potato epidermal fragments, interacts in a sequence-specific manner with a DNA fragment incorporating the TAAAG cis-acting regulatory sequence (Plesch et al., 2001). Dof binding sites have also been identified upstream of guard cell-specific gene traps (Galbiati et al., 2008) and a number of guard cell-expressed genes (Cominelli et al., 2005; Liang et al., 2005; Yang et al., 2008). Collectively, this suggests that the Dof motifs in the DNA upstream of the insert in E1728 might be responsible for driving guard cell GFP expression in E1728. Interestingly, deletion of a single distal Dof binding site terminated GUS expression driven by the DNA fragment upstream of the insert in E1728. This may reflect a requirement for a specific number of Dof binding sites in order to drive GFP expression. This is consistent with the observation of Plesch et al. (2001) that deletion of two of the three TATA box-proximal (T/A)AAAG elements in the KST1 promoter resulted in a 35–40% reduction in the number of independent transgenic lines with GUS activity in guard cells. It is unclear whether the putative guard cell elements identified in E1728 represent either genuine plant enhancer elements which activate expression of an endogenous plant gene in a distance and orientation independent manner, or whether they represent ‘cryptic promoters’ which are not necessarily involved in the regulation of plant gene expression, but which drive expression of reporter genes when placed in close proximity to a TATA box (Plesch et al., 2000).
In addition to their utility as markers of molecular determinants, GFP expressing lines are useful in tracking individual cell types in vitro during purification (Birnbaum et al., 2003, 2005). The isolation of guard cells from Arabidopsis is particularly problematic (Pandey et al., 2002), but these difficulties have been overcome to some extent by using either epidermal fragmentation or GCP purification. Epidermal fragmentation has been used to study genes involved in the ABA and H2O2 responses of stomatal guard cells of A. thaliana (Hugouvieux et al., 2001; Kwak et al., 2001, 2002; Zimmermann et al., 2001; Desikan et al., 2005). The method circumvents the lengthy digestion times used for guard cell protoplasting and the changes in gene expression that occur as a result (Grosset et al., 1990; Leonhardt et al., 2004). However, the results indicate that RNA obtained via the epidermal fragmentation method might be heavily contaminated with vascular tissue RNA and, to a lesser extent, trichome RNA (Fig. 6B, C). In addition, GFP was not enriched in epidermal fragments from E1728 (Fig 6B, C) and the guard cell markers KAT1 and HIC1 had low expression in epidermal fragments (Fig. 6D). This was despite being able to obtain epidermal fragments with similar purity on a cell count basis to that achieved in other studies (Fig. 5D; Hugouvieux et al., 2001; Zimmermann et al., 2001; Kwak et al., 2002; Desikan et al., 2005). The purity of guard cell samples is of particular importance, as even small contaminants have been shown to generate misleading results (Outlaw et al., 1981). Our findings therefore suggest that epidermal fragmentation of Arabidopsis is unlikely to yield enriched guard cell RNA and that the RNA is contaminated by other cell types. It is demonstrated that GCP purification, by contrast, results in enriched guard cell RNA of high purity. However, care must be taken to control for changes in gene expression caused by protoplasting (Leonhardt et al, 2004). A promising alternative to both methods is laser capture microdissection (LCM; Asano et al., 2002; Kerk et al, 2003; Nakazono et al., 2003; Casson et al., 2005; Galbiati et al., 2008) which, when coupled to T7 linear RNA amplification (Van Gelder et al., 1990) and microarray analysis, may assist in the elucidation of the molecular components underlying guard cell physiology. It is probable that GFP enhancer trap lines such as those detailed in this report may have considerable utility in advancing these methods. Lines JR11-2, KC274, KC380, and KC464, which display GFP expression in mesophyll cells, vascular tissue, trichomes, and epidermal cells, may be used to assess the extent of the contamination of captured material by other cell types, while the guard cell GAL4 GFP lines may be used to confirm the successful capture of guard cells by LCM. Thus, the lines provide a simple measure by which the efficiency of various LCM protocols may be assessed during optimization of the method.
This report details the characterization of guard cell GAL4 GFP enhancer trap lines, and shows that although enhancer trap lines may be used directly for the identification of cell/tissue-specific genes and/or enhancer elements, the efficiency of the discovery process is relatively low. Instead, the lines appear to have greater utility in allowing the tracking of guard cells during development and through isolation procedures. As an illustration of this, use of the lines revealed that a common method of guard cell isolation may not yield samples of sufficient purity and should be re-examined in greater detail. It is hoped that the lines detailed here will aid future attempts to elucidate the molecular features governing the behaviour of stomatal guard cells.
Supplementary data
Supplementary data can be found at JXB online.
Primers used in TAIL PCR, cloning and RT-PCR are provided as supplementary material in Tables S1, S2, and S3, respectively. The positions and orientations of the T-DNA insertions are summarized in Fig. S1. Fragments used in the deletion analysis of the genomic DNA upstream of the T-DNA in E1728 are shown in Fig. S2.
Acknowledgments
We are grateful to Dr John Carr and Dr Kate Clark (University of Cambridge) for the donation of the tissue-specific GFP lines; to Professor Julie Gray (University of Sheffield) for assistance with the epidermal fragmentation protocol and for sharing unpublished data; and to the BBSRC UK, the Royal Society of London, the Gates Cambridge Trust, and Corpus Christi College Cambridge for funding.
References
- Anderson JA, Huprikar SS, Kochian LV, Lucas WJ, Gaber RF. Functional expression of a probable Arabidopsis thaliana potassium channel in Saccharomyces cerevisiae. Proceedings of the National Academy of Sciences, USA. 1992;89:3736–3740. doi: 10.1073/pnas.89.9.3736. [DOI] [PMC free article] [PubMed] [Google Scholar]
- Ausubel FM, Brent R, Kingston RE, Moore DD, Seidman JG, Smith JA, Struhl K. Short protocols in molecular biology. New York: John Wiley and Sons; 1999. [Google Scholar]
- Asano T, Masumura T, Kusano H, Kikuchi S, Kurita A, Shimada H, Kadowaki K. Construction of a specialized cDNA library from plant cells isolated by laser capture microdissection: toward comprehensive analysis of the genes expressed in the rice phloem. The Plant Journal. 2002;32:401–408. doi: 10.1046/j.1365-313x.2002.01423.x. [DOI] [PubMed] [Google Scholar]
- Baxter-Burrell A, Chang R, Springer P, Bailey-Serres J. Gene and enhancer trap transposable elements reveal oxygen deprivation-regulated genes and their complex patterns of expression in Arabidopsis. Annals of Botany. 2003;91:129–141. doi: 10.1093/aob/mcf119. [DOI] [PMC free article] [PubMed] [Google Scholar]
- Birnbaum K, Jung JW, Wang JY, Lambert GM, Hirst JA, Galbraith DW, Benfey PN. Cell type-specific expression profiling in plants via cell sorting of protoplasts from fluorescent reporter lines. Nature Methods. 2005;2:615–619. doi: 10.1038/nmeth0805-615. [DOI] [PubMed] [Google Scholar]
- Birnbaum K, Shasha DE, Wang JY, Jung JW, Lambert GM, Galbraith DW, Benfey PN. A gene expression map of the Arabidopsis root. Science. 2003;302:1956–1960. doi: 10.1126/science.1090022. [DOI] [PubMed] [Google Scholar]
- Blackwood EM, Kadonaga JT. Going the distance: a current view of enhancer action. Science. 1998;281:60–63. doi: 10.1126/science.281.5373.60. [DOI] [PubMed] [Google Scholar]
- Boorse G, Tallman G. Guard cell protoplasts. Isolation, culture, and regeneration of plants. Methods in Molecular Biology. 1999;111:243–257. doi: 10.1385/1-59259-583-9:243. [DOI] [PubMed] [Google Scholar]
- Cary AJ, Che P, Howell SH. Developmental events and shoot apical meristem gene expression patterns during shoot development in Arabidopsis thaliana. The Plant Journal. 2002;32:867–877. doi: 10.1046/j.1365-313x.2002.01479.x. [DOI] [PubMed] [Google Scholar]
- Casson S, Spencer M, Walker K, Lindsey K. Laser capture microdissection for the analysis of gene expression during embryogenesis of Arabidopsis. The Plant Journal. 2005;42:111–123. doi: 10.1111/j.1365-313X.2005.02355.x. [DOI] [PubMed] [Google Scholar]
- Clough SJ, Bent AF. Floral dip: a simplified method for Agrobacterium-mediated transformation of Arabidopsis thaliana. The Plant Journal. 1998;16:735–743. doi: 10.1046/j.1365-313x.1998.00343.x. [DOI] [PubMed] [Google Scholar]
- Cominelli E, Galbiati M, Vavasseur A, Conti L, Sala T, Vuylsteke M, Leonhardt N, Dellaporta SL, Tonelli C. A guard-cell-specific MYB transcription factor regulates stomatal movements and plant drought tolerance. Current Biology. 2005;15:1196–1200. doi: 10.1016/j.cub.2005.05.048. [DOI] [PubMed] [Google Scholar]
- Desikan R, Hancock JT, Bright J, Harrison J, Weir L, Hooley R, Neill SJ. A role for ETR1 in hydrogen peroxide signaling in stomatal guard cells. Plant Physiology. 2005;137:831–834. doi: 10.1104/pp.104.056994. [DOI] [PMC free article] [PubMed] [Google Scholar]
- Dodd AN, Jakobsen MK, Baker AJ, Telzerow A, Hou S-W, Laplaze L, Barrot L, Poethig RS, Haseloff JP, Webb AAR. Time of day modulation of Ca2+ signals in Arabidopsis. The Plant Journal. 2006;48:962–973. doi: 10.1111/j.1365-313X.2006.02933.x. [DOI] [PubMed] [Google Scholar]
- Fagard M, Vaucheret H. (Trans)gene silencing in plants: how many mechanisms? Annual Review of Plant Physiology and Plant Molecular Biology. 2000;51:167–194. doi: 10.1146/annurev.arplant.51.1.167. [DOI] [PubMed] [Google Scholar]
- Galbiati M, Simoni L, Pavesi G, Cominelli E, Francia P, Vavasseur A, Nelson T, Bevan M, Tonelli C. Gene trap lines identify Arabidopsis genes expressed in stomatal guard cells. The Plant Journal. 2008;53:750–762. doi: 10.1111/j.1365-313X.2007.03371.x. [DOI] [PubMed] [Google Scholar]
- Gray JE, Holroyd GH, van der Lee FM, Bahrami AR, Sijmons PC, Woodward FI, Schuch W, Hetherington AM. The HIC signalling pathway links CO2 perception to stomatal development. Nature. 2000;408:713–716. doi: 10.1038/35047071. [DOI] [PubMed] [Google Scholar]
- Grosset J, Marty I, Chartier Y, Meyer Y. Messenger RNAs newly synthesized by tobacco mesophyll protoplasts are wound inducible. Plant Molecular Biology. 1990;15:485–496. doi: 10.1007/BF00019165. [DOI] [PubMed] [Google Scholar]
- Haseloff J. GFP variants for multispectral imaging of living cells. Methods in Cell Biology. 1999;58:139–151. doi: 10.1016/s0091-679x(08)61953-6. [DOI] [PubMed] [Google Scholar]
- He Y, Tang W, Swain JD, Green AL, Jack TP, Gan S. Networking senescence-regulating pathways using Arabidopsis enhancer trap lines. Plant Physiology. 2001;126:707–716. doi: 10.1104/pp.126.2.707. [DOI] [PMC free article] [PubMed] [Google Scholar]
- Hetherington AM, Woodward FI. The role of stomata in sensing and driving environmental change. Nature. 2003;424:901–908. doi: 10.1038/nature01843. [DOI] [PubMed] [Google Scholar]
- Hugouvieux V, Kwak JM, Schroeder JI. An mRNA cap binding protein, ABH1, modulates early abscisic acid signal transduction in Arabidopsis. Cell. 2001;106:477–487. doi: 10.1016/s0092-8674(01)00460-3. [DOI] [PubMed] [Google Scholar]
- Kerk NM, Ceserani T, Tausta SL, Sussex IM, Nelson TM. Laser capture microdissection of cells from plant tissues. Plant Physiology. 2003;132:27–35. doi: 10.1104/pp.102.018127. [DOI] [PMC free article] [PubMed] [Google Scholar]
- Kiegle E, Moore C, Haseloff J, Tester M, Knight M. Cell-type specific calcium responses to drought, NaCl, and cold in Arabidopsis root: a role for endodermis and pericycle in stress signal transduction. The Plant Journal. 2000;23:267–278. doi: 10.1046/j.1365-313x.2000.00786.x. [DOI] [PubMed] [Google Scholar]
- Kopka J, Provart NJ, Müller-Röber B. Potato guard cells respond to drying soil by a complex change in the expression of genes related to carbon metabolism and turgor regulation. The Plant Journal. 1997;11:871–882. doi: 10.1046/j.1365-313x.1997.11040871.x. [DOI] [PubMed] [Google Scholar]
- Kwak JM, Moon J-H, Murata Y, Kuchitsu K, Leonhardt N, DeLong A, Schroeder JI. Disruption of a guard cell-expressed protein phosphatase 2A regulatory subunit, RCN1, confers abscisic acid insensitivity in Arabidopsis. The Plant Cell. 2002;14:2849–2861. doi: 10.1105/tpc.003335. [DOI] [PMC free article] [PubMed] [Google Scholar]
- Kwak JM, Murata Y, Baizabal-Aguirre VM, Merrill J, Wang M, Kemper A, Hawke SD, Tallman G, Schroeder JI. Dominant negative guard cell K+ channel mutants reduce inward-rectifying K+ currents and light-induced stomatal opening in Arabidopsis. Plant Physiology. 2001;127:473–485. [PMC free article] [PubMed] [Google Scholar]
- Laplaze L, Parizot B, Baker A, Ricaud L, Martiniere A, Auguy F, Franche C, Nussaume L, Bogusz D, Haseloff J. GAL4-GFP enhancer trap lines for genetic manipulation of lateral root development in Arabidopsis thaliana. Journal of Experimental Botany. 2005;56:2433–2442. doi: 10.1093/jxb/eri236. [DOI] [PubMed] [Google Scholar]
- Lechtenberg B, Schubert D, Forsbach A, Gils M, Schmidt R. Neither inverted repeat T-DNA configurations nor arrangements of tandemly repeated transgenes are sufficient to trigger transgene silencing. The Plant Journal. 2003;34:507–517. doi: 10.1046/j.1365-313x.2003.01746.x. [DOI] [PubMed] [Google Scholar]
- Leonhardt N, Kwak JM, Waner D, Robert N, Leonhardt G, Schroeder JI. Microarray expression analyses of Arabidopsis guard cells and isolation of a recessive abscisic acid hypersensitive protein phosphatase 2C mutant. The Plant Cell. 2004;16:596–615. doi: 10.1105/tpc.019000. [DOI] [PMC free article] [PubMed] [Google Scholar]
- Leung J, Merlot S, Giraudat J. The Arabidopsis ABSCISIC ACID-INSENSITIVE (ABI2) and ABI1 genes encode homologous protein phosphatases 2C involved in abscisic acid signal transduction. The Plant Cell. 1997;9:759–771. doi: 10.1105/tpc.9.5.759. [DOI] [PMC free article] [PubMed] [Google Scholar]
- Liang YK, Dubos C, Dodd IC, Holroyd GH, Hetherington AM, Campbell MM. AtMYB61, an R2R3-MYB transcription factor controlling stomatal aperture in Arabidopsis thaliana. Current Biology. 2005;15:1201–1206. doi: 10.1016/j.cub.2005.06.041. [DOI] [PubMed] [Google Scholar]
- Liu Y-G, Whittier RF. Thermal asymmetric interlaced PCR: automatable amplification and sequencing of insert end fragments from P1 and YAC clones for chromosome walking. Genomics. 1995;25:674–681. doi: 10.1016/0888-7543(95)80010-j. [DOI] [PubMed] [Google Scholar]
- Nadeau JA, Sack FD. Stomatal development: cross talk puts mouths in place. Trends in Plant Science. 2003;8:294–299. doi: 10.1016/S1360-1385(03)00102-X. [DOI] [PubMed] [Google Scholar]
- Nakamura RL, McKendree WLJ, Hirsch RE, Sedbrook JC, Gaber RF, Sussman MR. Expression of an Arabidopsis potassium channel gene in guard cells. Plant Physiology. 1995;109:371–374. doi: 10.1104/pp.109.2.371. [DOI] [PMC free article] [PubMed] [Google Scholar]
- Nakazono M, Qiu F, Borsuk LA, Schnable PS. Laser-capture micro dissection, a tool for the global analysis of gene expression in specific plant cell types: identification of genes expressed differentially in epidermal cells or vascular tissue of maize. The Plant Cell. 2003;15:583–596. doi: 10.1105/tpc.008102. [DOI] [PMC free article] [PubMed] [Google Scholar]
- Outlaw WH, Mayne BC, Zenger VE, Manchester J. Presence of both photosystems in guard cells of Vicia faba L. Plant Physiology. 1981;67:12–16. doi: 10.1104/pp.67.1.12. [DOI] [PMC free article] [PubMed] [Google Scholar]
- Pandey S, Wang X-Q, Coursol SA, Assmann SM. Preparation and applications of Arabidopsis thaliana guard cell protoplasts. New Phytologist. 2002;153:517–526. doi: 10.1046/j.0028-646X.2001.00329.x. [DOI] [PubMed] [Google Scholar]
- Plesch G, Ehrhardt T, Müller-Röber B. Involvement of TAAAG elements suggests a role for Dof transcription factors in guard cell-specific gene expression. The Plant Journal. 2001;28:455–464. doi: 10.1046/j.1365-313x.2001.01166.x. [DOI] [PubMed] [Google Scholar]
- Plesch G, Kamann E, Müller-Röber B. Cloning of regulatory sequences mediating guard-cell-specific gene expression. Gene. 2000;249:83–89. doi: 10.1016/s0378-1119(00)00150-5. [DOI] [PubMed] [Google Scholar]
- Schroeder JI, Allen GJ, Hugouvieux V, Kwak JM, Waner D. Guard cell signal transduction. Annual Review of Plant Physiology and Plant Molecular Biology. 2001;52:627–658. doi: 10.1146/annurev.arplant.52.1.627. [DOI] [PubMed] [Google Scholar]
- Struhl K. A paradigm for precision. Science. 2001;293:1054–1055. doi: 10.1126/science.1064050. [DOI] [PubMed] [Google Scholar]
- Swaminathan K, Yang Y, Grotz N, Campisi L, Jack T. An enhancer trap line associated with a D-class cyclin gene in Arabidopsis. Plant Physiology. 2000;124:1658–1667. doi: 10.1104/pp.124.4.1658. [DOI] [PMC free article] [PubMed] [Google Scholar]
- Tsugeki R, Fedoroff NV. Genetic ablation of root cap cells in Arabidopsis. Proceedings of the National Academy of Sciences, USA. 1999;96:12941–12946. doi: 10.1073/pnas.96.22.12941. [DOI] [PMC free article] [PubMed] [Google Scholar]
- Ulmasov T, Murfett J, Hagen G, Guilfoyle TJ. Aux/IAA proteins repress expression of reporter genes containing natural and highly active synthetic auxin response elements. The Plant Cell. 1997;9:1963–1971. doi: 10.1105/tpc.9.11.1963. [DOI] [PMC free article] [PubMed] [Google Scholar]
- Van Gelder RN, von Zastrow ME, Yool A, Dement WC, Barchas JD, Eberwine JH. Amplified RNA synthesized from limited quantities of heterogeneous cDNA. Proceedings of the National Academy of Sciences, USA. 1990;87:1663–1667. doi: 10.1073/pnas.87.5.1663. [DOI] [PMC free article] [PubMed] [Google Scholar]
- Webb ARR, Baker AJ. Stomatal biology: new techniques and new challenges. New Phytologist. 2002;153:365–369. doi: 10.1046/j.0028-646X.2001.00347.x. [DOI] [PubMed] [Google Scholar]
- Willmer CM, Sexton R. Stomata and plasmodesmata. Protoplasma. 1979;100:113–124. [Google Scholar]
- Yanagisawa S. The Dof family of plant transcription factors. Trends in Plant Science. 2002;12:555–560. doi: 10.1016/s1360-1385(02)02362-2. [DOI] [PubMed] [Google Scholar]
- Yang Y, Costa A, Leonhardt N, Siegel RS, Schroeder JI. Isolation of a strong Arabidopsis guard cell promoter and its potential as a research tool. Plant Methods. 2008;4:6. doi: 10.1186/1746-4811-4-6. doi:10.1186/1746-4811-4-6. [DOI] [PMC free article] [PubMed] [Google Scholar]
- Zeiger E, Hepler PK. Production of guard cell protoplast/s from onion and tobacco. Plant Physiology. 1976;58:492–498. doi: 10.1104/pp.58.4.492. [DOI] [PMC free article] [PubMed] [Google Scholar]
- Zimmermann S, Hartje S, Ehrhardt T, Plesch G, Müller-Röber B. The K+ channel SKT1 is co-expressed with KST1 in potato guard cells: both channels can co-assemble via their conserved KT domains. The Plant Journal. 2001;28:517–527. doi: 10.1046/j.1365-313x.2001.01177.x. [DOI] [PubMed] [Google Scholar]
Associated Data
This section collects any data citations, data availability statements, or supplementary materials included in this article.