

Abstract
Detecting small molecular targets such as metal ions is just as important as detecting large molecules such as DNA, RNA and proteins, but the field of metal ion sensors has not yet been well developed. A good example of a metal ion target is mercury, which is highly toxic, widely distributed in the environment and affects human health. To develop a diagnostic platform for metal ions, we demonstrate that functional DNA-linked gold nanoparticles (AuNPs) can quickly and simply detect and quantify Hg2+ ions in aqueous solution, with high sensitivity and selectivity over competing metal ions. A linker DNA molecule containing thymine residues and sequences complementary to the DNA on the AuNPs was designed to aggregate DNA-functionalized AuNPs. When Hg2+ ions were introduced into this system, they induced the linker DNA to fold by forming thymine–Hg2+–thymine bonds. The linker DNA’s folding caused the AuNPs to rapidly disassemble, which caused a discernable color change in the solution from purple to red. The limit of detection for Hg2+ in the present method is 5.4 nM, which is below the 10 nM maximum contaminant level defined by the US Environmental Protection Agency (EPA) for drinking water. Our results show that this Hg2+ detection method has excellent selectivity over other divalent metal ions (e.g. Pb2+, Cu2+, Mn2+, Co2+, Zn2+, Cd2+, Mg2+, Ca2+, and Ba2+). This system has been converted into a dipstick test using lateral-flow devices, making it even more practical for point-of-care diagnostics.
1. Introduction
Importance of detecting small-molecule targets
Novel analytical techniques improve diagnostics and theranostics for applications in healthcare and related fields.1–3 In contrast to the tremendous progress in nucleic acid and protein detection, small-molecule analysis of disease markers and inorganic or organic cofactors in biological pathways, has lagged behind.4–6 These targets are just as important as their larger counterparts, as they play critical roles in biological function and disease development. For example, for many years a protein-based marker called prostate-specific antigen (PSA) has been used as a marker for prostate cancer.7 However, it has been recognized that PSA is a poor marker for the disease because it gives high rates of false positives and false negatives.8 On the other hand, a recent report demonstrated that sacrosine, a small organic molecule similar to glycine, may be a better marker for the onset of prostate cancer than PSA.9 Therefore, detecting small-molecule targets is a major but exciting challenge in bioanalytical chemistry and medical diagnostics.
Importance of detecting small-molecule targets such as metal ions
Among the small-molecule targets, metal ions such as calcium or iron are known to benefit human health while other metal ions, such as lead and mercury, are deleterious. With the exception of a few metal ions such as calcium, we know very little about the mechanisms by which metal ions are transported into cells, speciated into different forms, and enabled to carry out their beneficial or deleterious functions.10 Tsien and others’ calcium sensors are an excellent example of how metal ion sensors can revolutionize biochemistry, cellular biology, and related fields.11
Challenges in detecting small-molecule targets such as metal ions
More than half of the elements in the periodical table form metal ions that are found in biological systems and the environment, and some metals form many different oxidation states. Unlike nucleic acid and protein detection where nucleic acid or antibody arrays can be used to detect almost any biomolecular target, there are few general sensing strategies that can be used to produce a sensor for any metal ion or a specific oxidation state of a given metal ion.12 Antibodies that can be raised against large molecular targets such as proteins often fail to recognize metal ions; they are too small to elicit a strong immunological response, and some metal ions are too toxic for animals or cells to produce antibodies against them.13 Recently, several whole-cell bacterial biosensors were developed to detect metal ions such as mercury. However, most of them were insufficiently selective.14,15 Also, whole-cell biosensors are limited by the expense, fragility, growth requirements of cells, and the specialized training needed to handle them.16,17
Functional DNA or RNA as an excellent alternative in detecting small-molecule targets such as metal ions
Functional DNA and RNA are nucleic acids with either enzymatic or specific binding activities.18 Examples of functional DNA include ribozymes and deoxyribo-zymes (also called DNAzymes), which are similar to protein enzymes, and ribos-witches and aptamers, which are similar to antibodies. Ribozymes and riboswitches have been isolated from cells while DNAzymes and DNA aptamers are obtained by in vitro selection19,20 or Systematic Evolution of Ligands by Exponential Enrichment (SELEX).21,22 The selection process can be tailored to obtain functional DNA or RNA to bind almost any target of interest, making it, like antibody selection, a general method for sensing molecules.23 Unlike antibody selection, however, these functional DNA and RNA molecules have been shown to bind selectively not only to large molecules, but also to small-molecule targets, with affinities down to the picomolar range for the dissociation constant. In particular, functional DNA molecules are much more stable than antibodies and can be denatured and renatured many times without losing their function.12 Because of these advantages, we and others have developed functional nucleic acid sensors for a wide range of targets including metal ions, small organic molecules, proteins, and cells.18 By combining the functional DNA with fluorophores/quenchers, gold nanoparticles, carbon nanotubes, quantum dots, and iron oxide nanoparticles, we and others have developed highly sensitive and selective, fluorescent, colorimetric, and electrochemical sensors and MRI contrast agents, with detection limits as low as 45 pM (11 ppt) and over million-fold selectivities.24–28
Functional DNA sensors for mercury
Mercury is a highly toxic heavy metal ion that can cause a number of severe adverse health effects such as damage to the nervous, immune, and excretory systems. Sensors that can detect mercury in situ and in real time can greatly increase our understanding of its toxicity and prevent its toxic effects. Toward this goal, we have designed a highly sensitive and selective catalytic beacon sensor for Hg2+ using the thymine–mercury–thymine interaction to modulate DNAzyme activities through allosteric interactions (Fig. 1a).29 Its detection limit of 2.4 nM is lower than the 10 nM maximum contamination level defined by the US EPA for drinking water. We then further simplified the sensor by using the thymine–mercury–thymine interaction without the DNAzyme to create a “turn-on” fluorescent sensor for mercury. This only slightly changed the sensor’s properties, giving it a detection limit of 3.2 nM and high selectivity (Fig. 1b).27 In addition to DNA molecules, we also used proteins in lysozyme-stabilized gold fluorescent clusters Hg2+ sensors, which also had a similar detection limit (10 nM) (Fig. 1c).30 These results complement those of other groups who have developed Hg2+ sensors using functional DNA and lyso-zyme-stabilized gold fluorescent clusters.31–35 Finally, we also developed a Hg2+ theranostic agent that can simultaneously detect and detoxify mercury using an ion-responsive poly(ethylene glycol) (PEG) liposome (Fig. 1d).36 Since the distribution of mercury in a patient can be location- and time-specific, treating a patient exposed to Hg2+ can be challenging. Using a Hg2+ detoxification agent at too high a concentration can lead to side-effects, and in any case a single dose of such an agent may be inefficient in dealing with the Hg2+ concentration distribution throughout the patient’s tissues. The novel liposome-based system shown in Fig. 1d can detect and respond to Hg2+ at concentrations as low as 10 nM. This system adjusts the release of Hg2+ chelators to the local concentration of Hg2+, releasing more chelators in regions of high Hg2+ concentration and no chelators in regions of low concentration. This “budgeted” release profile will be particularly useful in situations where the local Hg2+ contamination levels vary, or fluctuate over time.
Fig. 1.

Schematic illustration of sensors and theranostic agents for mercury. a) A mercury sensor based on allosteric enhancement of uranium-specific DNAzyme activity by Hg2+ binding.29 b) A simplified “turn-on” mercury sensor based on structure-switching DNA that releases quencher-modified DNA in the presence of Hg2+.27 c) A lysozyme-stabilized gold fluorescent cluster as a Hg2+ sensor.30 d) A theranostic agent for Hg2+ based on Hg2+-responsive PEG-liposomes that results in the release of both fluorescent probe and detoxifying agent.36
Developing dipstick tests for small-molecule targets such as metal ions
While these functional nucleic acid sensors are useful as analytical tools to understand biological systems and serve as diagnostics and theranostics in healthcare, they are not without their limitations. For example, the techniques described thus far require the precise transfer of solutions containing reagents,18 and thus are not suitable to address a major unmet need in healthcare: rapid, on-site and real-time detection and quantification of small-molecule targets. To overcome this limitation, we have transformed the functional nucleic acid sensors into dipstick tests using lateral-flow devices.37,38 Similar to a pregnancy test that uses antibodies as the diagnostic agent, we used aptamers and DNAzymes that are much more stable than antibodies, and gold nanoparticles (AuNPs) whose extinction coefficient is 10–100 times greater than the most intense organic dyes currently used in commercial dipstick tests.39 More importantly, we took advantage of the distance-dependent color changes of AuNPs that are due to surface plasmon effects. As a result, when the target is absent, the aggregated AuNPs will appear blue, but when the target is introduced the AuNPs will appear red.38 While this unique concept made adenosine and cocaine detection in aptamer-AuNP-based lateral flow devices possible, it has not been feasible to detect metal ions using an analogous DNAzyme system. Instead, AuNPs serve only as a color-labeling agent.37,40 To take full advantage of the distance-dependent optical changes of AuNPs, we herein describe a new dipstick test that changes color in the presence of mercury.
2. Experimental
Materials
All DNA samples were purchased from Integrated DNA Technologies, Inc. (Coral-ville, IA). The linker DNA was purified by gel electrophoresis, whereas the thiol-modified DNA molecules were purified by HPLC. Streptavidin was purchased from Promega. AuNPs that were 13 nm in diameter were synthesized by the citrate-reduction method.41 Thiol-modified DNA was activated with two equivalents of tris(2-carboxyethyl) phosphine hydrochloride (TCEP). The TCEP-activated, thiol-modified DNA and AuNPs were mixed at room temperature for at least 16 h. (typically 9 μL of 1 mM DNA was added to 3 mL of AuNPs), and NaCl (100 mM) was added to the solution. The solution was left at room temperature for another two days, and the DNA-functionalized AuNPs were purified by centrifugation and removal of the supernatant before use.
Sensor preparation
Solutions of thiol-modified DNA AuNPs were mixed in the presence of NaNO3 (300 mM), MOPS (3-(N-morpholino) propanesulfonic acid) buffer (10 mM, pH 7.2), and 45-mer linker DNA (varying concentrations). The samples were annealed by heating at 75 °C for 2 min, cooling down to room temperature over ~1 h, and then being stored at 4 °C for 2 h. The AuNPs aggregated and changed color from red to purple during this process. The samples were centrifuged, and the precipitates were collected and dispersed in a buffer containing 150 mM NaNO3; 10 mM MOPS; pH 7.2.
Dipstick test sample preparation
The Millipore Hi-Flow Plus Assembly Kit (Millipore Corporation, Bedford, MA) was used. The kit contains a Hi-Flow Plus Cellulose Ester Membrane with a nominal capillary flow time of 240 s/4 cm, an absorption pad, wicking, and a glass fiber conjugation pad. The device assembly is shown in Fig. 2b. One DNA arm contains a biotin moiety at the 5′-end while the other does not. The purified AuNP aggregates were dispersed in designated buffer solutions (8% sucrose, 150 mM NaNO3, 10 mM MOPS; pH 7.2) and agitated vigorously with a pipette. AuNP aggregates (4 mu;L) were spotted onto each conjugation pad, and 10 mg mL−1 streptavidin (1.5 μL) was applied to the membrane by a 2 μL pipette to form a thin line. The loaded strips were stored in a drawer overnight before use.
Fig. 2.

Design of a colorimetric dipstick sensor for mercury. a) A schematic representation of the colorimetric detection of Hg2+. In the DNA sequences, A12 in DNA1 (purple) denotes a 12-mer polyadenine chain and biotin is denoted as a black star ( ). AuNPs 1 and 2 are functionalized with two different DNA molecules through thiol-gold chemistry. The two kinds of AuNP are linked by 45-mer linker DNA strand (in black) containing several thymine residues (in pink). In the presence of Hg2+, the aggregates disassemble to give dispersed red AuNPs. b) Assembled lateral-flow device loaded with AuNP aggregates (on the conjugation pad) and streptavidin (on the membrane in cyan) before use. c) Negative control. In the absence of Hg2+, unreacted AuNP aggregates stagnate on the boundary between the conjugation pad and the membrane. d) Positive test. In the presence of Hg2+, AuNP aggregates disassemble and the dispersed AuNP products migrate, when they are captured at the test zone through the biotin–streptavidin interaction, a red line forms.
Detection
To detect Hg2+ using a solution-based sensor, a small volume of concentrated Hg2+ solution was added to 100 μL of the AuNP-aggregate suspension. The ensuing color change was monitored with a UV–vis spectrophotometer (Hewlett-Packard 8453) at room temperature. For dipstick tests, varying concentrations Hg2+ were dissolved in a flow buffer containing 150 mM NaNO3 and 10 mM MOPS at pH 7.2. The wicking pad of each device was dipped into the solutions for approximately two minutes to fully hydrate the conjugation pad, and the liquid began migrating on the membrane. Then the device was placed horizontally on a plastic surface for the flow to continue. A digital camera was used to take pictures of the devices after approximately 10 min.
3. Results and discussion
We constructed a colorimetric mercury sensor as shown in Fig. 2a. It is based on our recent fluorescent Hg2+ sensor that uses structure-switching DNA and on colorimetric sensors for adenosine and cocaine using aptamers and AuNPs.27,38,42 The sensor system consists of two sets of 13-nm AuNPs, with each set of AuNP function-alized with either DNA1 (in purple) or DNA2 (in blue). A 45-mer linker DNA is then used to bring the two sets of DNA-functionalized AuNPs together. This linker contains three segments. The first segment is complementary to DNA1, the second segment is complementary to DNA2, and the third segment remains in single-stranded form. Critical to this sensor design is the presence of seven thymine–thymine mismatched pairs (T–T shown in pink) separated by five self-complementary base pairs located within the second and third segments of the linker DNA. In this way, the addition of the linker DNA should aggregate the AuNPs functionalized with DNA1 and DNA2 to form blue- or purple-colored aggregates due to the surface plasmon effect. Since Hg2+ is known to form strong thymine–Hg2+–thymine base pairs,31,43 the presence of Hg2+ would induce the folding of the last two segments of the linker DNA into a hairpin structure as shown in Fig. 2a. As a result, only five base pairs would remain between DNA2 and the linker DNA, which is not enough to keep both strands in a stable double-stranded form at room temperature. Therefore, DNA2 and the attached AuNPs would be released from the linker DNA, the AuNPs would disassemble, and their color would change from purple to red. This phenomenon can be monitored by measuring changes in the solution absorbance at 520 and 700 nm, with a high ratio indicating red-colored disassembled AuNPs and a low ratio indicating purple-colored aggregated AuNPs.42
The colorimetric spectra of the sensor system during the four minutes after adding 1.5 μM Hg2+ is shown in Fig. 3a. The assembly of AuNP aggregates was studied using different linker DNA concentrations from 4 nM to 100 nM. The concentration of AuNPs was 8 nM (4 nM each of DNA1- and DNA2-functionalized AuNPs). Although 40 nM of linker DNA was sufficient to aggregate all the AuNPs, AuNPs aggregated with 20 nM of linker DNA were found to be the most sensitive toward Hg2+-induced disassembly. At 20 nM linker DNA, ~ 85% of AuNPs were removed in the form of aggregated particles after 2 min of centrifugation at 400 × g. As a result, each AuNP was connected to the AuNPs by approximately six linker DNA molecules.
Fig. 3.

Kinetics of the color change at various concentrations of Hg2+. a) UV–vis spectra of the colorimetric mercury sensor whilst 1.5 μM of Hg2+ is been added over the course of four minutes. A decrease in the absorbance at 700 nm and an increase at 520 nm is shown. b) The kinetics of the absorbance ratio increase as the Hg2+ concentration increases.
To study the Hg2+-induced disassembly of AuNP aggregates, the sensor solutions were treated with Hg2+ ions of various concentrations and the kinetics of their color changes were monitored by UV–vis spectroscopy (Fig. 3b). Higher concentrations of Hg2+ ions increased the rate at which the solution changed to red. Quantitative analysis was carried out by monitoring the increase in the absorbance ratio four minutes after adding different Hg2+ concentrations. As illustrated in Fig. 4, a linear relationship between the absorbance ratio and Hg2+ concentration was observed in the wide range of Hg2+ concentrations from 0–1500 nM. The sensor has a detection limit of 5.4 nM based on 3σ/slope, which is about two times lower than the maximum contaminant level of 10 nM defined by the US EPA for drinking water. At very low Hg2+ concentrations, because there were around six linkages for each AuNP and each linkage contains seven T–T mismatches, only a small fraction of the AuNPs was released from the aggregates. Therefore, the absorbance ratio could not substantially increase in the presence of the high background absorbance of the remaining aggregates. Despite this limitation, the sensitivity of the current detection system is comparable to our recent fluorescence-based detection method,27 and is greater than those of previously reported Hg2+ sensors.31,44–46
Fig. 4.

Quantifying the Hg2+ concentration by monitoring the absorbance ratio four minutes after adding mercury. The calibration curve of the colorimetric mercury sensor saturated at concentrations higher than 1500 nM. A linear relationship between the absorbance ratio and Hg2+ concentration was observed for a wide concentration range (0–1500 nM). The data were obtained from three independent measurements and the error bars indicate the standard deviation.
To determine the selectivity of the sensor, 1 μM of each metal ion was individually added to the sensor solution and the absorbance ratio change was monitored. As shown in Fig. 5 (blue bars), among the metal ions tested (Zn2+, Pb2+, Cu2+, Co2+, Cd2+, Mn2+, Ba2+, Ca2+, Mg2+and Hg2+), only Hg2+ resulted in a significant increase in the absorbance ratio. In addition, 1 μM of Hg2+ and 1 μM of another divalent metal ion were added together to the sensor solution. The absorbance ratio of the Hg2+–M2+ pair (Fig. 5, red bars) indicates that the sensor has a high selectivity for Hg2+ against a background of competing analytes. The excellent selectivity of the sensor is likely due to the high specificity of the interaction between T–T mismatches and Hg2+ which has been previously demonstrated.47
Fig. 5.
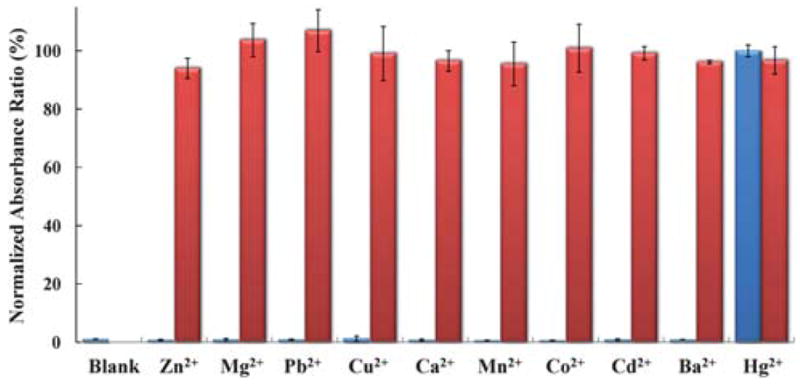
Selectivity of the Hg2+ sensor. Blue bars represent normalized absorbance ratios four minutes after adding 1 μM of the other metal ions (from left to right: blank, Zn2+, Mg2+, Pb2+, Cu2+, Ca2+, Mn2+, Co2+, Cd2+, Ba2+ and Hg2+). Red bars represent sensor responses after adding 1 μM of Hg2+ and 1 μM of another metal ion. The last red bar represents the sensor response when 1 μM of mercury was added to the pond water; the dilution factor was 1.5.
Since it had exhibited exquisite sensitivity and selectivity in buffer solutions, our sensor was further tested with pond water collected on the University of Illinois campus. Using the standard addition method, Hg2+ ions were added to the sensor solution in the pond water up to a final concentration of 1 μM. The sensor responded to Hg2+ very similarly, whether it was in pure or pond water (Fig. 5). Similar responses were also obtained with 100 and 300 nM mercury in pure and pond water. This is an indicator that our sensor is able to detect Hg2+ in pond water with little interference.
Although the success of this Hg2+ colorimetric sensor is an important step toward real-time sensing, the next step would be to convert this sensor into an even simpler Hg2+ dipstick test that does not require instruments such as a UV–vis spectrophotometer or quantitative solution transfer. As in the colorimetric sensing system, Hg2+-responsive AuNP aggregates containing two kinds of DNA-functionalized AuNPs and a 45-mer linker DNA were prepared. In this case, two kinds of thiol-modified DNA2 (biotinylated and non-biotinylated) were used to functionalize particle 2. Biotin modifications on the DNA strands () allowed the AuNPs to be captured by streptavidin. The optimal 1 : 1 ratio between two DNA molecules, which has been shown in our previous work,38 was used in this study.
Four overlapping pads of a lateral flow device were attached to a paper backing as follows (from top to bottom): absorption pad, HiFlow Plus membrane, glass fiber conjugation pad, and wicking pad. Aggregated AuNPs were prepared in a buffer containing 10 mM MOPS (pH 7.2), 150 mM NaNO3, and 8% sucrose, producing a dark-purple solution. Sucrose was added to the buffer to keep the DNA hybridized and facilitate the rehydration of the aggregates. The lateral-flow device was allowed to dry for 8 h. Aggregated AuNPs were spotted onto the conjugation pad, and streptavidin was applied to the HiFlow Plus membrane as a thin line (Fig. 2b). When the bottom of the dipstick was placed into the sample solution, the Hg2+ ions migrated to the aggregates and disassembled the aggregated particles. While the large size of the aggregates prevented them from migrating onto the conjugation pad,42 the small size of the dispersed AuNPs allowed them to migrate freely with the solution flow and be captured by streptavidin. Their capture and immobilization formed a thin red line that indicated the presence of Hg2+.
In order to test the performance of the lateral flow device, the dipstick was placed into flow buffers containing varying Hg2+ concentrations. In all cases, a dark band at the boundary between the conjugation pad and the membrane was observed (Fig. 6). The unreacted aggregates on the boundary provided a useful control which was due to the aggregated AuNPs that are so large they can no longer migrate along the membrane.38,42 As shown in Fig. 6, the intensity of the red line at the streptavidin capture zone increased as the concentration of Hg2+ increased. While colorimetric tests monitor a change in color, dipstick tests measure the intensity of a single color. Thus, the dipstick test can provide qualitative or semiquantitative results. In fact, for most lateral-flow-based detections, such as the pregnancy test, only a yes or no answer is required. In our current sensor design, the appearance of a faint red line in the case of a negative control requires further optimization, which is in progress.
Fig. 6.

Lateral-flow-based detection of Hg2+. Test of the mercury-sensing lateral-flow device with varying concentrations of Hg2+.
4. Conclusions
In summary, we have designed a highly sensitive and selective colorimetric sensor for mercury that is based on structure-switching DNA that contains mismatched thymine residues. The sensor is easy to use, shows a fast color change, and has a detection limit of 5.4 nM, which is lower than the 10 nM US EPA limit for Hg2+ in drinking water. Furthermore, we have immobilized AuNP aggregates onto a lateral-flow device, resulting in the first easy-to-use dipstick test for mercury. Their simple design makes the highly sensitive and selective colorimetric sensor and corresponding dipstick tests capable of carrying out real-time mercury detection in environmental and medical applications.
Acknowledgments
We wish to thank Mr Zidong Wang for helpful discussions and Ms. Hannah Ihms for proof-reading. The work described in this work is supported by the US National Institute of Health (ES16865), Department of Energy (DE-FG02-08ER64568), and the National Science Foundation (DMR-0117792, CTS-0120978 and DMI-0328162).
References
- 1.Cheng AKH, Sen D, Yu HZ. Bioelectrochemistry. 2009;77:1–12. doi: 10.1016/j.bioelechem.2009.04.007. [DOI] [PubMed] [Google Scholar]
- 2.Lindon JC, Holmes E, Nicholson JK. Curr Opin Mol Ther. 2004;6:265–272. [PubMed] [Google Scholar]
- 3.Famulok M, Hartig JS, Mayer G. Chem Rev. 2007;107:3715–3743. doi: 10.1021/cr0306743. [DOI] [PubMed] [Google Scholar]
- 4.Majidi J, Barar J, Baradaran B, Abdolalizadeh J, Omidi Y. Hum Antibodies. 2009;18:81–100. doi: 10.3233/HAB-2009-0204. [DOI] [PubMed] [Google Scholar]
- 5.Majumdar D, Peng XH, Shin DM. Curr Top Med Chem. 2010;10:1211–1226. doi: 10.2174/156802610791384171. [DOI] [PubMed] [Google Scholar]
- 6.Lu B, Smyth MR, O’Kennedy R. Analyst. 1996;121:29R–32R. doi: 10.1039/an996210029r. [DOI] [PubMed] [Google Scholar]
- 7.Wu G, Datar RH, Hansen KM, Thundat T, Cote RJ, Majumdar A. Nat Biotechnol. 2001;19:856–860. doi: 10.1038/nbt0901-856. [DOI] [PubMed] [Google Scholar]
- 8.Semjonow A, Oberpenning F, Weining C, Schon M, Brandt B, De Angelis G, Heinecke A, Hamm M, Stieber P, Hertle L, Schmid HP. Clin Chem. 2001;47:1472–1475. [PubMed] [Google Scholar]
- 9.Sreekumar A, Poisson LM, Rajendiran TM, Khan AP, Cao Q, Yu J, Laxman B, Mehra R, Lonigro RJ, Li Y, Nyati MK, Ahsan A, Kalyana-Sundaram S, Han B, Cao X, Byun J, Omenn GS, Ghosh D, Pennathur S, Alexander DC, Berger A, Shuster JR, Wei JT, Varambally S, Beecher C, Chinnaiyan AM. Nature. 2009;457:910–914. doi: 10.1038/nature07762. [DOI] [PMC free article] [PubMed] [Google Scholar] [Research Misconduct Found]
- 10.Yokel RA, Lasley SM, Dorman DC. J Toxicol Environ Health, Part B. 2006;9:63–85. doi: 10.1080/15287390500196230. [DOI] [PubMed] [Google Scholar]
- 11.Palmer AE, Jin C, Reed JC, Tsien RY. Proc Natl Acad Sci U S A. 2004;101:17404–17409. doi: 10.1073/pnas.0408030101. [DOI] [PMC free article] [PubMed] [Google Scholar]
- 12.O’Sullivan CK. Anal Bioanal Chem. 2002;372:44–48. doi: 10.1007/s00216-001-1189-3. [DOI] [PubMed] [Google Scholar]
- 13.Hilvert D. Annu Rev Biochem. 2000;69:751–793. doi: 10.1146/annurev.biochem.69.1.751. [DOI] [PubMed] [Google Scholar]
- 14.Ivask A, Virta M, Kahru A. Soil Biol Biochem. 2002;34:1439–1447. [Google Scholar]
- 15.Nolan EM, Lippard SJ. Chem Rev. 2008;108:3443–3480. doi: 10.1021/cr068000q. [DOI] [PubMed] [Google Scholar]
- 16.Fishman HA, Greenwald DR, Zare RN. Annu Rev Biophys Biomol Struct. 1998;27:165–198. doi: 10.1146/annurev.biophys.27.1.165. [DOI] [PubMed] [Google Scholar]
- 17.Zhao J, Jedlicka SS, Lannu JD, Bhunia AK, Rickus JL. Biotechnol Prog. 2006;22:32–37. doi: 10.1021/bp050154o. [DOI] [PubMed] [Google Scholar]
- 18.Liu J, Cao Z, Lu Y. Chem Rev. 2009;109:1948–1998. doi: 10.1021/cr030183i. [DOI] [PMC free article] [PubMed] [Google Scholar]
- 19.Breaker RR, Joyce GF. Chem Biol. 1994;1:223–229. doi: 10.1016/1074-5521(94)90014-0. [DOI] [PubMed] [Google Scholar]
- 20.Robertson DL, Joyce GF. Nature. 1990;344:467–468. doi: 10.1038/344467a0. [DOI] [PubMed] [Google Scholar]
- 21.Ellington AD, Szostak JW. Nature. 1990;346:818–822. doi: 10.1038/346818a0. [DOI] [PubMed] [Google Scholar]
- 22.Tuerk C, Gold L. Science. 1990;249:505–510. doi: 10.1126/science.2200121. [DOI] [PubMed] [Google Scholar]
- 23.Bunka DH, Stockley PG. Nat Rev Microbiol. 2006;4:588–596. doi: 10.1038/nrmicro1458. [DOI] [PubMed] [Google Scholar]
- 24.Lan T, Furuya K, Lu Y. Chem Commun. 2010;46:3896–3898. doi: 10.1039/b926910j. [DOI] [PMC free article] [PubMed] [Google Scholar]
- 25.Lee JH, Wang Z, Liu J, Lu Y. J Am Chem Soc. 2008;130:14217–14226. doi: 10.1021/ja803607z. [DOI] [PMC free article] [PubMed] [Google Scholar]
- 26.Lee JH, Yigit MV, Mazumdar D, Lu Y. Adv Drug Delivery Rev. 2010;62:592–602. doi: 10.1016/j.addr.2010.03.003. [DOI] [PMC free article] [PubMed] [Google Scholar]
- 27.Wang Z, Heon Lee J, Lu Y. Chem Commun. 2008:6005–6007. doi: 10.1039/b812755g. [DOI] [PMC free article] [PubMed] [Google Scholar]
- 28.Liu J, Lee JH, Lu Y. Anal Chem. 2007;79:4120–4125. doi: 10.1021/ac070055k. [DOI] [PubMed] [Google Scholar]
- 29.Liu J, Lu Y. Angew Chem, Int Ed. 2007;46:7587–7590. doi: 10.1002/anie.200702006. [DOI] [PubMed] [Google Scholar]
- 30.Wei H, Wang Z, Yang L, Tian S, Hou C, Lu Y. Analyst. 2010;135:1406–1410. doi: 10.1039/c0an00046a. [DOI] [PMC free article] [PubMed] [Google Scholar]
- 31.Ono A, Togashi H. Angew Chem, Int Ed. 2004;43:4300–4302. doi: 10.1002/anie.200454172. [DOI] [PubMed] [Google Scholar]
- 32.Lee JS, Han MS, Mirkin CA. Angew Chem, Int Ed. 2007;46:4093–4096. doi: 10.1002/anie.200700269. [DOI] [PubMed] [Google Scholar]
- 33.Xue X, Wang F, Liu X. J Am Chem Soc. 2008;130:3244–3245. doi: 10.1021/ja076716c. [DOI] [PubMed] [Google Scholar]
- 34.Li D, Wieckowska A, Willner I. Angew Chem, Int Ed. 2008;47:3927–3931. doi: 10.1002/anie.200705991. [DOI] [PubMed] [Google Scholar]
- 35.Xie JP, Zheng YG, Ying JY. Chem Commun. 2010;46:961–963. doi: 10.1039/b920748a. [DOI] [PubMed] [Google Scholar]
- 36.Yigit MV, Mishra A, Tong R, Cheng J, Wong GC, Lu Y. Chem Biol. 2009;16:937–942. doi: 10.1016/j.chembiol.2009.08.011. [DOI] [PubMed] [Google Scholar]
- 37.Mazumdar D, Liu J, Lu G, Zhou J, Lu Y. Chem Commun. 2010;46:1416–1418. doi: 10.1039/b917772h. [DOI] [PMC free article] [PubMed] [Google Scholar]
- 38.Liu J, Mazumdar D, Lu Y. Angew Chem, Int Ed. 2006;45:7955–7959. doi: 10.1002/anie.200603106. [DOI] [PubMed] [Google Scholar]
- 39.Mirkin CA. Inorg Chem. 2000;39:2258–2272. doi: 10.1021/ic991123r. [DOI] [PubMed] [Google Scholar]
- 40.Zhao W, Ali MM, Aguirre SD, Brook MA, Li Y. Anal Chem. 2008;80:8431–8437. doi: 10.1021/ac801008q. [DOI] [PubMed] [Google Scholar]
- 41.Liu J, Lu Y. Nat Protoc. 2006;1:246–252. doi: 10.1038/nprot.2006.38. [DOI] [PubMed] [Google Scholar]
- 42.Liu J, Lu Y. Angew Chem, Int Ed. 2006;45:90–94. [Google Scholar]
- 43.Tanaka Y, Oda S, Yamaguchi H, Kudo M, Kondo Y, Kojima C, Ono A. Nucleic Acids Symp Ser. 2006;50:47–48. doi: 10.1093/nass/nrl024. [DOI] [PubMed] [Google Scholar]
- 44.Kumar M, Dhir A, Bhalla V, Sharma R, Puri RK, Mahajan RK. Analyst. 2010;135:1600–1605. doi: 10.1039/b922072k. [DOI] [PubMed] [Google Scholar]
- 45.Zhang L, Li T, Li B, Li J, Wang E. Chem Commun. 2010;46:1476–1478. doi: 10.1039/b921191h. [DOI] [PubMed] [Google Scholar]
- 46.Wang H, Wang Y, Jin J, Yang R. Anal Chem. 2008;80:9021–9028. doi: 10.1021/ac801382k. [DOI] [PubMed] [Google Scholar]
- 47.Miyake Y, Togashi H, Tashiro M, Yamaguchi H, Oda S, Kudo M, Tanaka Y, Kondo Y, Sawa R, Fujimoto T, Machinami T, Ono A. J Am Chem Soc. 2006;128:2172–2173. doi: 10.1021/ja056354d. [DOI] [PubMed] [Google Scholar]